

Organization of enzyme concentration across the metabolic network in cancer cells
- PMID: 25621879
- PMCID: PMC4306493
- DOI: 10.1371/journal.pone.0117131
Organization of enzyme concentration across the metabolic network in cancer cells
Abstract
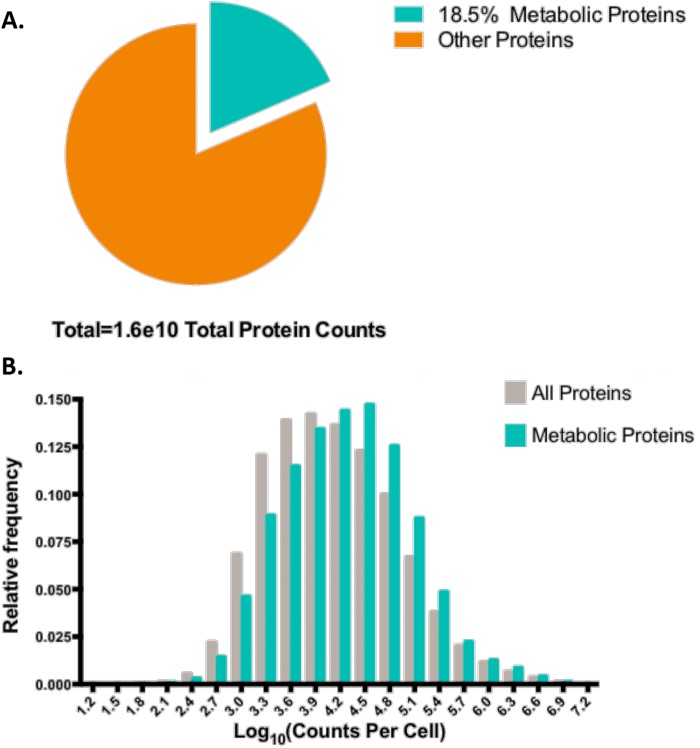
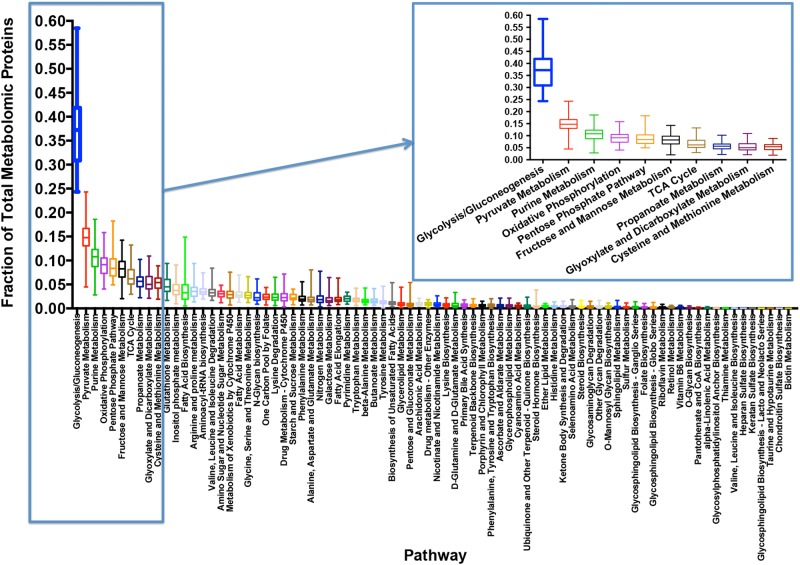
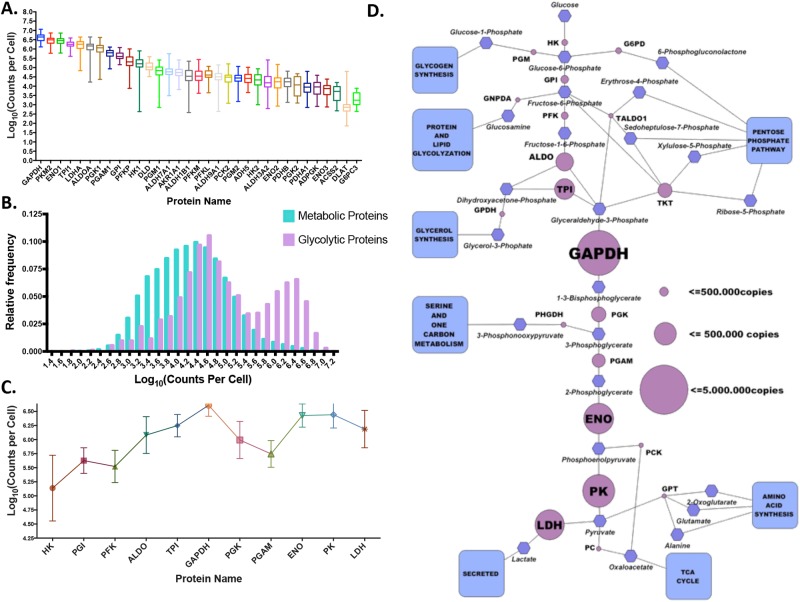
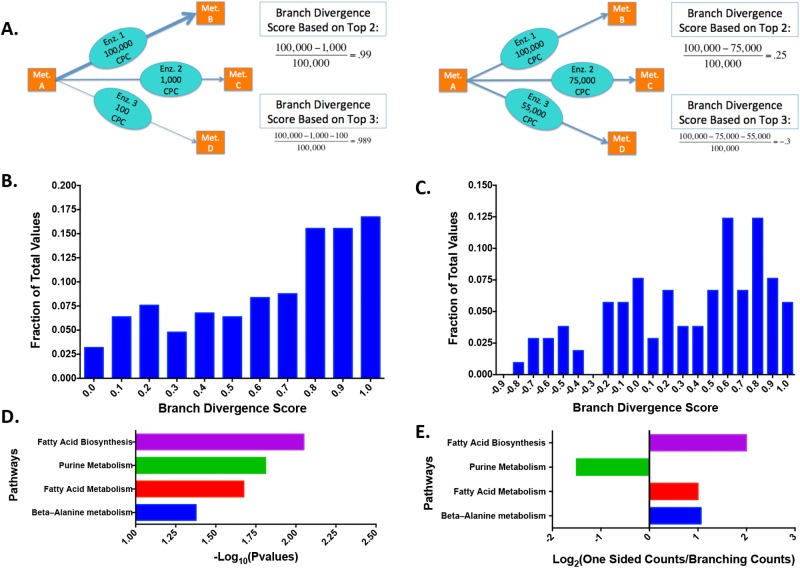
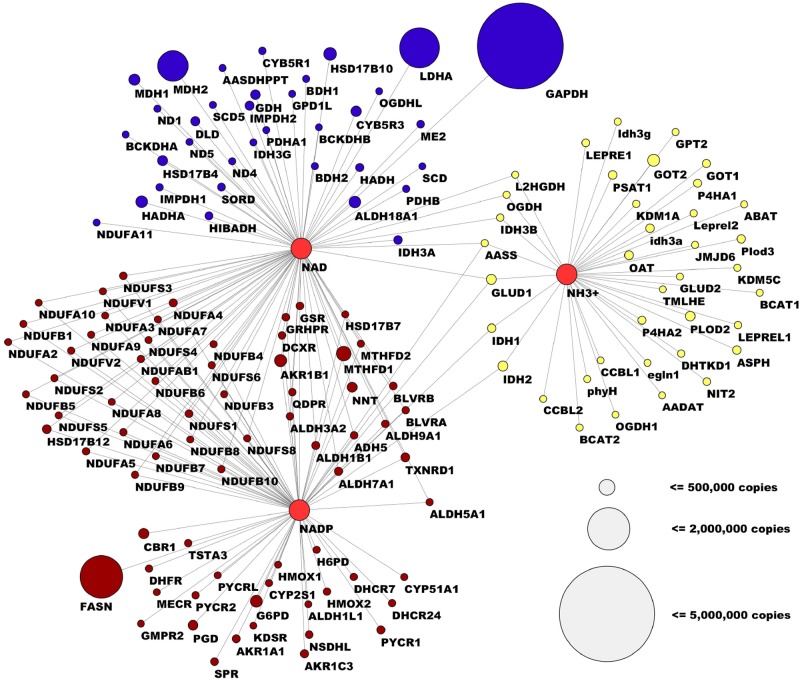
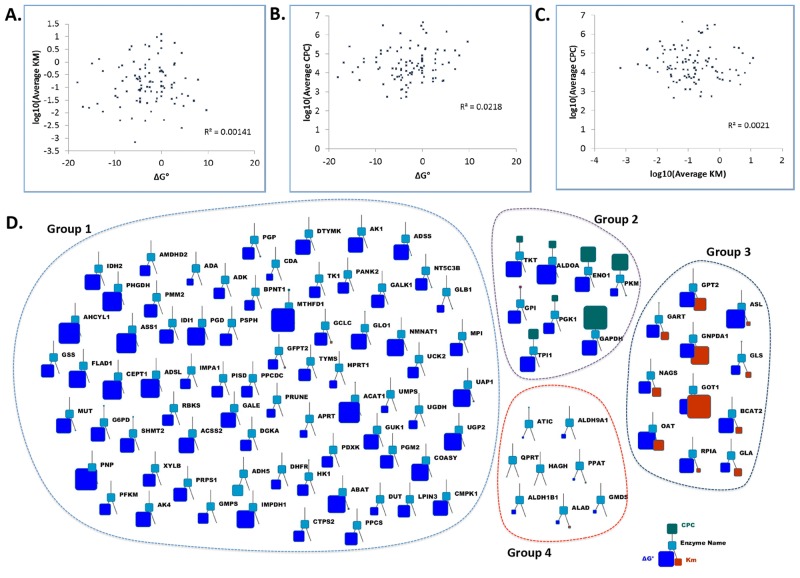
Rapid advances in mass spectrometry have allowed for estimates of absolute concentrations across entire proteomes, permitting the interrogation of many important biological questions. Here, we focus on a quantitative aspect of human cancer cell metabolism that has been limited by a paucity of available data on the abundance of metabolic enzymes. We integrate data from recent measurements of absolute protein concentration to analyze the statistics of protein abundance across the human metabolic network. At a global level, we find that the enzymes in glycolysis comprise approximately half of the total amount of metabolic proteins and can constitute up to 10% of the entire proteome. We then use this analysis to investigate several outstanding problems in cancer metabolism, including the diversion of glycolytic flux for biosynthesis, the relative contribution of nitrogen assimilating pathways, and the origin of cellular redox potential. We find many consistencies with current models, identify several inconsistencies, and find generalities that extend beyond current understanding. Together our results demonstrate that a relatively simple analysis of the abundance of metabolic enzymes was able to reveal many insights into the organization of the human cancer cell metabolic network.
Conflict of interest statement
Figures
Similar articles
-
First insight into the human liver proteome from PROTEOME(SKY)-LIVER(Hu) 1.0, a publicly available database.J Proteome Res. 2010 Jan;9(1):79-94. doi: 10.1021/pr900532r. J Proteome Res. 2010. PMID: 19653699
-
3-Bromopyruvate treatment induces alterations of metabolic and stress-related pathways in glioblastoma cells.J Proteomics. 2017 Jan 30;152:329-338. doi: 10.1016/j.jprot.2016.11.013. Epub 2016 Nov 24. J Proteomics. 2017. PMID: 27890797
-
Integrating Proteomics and Enzyme Kinetics Reveals Tissue-Specific Types of the Glycolytic and Gluconeogenic Pathways.J Proteome Res. 2015 Aug 7;14(8):3263-73. doi: 10.1021/acs.jproteome.5b00276. Epub 2015 Jul 1. J Proteome Res. 2015. PMID: 26080680
-
Compartmentation in plant metabolism.J Exp Bot. 2007;58(1):35-47. doi: 10.1093/jxb/erl134. Epub 2006 Oct 9. J Exp Bot. 2007. PMID: 17030538 Review.
-
The disulfide proteome and other reactive cysteine proteomes: analysis and functional significance.Antioxid Redox Signal. 2011 Jun 15;14(12):2581-642. doi: 10.1089/ars.2010.3551. Epub 2011 Mar 31. Antioxid Redox Signal. 2011. PMID: 21275844 Review.
Cited by
-
A Flux Balance of Glucose Metabolism Clarifies the Requirements of the Warburg Effect.Biophys J. 2016 Sep 6;111(5):1088-100. doi: 10.1016/j.bpj.2016.07.028. Biophys J. 2016. PMID: 27602736 Free PMC article.
-
New concepts in feedback regulation of glucose metabolism.Curr Opin Syst Biol. 2018 Apr;8:32-38. doi: 10.1016/j.coisb.2017.11.005. Epub 2017 Dec 5. Curr Opin Syst Biol. 2018. PMID: 31602417 Free PMC article.
-
Revisiting the Crabtree/Warburg effect in a dynamic perspective: a fitness advantage against sugar-induced cell death.Cell Cycle. 2018;17(6):688-701. doi: 10.1080/15384101.2018.1442622. Cell Cycle. 2018. PMID: 29509056 Free PMC article. Review.
-
Targeting glycolysis in esophageal squamous cell carcinoma: single-cell and multi-omics insights for risk stratification and personalized therapy.Front Pharmacol. 2025 Mar 6;16:1559546. doi: 10.3389/fphar.2025.1559546. eCollection 2025. Front Pharmacol. 2025. PMID: 40115255 Free PMC article.
-
Phosphoglycolate has profound metabolic effects but most likely no role in a metabolic DNA response in cancer cell lines.Biochem J. 2019 Feb 19;476(4):629-643. doi: 10.1042/BCJ20180435. Biochem J. 2019. PMID: 30670572 Free PMC article.
References
Publication types
MeSH terms
Substances
Grants and funding
LinkOut - more resources
Full Text Sources
Other Literature Sources
