. 2015 Feb;17(2):183-94.
doi: 10.1038/ncb3094. Epub 2015 Jan 26.

Breast-cancer-secreted miR-122 reprograms glucose metabolism in premetastatic niche to promote metastasis

Affiliations

Breast-cancer-secreted miR-122 reprograms glucose metabolism in premetastatic niche to promote metastasis

Miranda Y Fong et al. Nat Cell Biol. 2015 Feb.

Abstract

Reprogrammed glucose metabolism as a result of increased glycolysis and glucose uptake is a hallmark of cancer. Here we show that cancer cells can suppress glucose uptake by non-tumour cells in the premetastatic niche, by secreting vesicles that carry high levels of the miR-122 microRNA. High miR-122 levels in the circulation have been associated with metastasis in breast cancer patients, and we show that cancer-cell-secreted miR-122 facilitates metastasis by increasing nutrient availability in the premetastatic niche. Mechanistically, cancer-cell-derived miR-122 suppresses glucose uptake by niche cells in vitro and in vivo by downregulating the glycolytic enzyme pyruvate kinase. In vivo inhibition of miR-122 restores glucose uptake in distant organs, including brain and lungs, and decreases the incidence of metastasis. These results demonstrate that, by modifying glucose utilization by recipient premetastatic niche cells, cancer-derived extracellular miR-122 is able to reprogram systemic energy metabolism to facilitate disease progression.


Conflict of interest statement

The authors declare no conflict of interest.

Figures

Figure 1
Figure 1
MiR-122 is highly secreted by cancer cells. RNA were extracted from the 110,000 ×g medium pellet (a) and PBS-washed cells (b) and analysed for miR-122 by RT-qPCR. Data was normalized to levels of total proteins (secreted; a) or U6 (cellular; b), and compared to the non-tumour line MCF10A (n = 6 extracts). (c) Representative EM images of vesicles in the 110,000 ×g medium pellet. Bar equals 100 nm. (d) Size distribution of vesicles identified in the 110,000 ×g medium pellets (n = 25 vesicles for MCF10A/vec; n = 38 for MCF10A/miR-122; n = 94 for MDA-MB-231). (e) Fractogram (UV absorption at 280 nm) for the AF4 eluates characterizing the MDA-MB-231 110,000 ×g medium pellet. (f) A representative EM image of MDA-MB-231-derived vesicles in the fraction eluted at 18–25 min. The measured diameter of vesicles was shown as mean ± SD (n = 41). Bar equals 100 nm. (g) RT-qPCR-determined levels of miR-122 and miR-16 in MDA-MB-231-derived protein and vesicle fractions separated by AF4 (n = 6 extracts). Absolute miRNA levels are calculated based on standard curves. ND: not detected. (h) After sucrose gradient centrifugation of MDA-MB-231-derived 110,000 ×g medium pellet, absolute miRNA levels in each gradient fraction was determined by RT-qPCR and calculated based on standard curves (n = 6 extracts). A representative EM image of MDA-MB-231-derived vesicles in sucrose fraction 5 (F5) is shown. Bar equals 100 nm. * p < 0.05 for all panels derived from Kruskal-Wallis test. Data are represented as mean ± SD in all panels except (c–e).
Figure 2
Figure 2
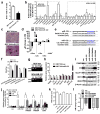
MiR-122 suppresses glucose metabolism by downregulating PKM. (a) BrdU uptake in indicated cells were analysed by flow cytometry (n = 6 biological replicates). (b) Quantification of intracellular metabolites by NMR spectroscopy (n = 3 biological replicates). (c) Glycogen staining (red) in MCF10A/vec and MCF10A/miR-122 cells. Bar equals 100 μm. (d) Change of metabolites in the media after 72 h of culture (n = 6 biological replicates). (e) The predicted miR-122 binding site in the 3′UTR of the human PKM and CS gene. The corresponding sequence in the mutated (mt) version is also shown. (f) The psiCHECK reporters containing 3′UTR of human PKM and CS gene with wild-type (wt) or mutated (mt) miR-122 binding site were used to transfect MCF10A cells stably expressing miR-122 or the empty vector (as control). Luciferase activity was analysed at 48 h post-transfection (n = 6 extracts). (g) Determination of PKM isoforms expressed in MCF10A and MDA-MB-231. RNA was subjected to RT-PCR followed by digestion with NcoI (N), PstI (P), or both enzymes (NP), plus an uncut control (U). Products were separated on an agarose gel with Sybr safe. The presence of a PstI digestion site indicates the splicing isoform M2 whereas the NcoI site indicates isoform M1. Size of markers (in bp) are indicated. (h) RT-qPCR analysis showing the relative expression of indicated genes in MCF10A/miR-122 and MCF10A/vec cells (n = 6 extracts). (i) Western blot analysis in MCF10A/miR-122 and MCF10A/vec cells with restored expression of PKM2 and CS. Size of markers (in kDa) are indicated. (j) RT-qPCR analysis in selected colonies with restored expression of PKM2 and CS (n = 6 extracts). (k) PKM activity (unit) in 5 μg proteins in indicated cells (n = 6 extracts). (l) Change of glucose in the media after 72 h of culture of selected clones normalized to cell number (n = 3 biological replicates). * p < 0.05, ** p < 0.01 for all panels derived from Kruskal-Wallis test. Data are represented as mean ± SD in all panels except (c, e, g, i). Uncropped images of blots and gels are shown in Supplementary Fig. 5.
Figure 3
Figure 3
Cancer-secreted miR-122 downregulates glucose uptake in lung fibroblasts. (a) Uptake of DiI-labelled exosome-containing EVs (prepared from the 110,000 ×g medium pellet) at 48 h. Bar equals 60 μm. (b) Levels of miRNAs in fibroblasts pre-treated with 10 μM DRB for 2 h followed by treatment with EVs for 16 h. miR-122 levels were normalized to U6 (n = 6 extracts). (c) Determination of PKM isoforms in fibroblasts and mouse tissues by RT-PCR as indicated in Fig. 2g. Size of markers (in bp) are indicated. (d–h) Fibroblasts were treated with two doses of EVs from indicated producer cells given 48 h apart and transfected with anti-miR-122 oligos or mismatch control oligos, before analysis at 96 h by (d) RT-qPCR (n = 6 extracts), (e) Western blot analysis (with marker size indicated in kDa), (f) PKM activity assay using 5 μg of proteins (n = 5 biological replicates), (g) 2-NBDG uptake (n = 6 biological replicates), and (h) change of glucose in the CM (n = 9 biological replicates). (i) Change of glucose in the CM of fibroblasts transfected with expression plasmids containing the ORF but not 3′UTR of PKM2 or GLUT1, or the empty vector, and treated with EVs from indicated producer cells (n = 5 biological replicates). (j) Western blot of fibroblasts transfected with expression plasmids for PKM2 or GLUT1. Size of markers (in kDa) are indicated. (k) 2-NBDG uptake in siRNA-transfected fibroblasts (n = 5 biological replicates). (l) CM was collected from siRNA-transfected fibroblasts cultured for 72 h and the glucose concentration measured. The CM was then fed to MDA-MB-231-HM cells before proliferation was assessed by BrdU-incorporation at 72 h (n = 6 biological replicates). (m) Circulating EVs were extracted from pooled healthy donor sera and from BC patients’ sera with low or high vesicular miR-122, used to treat fibroblasts and 2-NBDG uptake was measured (n = 8 biological replicates). * p < 0.05, ** p < 0.01 for all panels derived from Kruskal-Wallis test. Data are represented as mean ± SD in all panels except (a, c, e, j). Uncropped images of blots and gels are shown in Supplementary Fig. 5.
Figure 4
Figure 4
Cancer-secreted miR-122 downregulates glucose uptake in astrocytes. (a–b) EV uptake by astrocytes and neurons. Indicated cells were incubated with DiI-labelled EVs (red) for 48 h before fluorescent and phase contrast images were captured. Bar equals 60 μm. (c) Determination of PKM isoforms in primary mouse cells and mouse tissues by RT-PCR as indicated in Fig. 2g. Size of markers (in bp) are indicated. (d–h) Primary mouse astrocytes were treated with two doses of EVs from indicated producer cells given 48 h apart, before subjected to (d–e) RT-qPCR at 72 h for miR-122 (n = 6 extracts) (d) and PKM2 (n = 6 extracts) (e), (f) Western blot analysis for PKM2 and GLUT1 at 96 h (with marker size indicated in kDa), (g) PKM activity assay using 10 μg of proteins (n = 5 biological replicates), and (h) 2-NBDG uptake assay (n = 5 biological replicates). * p < 0.05, ** p < 0.01 for all panels derived from Kruskal-Wallis test. Data are represented as mean ± SD in (d–e & g–h). Uncropped images of blots and gels are shown in Supplementary Fig. 5.
Figure 5
Figure 5
Vesicular transfer of miR-122 alters glucose uptake in niche tissues. Indicated EVs were intravenously injected into the tail vein of NSG mice biweekly for 3.5 weeks. (a) Co-immunofluorescence of exosome marker CD63 (detected by a human-specific antibody; red) with astrocyte marker GFAP (white) or fibroblast marker FSP-1 (white) in brain and lung tissues of mice injected with 2-NBDG (green). Nuclei were counterstained with DAPI (blue). White bar represents 20 μm. (b) Quantification of 2-NBDG uptake in brain (n = 20 fields from 4 mice). (c) Quantification of 2-NBDG uptake in lung (n = 20 fields from 4 mice). (d–e) RT-qPCR in brain (d) and lungs (e) (n = 9 extracts from 3 mice). (f–g) Luciferase qPCR for the detection of metastases in the brain (f) and lungs (g) of mice pre-treated with EVs followed by an intracardiac injection with luciferase-labelled MDA-MB-231-HM tumour cells (n = 15 extracts from 5 mice). (h) MiR-122 levels determined by RT-qPCR in the serum of non-tumour bearing mice (group 1), mice bearing MCFDCIS or MDA-MB-231-HM tumours (groups 2–3), and non-tumour-bearing mice treated with EVs from MCF10A/vec, MCF10A/miR-122, or MDA-MB-231 cells (groups 4–6) (n = 15 extracts from 5 mice). Data was normalized to the levels of miR-16. Data are represented as mean ± SD for all panels except (a). * p < 0.05, ** p < 0.01, *** p < 0.001 for all panels derived from Kruskal-Wallis test.
Figure 6
Figure 6
In vivo effect of miR-122 on primary tumour growth and metastasis. (a) Tumour growth curve in mice carrying MCFDCIS/vec and MCFDCIS/miR-122 orthotopic xenografts (n = 7 mice). (b) BLI imaging at week 3. (c) Luciferase quantification of (b) (n = 7 mice). (d) IHC for Ki67, PKM1/2, and GLUT1 in tumour, brain, and lung sections. Scale bar is 100 μm. (e) Quantification of Ki67+ tumour cells from 3 fields per tumour (n = 6 mice per group). (f) Intratumoural levels of ATP were assessed in tumour lysates by ENLIGHTEN ATP assay (n = 6 mice per group). (g) miR-122 levels in the brain and lungs determined by RT-qPCR (n = 18 extracts from 6 mice). (h) 2-NBDG uptake quantification in the tumour, brain, and lungs (n = 12 fields from 4 mice per group). (i–j) Luciferase qPCR in the brain (i, n = 24 extracts from 8 mice per group) and lungs (j, n = 18 extracts from 6 mice per group) of MCFDCIS tumour-bearing mice. (k) Tumour growth curve in mice carrying orthotopic xenografts of MDA-MB-231 with stable knockdown of miR-122 (MDA-MB-231/122KD) and also receiving EV treatments as indicated (n = 7 mice per group). No significant difference (p > 0.05) between groups based on Kruskal-Wallis test. (l–m) Luciferase qPCR for the detection of metastases in the brain (l) and lungs (m) of mice bearing MDA-MB-231/122KD tumours and treated with indicated EVs (n = 12 extracts from 4 mice per group). * p < 0.05, ** p < 0.01, *** p < 0.001 for all panels derived from Kruskal-Wallis test. Data are represented as mean ± SD in all panels except (b & d).
Figure 7
Figure 7
MiR-122 intervention alleviates cancer-induced glucose reallocation in vivo and reduces metastasis. Luciferase-labelled MDA-MB-231-HM cells were injected into the No. 4 mammary fat pad of NSG mice. Mice were divided into 3 groups (n = 8 mice per group) for treatment with PBS, anti-miR-122, or mismatch control oligos. (a) Tumour growth curve (n = 8 mice). No significant difference (p > 0.05) between groups based on Kruskal-Wallis test. (b) 2-NBDG uptake in the tumour and tumour-adjacent stroma (n = 20 fields from 4 mice per group). (c) Primary tumour sections were analysed by IHC (for PKM2 and GLUT1) and ISH (for miR-122). For 2-NBDG (green) uptake, sections were counterstained with DAPI (blue) to show nuclei. Dotted line delineates tumour (T) from stroma (S). White bar represents 100 μm. (d) BLI at week 5 indicating extensive brain and lung metastases in PBS and mismatch groups and reduced incidence of metastasis in anti-miR-122 group. (e) Quantification of BLI at week 5 (n = 8 mice per group). (f) Representative images of 2-NBDG uptake fluorescence. White bar represents 60 μm. (g) Quantification of 2-NBDG uptake in the brain and lungs of tumour-free (normal) NSG mice and tumour bearing mice that were untreated when sacrificed at week 3 after tumour cell implantation or treated as indicated and sacrificed at week 6 (n = 20 fields from 4 mice per group). (h–i) RT-qPCR in brain (h) and lungs (i) of tumour-free and tumour bearing mice (n = 12 extracts from 4 mice per group). (j) GLUT1 IHC in brain and lungs. Scale bar is 60 μm. Data are represented as mean ± SD in all panels except (c–d, f, & j). * p < 0.05, ** p < 0.01, *** p < 0.001 for all panels derived from Kruskal-Wallis test.

Comment in

Similar articles

Cited by

References

    1. Hanahan D, Weinberg RA. Hallmarks of cancer: the next generation. Cell. 2011;144:646–674. - PubMed
    1. Vander Heiden MG, Cantley LC, Thompson CB. Understanding the Warburg effect: the metabolic requirements of cell proliferation. Science. 2009;324:1029–1033. - PMC - PubMed
    1. Zhao FQ, Keating AF. Functional properties and genomics of glucose transporters. Curr Genomics. 2007;8:113–128. - PMC - PubMed
    1. DeBerardinis RJ, Lum JJ, Hatzivassiliou G, Thompson CB. The biology of cancer: metabolic reprogramming fuels cell growth and proliferation. Cell Metab. 2008;7:11–20. - PubMed
    1. Barthel A, et al. Regulation of GLUT1 gene transcription by the serine/threonine kinase Akt1. J Biol Chem. 1999;274:20281–20286. - PubMed

Publication types

MeSH terms