

Conformational frustration in calmodulin-target recognition
- PMID: 25622562
- PMCID: PMC4477201
- DOI: 10.1002/jmr.2413
Conformational frustration in calmodulin-target recognition
Abstract
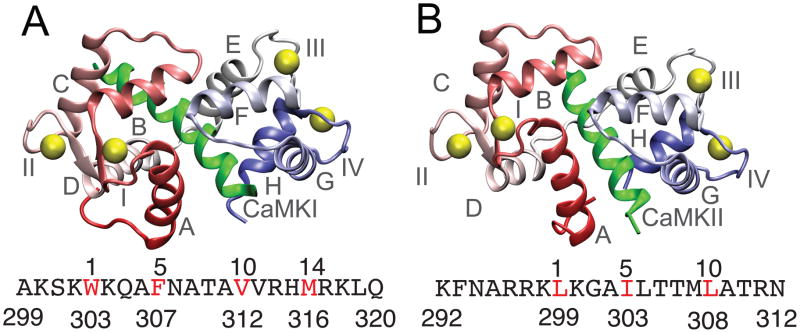
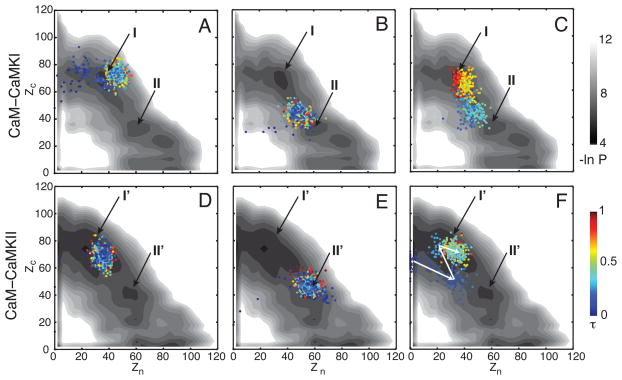
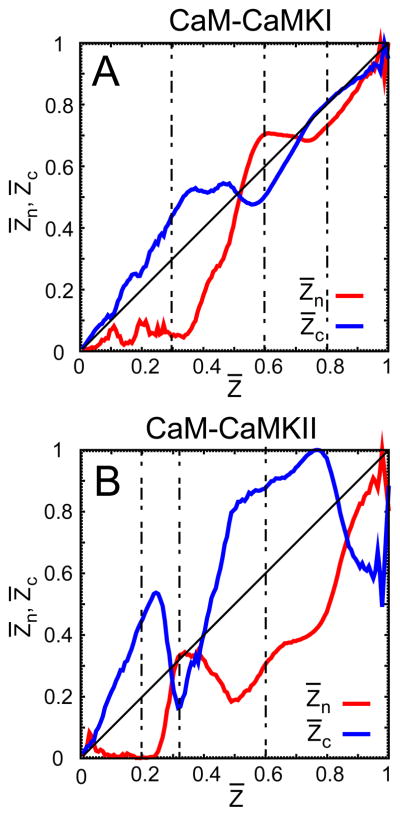
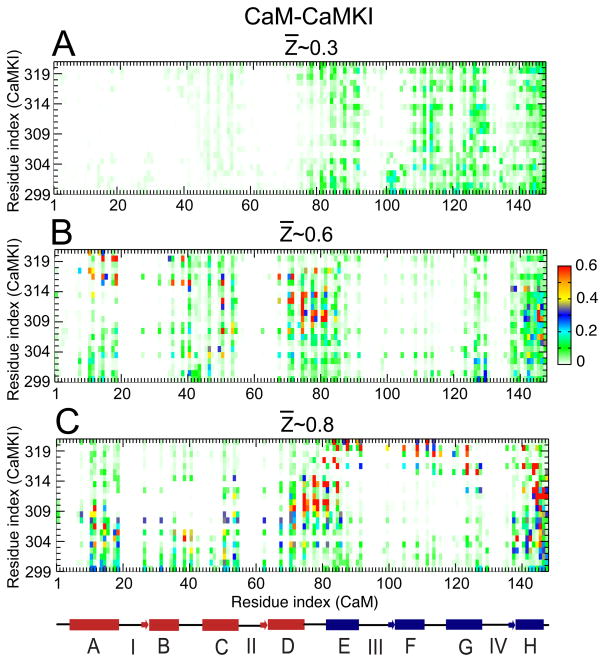
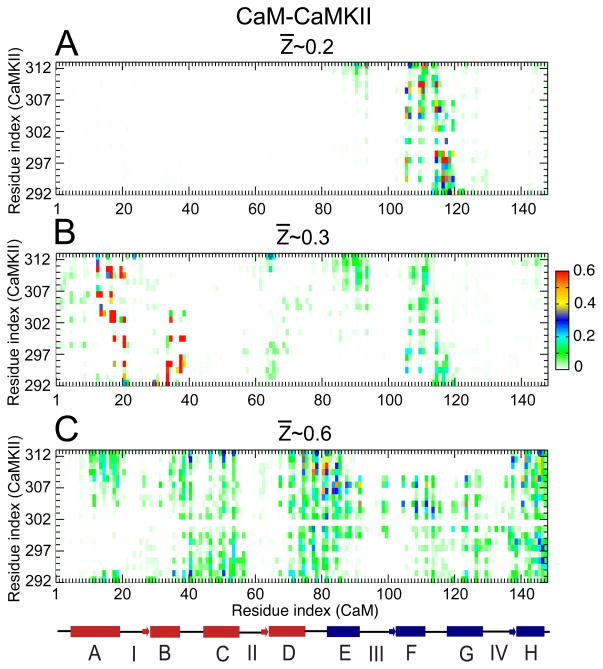
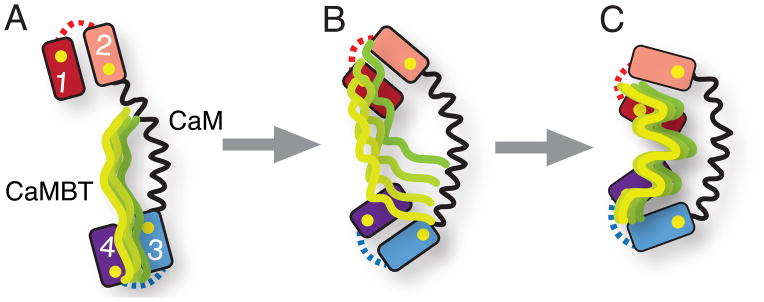
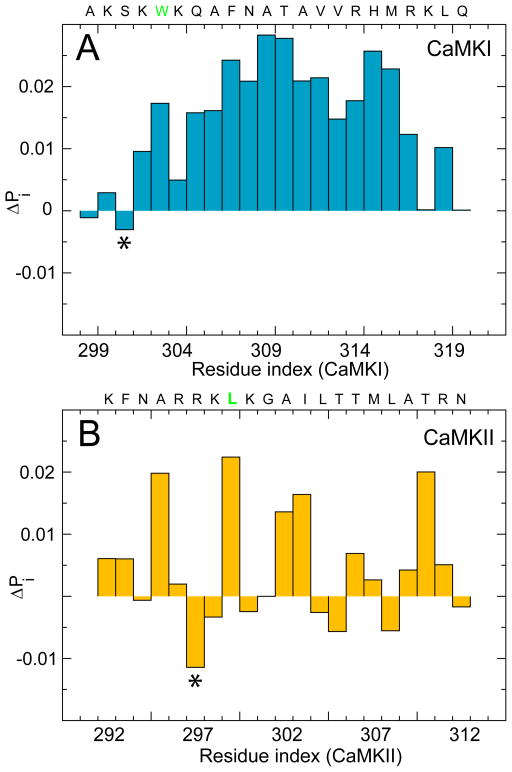
Calmodulin (CaM) is a primary calcium (Ca(2+) )-signaling protein that specifically recognizes and activates highly diverse target proteins. We explored the molecular basis of target recognition of CaM with peptides representing the CaM-binding domains from two Ca(2+) -CaM-dependent kinases, CaMKI and CaMKII, by employing experimentally constrained molecular simulations. Detailed binding route analysis revealed that the two CaM target peptides, although similar in length and net charge, follow distinct routes that lead to a higher binding frustration in the CaM-CaMKII complex than in the CaM-CaMKI complex. We discovered that the molecular origin of the binding frustration is caused by intermolecular contacts formed with the C-domain of CaM that need to be broken before the formation of intermolecular contacts with the N-domain of CaM. We argue that the binding frustration is important for determining the kinetics of the recognition process of proteins involving large structural fluctuations.
Keywords: binding frustration; binding route analysis; calmodulin; calmodulin-binding targets; coarse-grained molecular simulations; protein-protein association; target recognition.
Copyright © 2015 John Wiley & Sons, Ltd.
Figures
Similar articles
-
Opposing Intermolecular Tuning of Ca2+ Affinity for Calmodulin by Neurogranin and CaMKII Peptides.Biophys J. 2017 Mar 28;112(6):1105-1119. doi: 10.1016/j.bpj.2017.01.020. Biophys J. 2017. PMID: 28355539 Free PMC article.
-
Structure of the complex of calmodulin with the target sequence of calmodulin-dependent protein kinase I: studies of the kinase activation mechanism.Biochemistry. 2002 Dec 17;41(50):14669-79. doi: 10.1021/bi026660t. Biochemistry. 2002. PMID: 12475216
-
Energetics of calmodulin domain interactions with the calmodulin binding domain of CaMKII.Proteins. 2009 Jul;76(1):47-61. doi: 10.1002/prot.22317. Proteins. 2009. PMID: 19089983 Free PMC article.
-
Structure, dynamics and interaction with kinase targets: computer simulations of calmodulin.Biochim Biophys Acta. 2004 Mar 11;1697(1-2):289-300. doi: 10.1016/j.bbapap.2003.11.032. Biochim Biophys Acta. 2004. PMID: 15023369 Review.
-
Neuronal CA2+/calmodulin-dependent protein kinase II: the role of structure and autoregulation in cellular function.Annu Rev Biochem. 2002;71:473-510. doi: 10.1146/annurev.biochem.71.110601.135410. Epub 2001 Nov 9. Annu Rev Biochem. 2002. PMID: 12045104 Review.
Cited by
-
Sequence-structure-function relationships in class I MHC: A local frustration perspective.PLoS One. 2020 May 18;15(5):e0232849. doi: 10.1371/journal.pone.0232849. eCollection 2020. PLoS One. 2020. PMID: 32421728 Free PMC article.
-
ProSNEx: a web-based application for exploration and analysis of protein structures using network formalism.Nucleic Acids Res. 2019 Jul 2;47(W1):W471-W476. doi: 10.1093/nar/gkz390. Nucleic Acids Res. 2019. PMID: 31114881 Free PMC article.
-
Frustration, function and folding.Curr Opin Struct Biol. 2018 Feb;48:68-73. doi: 10.1016/j.sbi.2017.09.006. Epub 2017 Nov 5. Curr Opin Struct Biol. 2018. PMID: 29101782 Free PMC article. Review.
-
Calmodulin 2 Facilitates Angiogenesis and Metastasis of Gastric Cancer via STAT3/HIF-1A/VEGF-A Mediated Macrophage Polarization.Front Oncol. 2021 Sep 15;11:727306. doi: 10.3389/fonc.2021.727306. eCollection 2021. Front Oncol. 2021. PMID: 34604066 Free PMC article.
-
LncRNA ABHD11-AS1 Elevates CALM2 to Promote Metastasis of Thyroid Cancer Through Sponging miR-876-5p.Biochem Genet. 2025 Mar 21. doi: 10.1007/s10528-025-11072-9. Online ahead of print. Biochem Genet. 2025. PMID: 40117023
References
-
- Alsallaq R, Zhou HX. Prediction of protein-protein association rates from a transition-state theory. Structure. 2007b;15(2):215–224. - PubMed
-
- Barbato G, Ikura M, Kay LE, Pastor RW, Bax A. Backbone dynamics of calmodulin studied by 15N relaxation using inverse detected two-dimensional NMR spectroscopy: the central helix is flexible. Biochemistry. 1992;31(23):5269–78. - PubMed
Publication types
MeSH terms
Substances
Grants and funding
LinkOut - more resources
Full Text Sources
Other Literature Sources
Miscellaneous
