

Translationally controlled tumor protein induces epithelial to mesenchymal transition and promotes cell migration, invasion and metastasis
- PMID: 25622969
- PMCID: PMC4306963
- DOI: 10.1038/srep08061
Translationally controlled tumor protein induces epithelial to mesenchymal transition and promotes cell migration, invasion and metastasis
Abstract
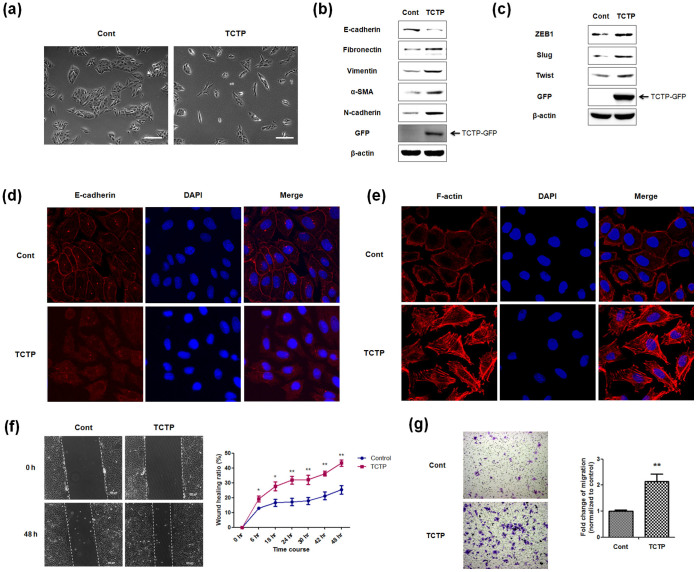
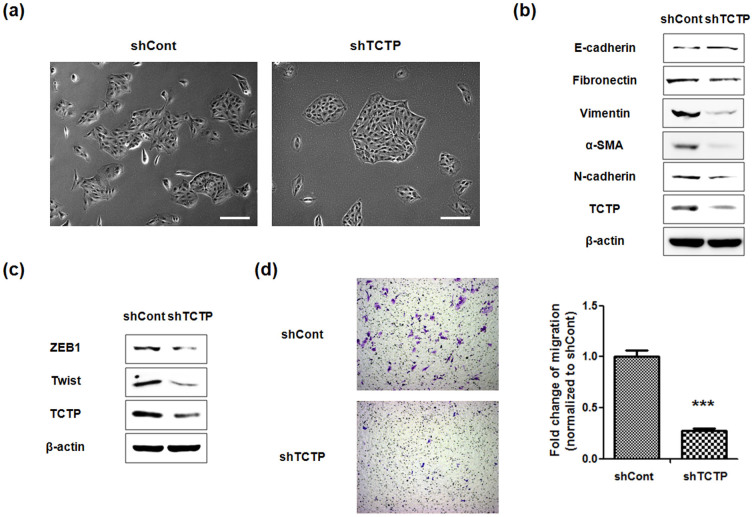
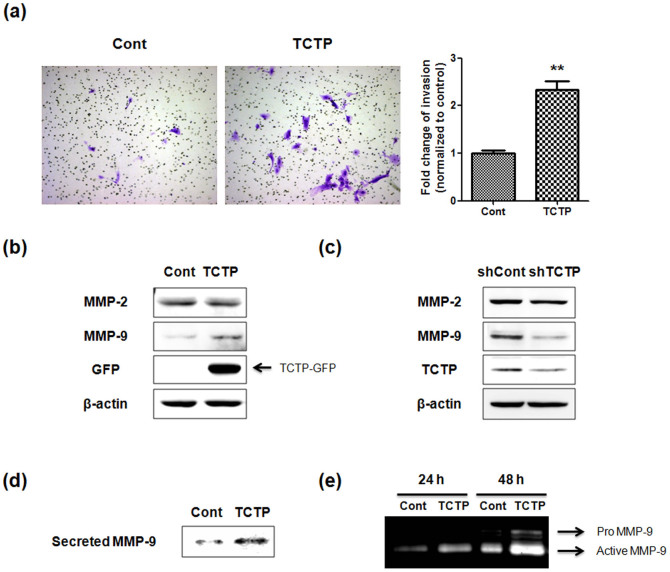
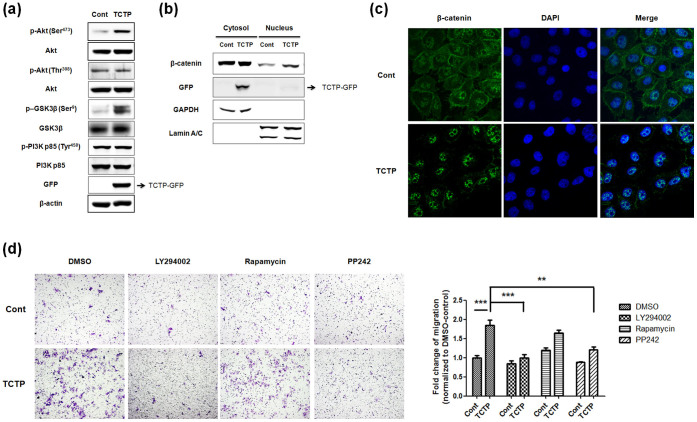
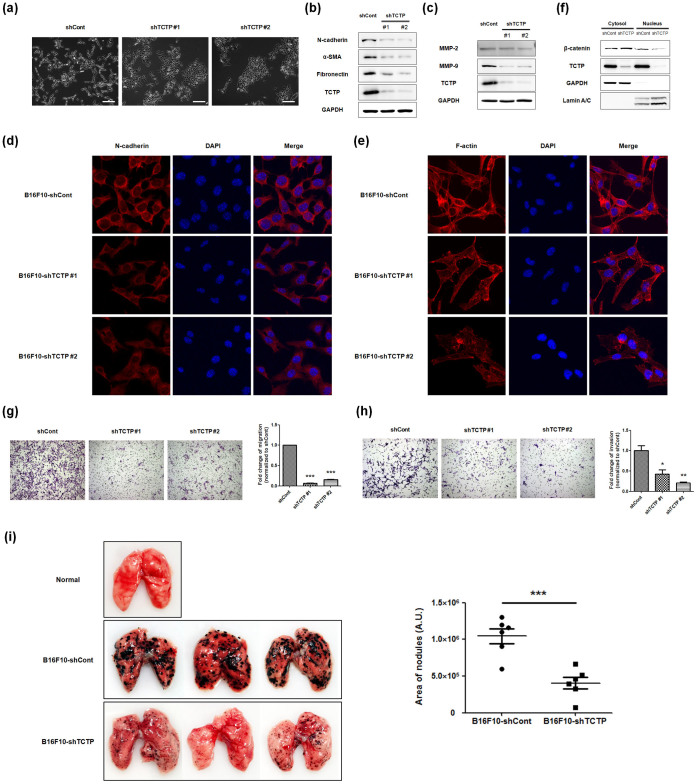
Translationally controlled tumor protein (TCTP), is a highly conserved protein involved in fundamental processes, such as cell proliferation and growth, tumorigenesis, apoptosis, pluripotency, and cell cycle regulation. TCTP also inhibits Na,K-ATPase whose subunits have been suggested as a marker of epithelial-to-mesenchymal transition (EMT), a crucial step during tumor invasiveness, metastasis and fibrosis. We hypothesized that, TCTP might also serve as an EMT inducer. This study attempts to verify this hypothesis. We found that overexpression of TCTP in a porcine renal proximal tubule cell line, LLC-PK1, induced EMT-like phenotypes with the expected morphological changes and appearance of EMT related markers. Conversely, depletion of TCTP reversed the induction of these EMT phenotypes. TCTP overexpression also enhanced cell migration via activation of mTORC2/Akt/GSK3β/β-catenin, and invasiveness by activating MMP-9. Moreover, TCTP depletion in melanoma cells significantly reduced pulmonary metastasis by inhibiting the development of mesenchymal-like phenotypes. Overall, these findings support our hypothesis that TCTP is a positive regulator of EMT and suggest that modulation of TCTP expression is a potential approach to inhibit the invasiveness and migration of cancer cells and the attendant pathologic processes including metastasis.
Figures
Similar articles
-
Troglitazone ameliorates high glucose-induced EMT and dysfunction of SGLTs through PI3K/Akt, GSK-3β, Snail1, and β-catenin in renal proximal tubule cells.Am J Physiol Renal Physiol. 2010 May;298(5):F1263-75. doi: 10.1152/ajprenal.00475.2009. Epub 2009 Dec 16. Am J Physiol Renal Physiol. 2010. PMID: 20015942
-
Translationally controlled tumor protein (TCTP) is required for TGF-β1 induced epithelial to mesenchymal transition and influences cytoskeletal reorganization.Biochim Biophys Acta Mol Cell Res. 2018 Jan;1865(1):67-75. doi: 10.1016/j.bbamcr.2017.09.014. Epub 2017 Sep 25. Biochim Biophys Acta Mol Cell Res. 2018. PMID: 28958626
-
Activation of AKT signaling promotes epithelial-mesenchymal transition and tumor growth in colorectal cancer cells.Mol Carcinog. 2014 Feb;53 Suppl 1:E151-60. doi: 10.1002/mc.22076. Epub 2013 Sep 2. Mol Carcinog. 2014. PMID: 24000138
-
Translationally controlled tumor protein: the mediator promoting cancer invasion and migration and its potential clinical prospects.J Zhejiang Univ Sci B. 2022 Aug 15;23(8):642-654. doi: 10.1631/jzus.B2100910. J Zhejiang Univ Sci B. 2022. PMID: 35953758 Free PMC article. Review.
-
Some Biological Consequences of the Inhibition of Na,K-ATPase by Translationally Controlled Tumor Protein (TCTP).Int J Mol Sci. 2018 Jun 4;19(6):1657. doi: 10.3390/ijms19061657. Int J Mol Sci. 2018. PMID: 29867020 Free PMC article. Review.
Cited by
-
Extracellular translationally controlled tumor protein promotes colorectal cancer invasion and metastasis through Cdc42/JNK/ MMP9 signaling.Oncotarget. 2016 Aug 2;7(31):50057-50073. doi: 10.18632/oncotarget.10315. Oncotarget. 2016. PMID: 27367023 Free PMC article.
-
Regulation of Autophagy Is a Novel Tumorigenesis-Related Activity of Multifunctional Translationally Controlled Tumor Protein.Cells. 2020 Jan 20;9(1):257. doi: 10.3390/cells9010257. Cells. 2020. PMID: 31968668 Free PMC article. Review.
-
Overcoming the Challenges of Phytochemicals in Triple Negative Breast Cancer Therapy: The Path Forward.Plants (Basel). 2023 Jun 16;12(12):2350. doi: 10.3390/plants12122350. Plants (Basel). 2023. PMID: 37375975 Free PMC article. Review.
-
Dysregulation of TCTP in Biological Processes and Diseases.Cells. 2020 Jul 7;9(7):1632. doi: 10.3390/cells9071632. Cells. 2020. PMID: 32645936 Free PMC article. Review.
-
Dihydroartemisinin inhibits TCTP-dependent metastasis in gallbladder cancer.J Exp Clin Cancer Res. 2017 May 15;36(1):68. doi: 10.1186/s13046-017-0531-3. J Exp Clin Cancer Res. 2017. PMID: 28506239 Free PMC article.
References
-
- Gachet Y. et al. The growth-related, translationally controlled protein P23 has properties of a tubulin binding protein and associates transiently with microtubules during the cell cycle. J. Cell Sci. 112, 1257–1271 (1999). - PubMed
MeSH terms
Substances
LinkOut - more resources
Full Text Sources
Other Literature Sources
Molecular Biology Databases
Miscellaneous
