. 2015 Mar 20;290(12):7767-90.
doi: 10.1074/jbc.M114.574525. Epub 2015 Jan 26.

Role of Δ1-pyrroline-5-carboxylate dehydrogenase supports mitochondrial metabolism and host-cell invasion of Trypanosoma cruzi

Affiliations

Role of Δ1-pyrroline-5-carboxylate dehydrogenase supports mitochondrial metabolism and host-cell invasion of Trypanosoma cruzi

Brian S Mantilla et al. J Biol Chem. .

Abstract

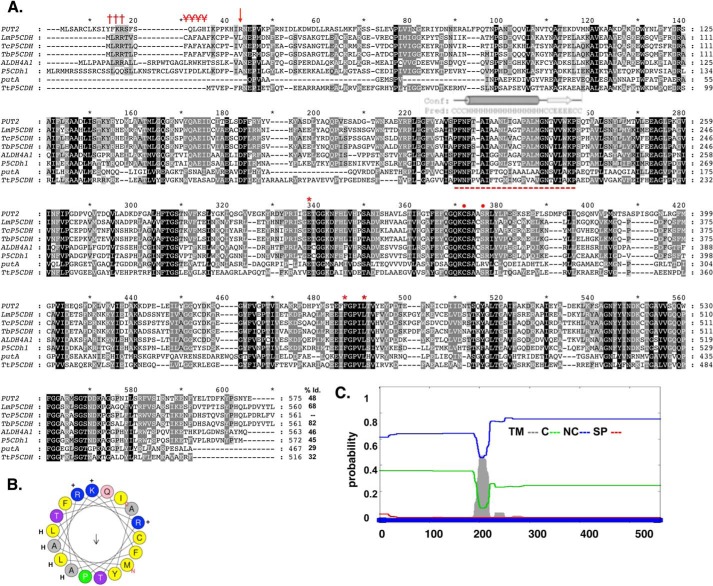
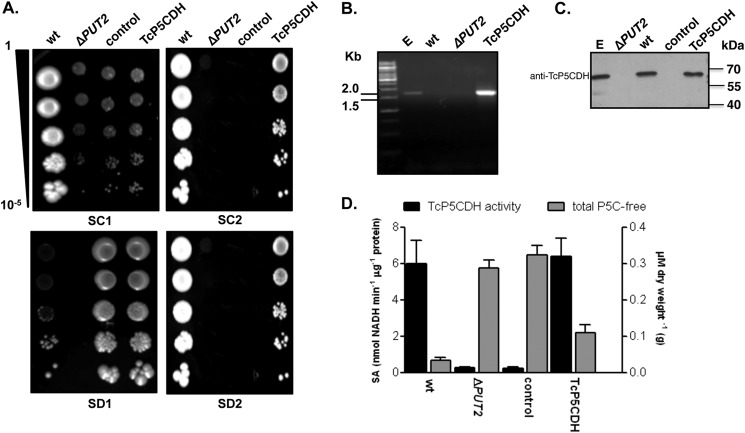
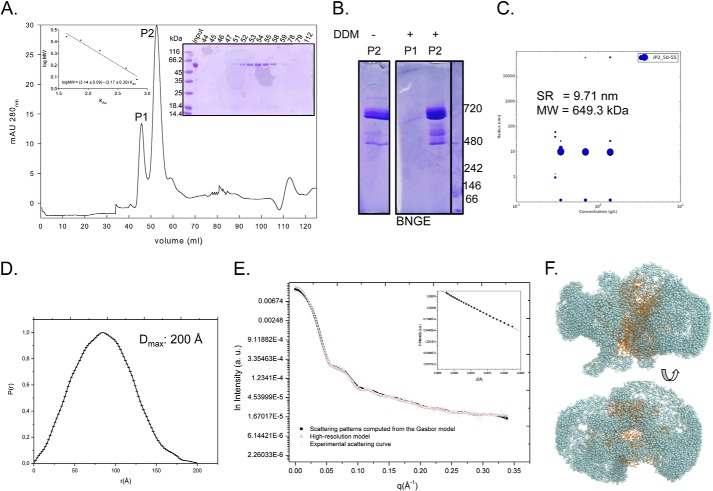
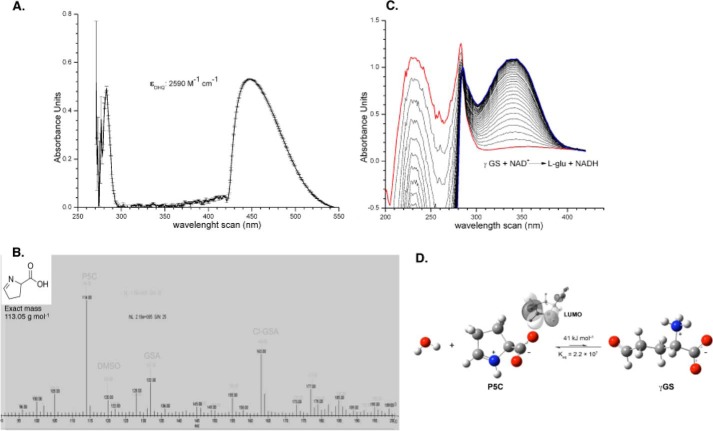
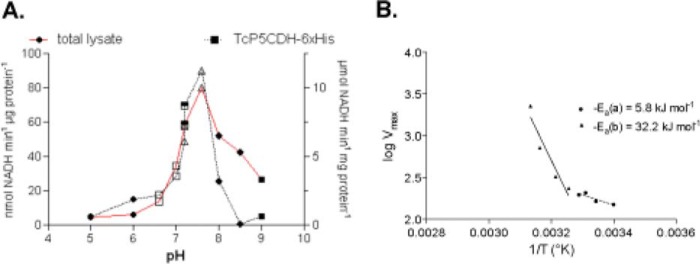
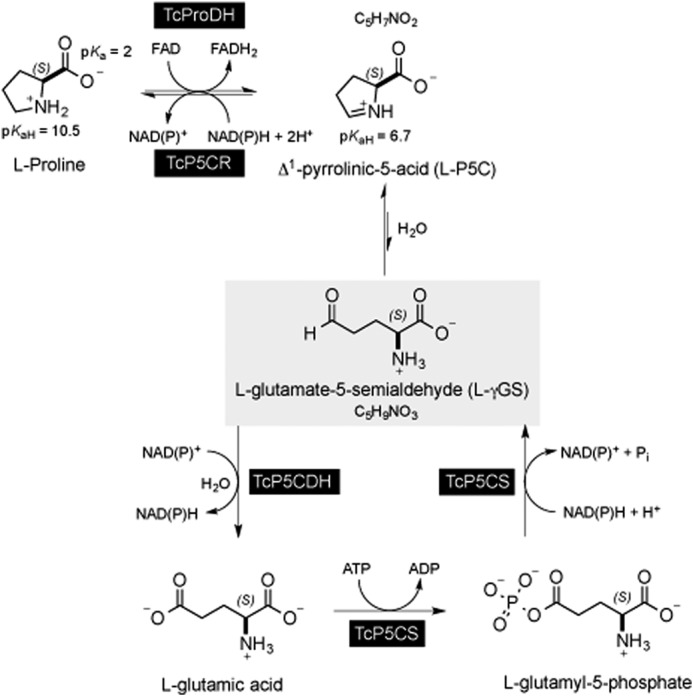
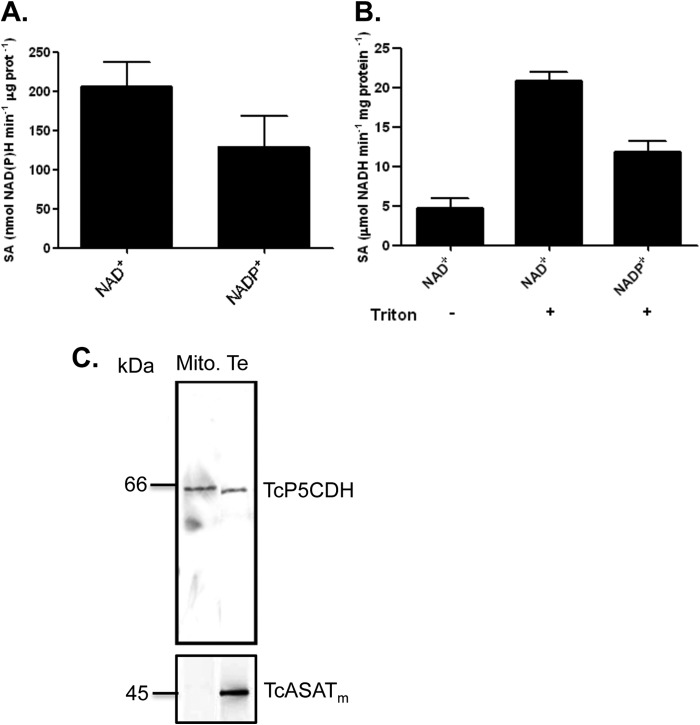
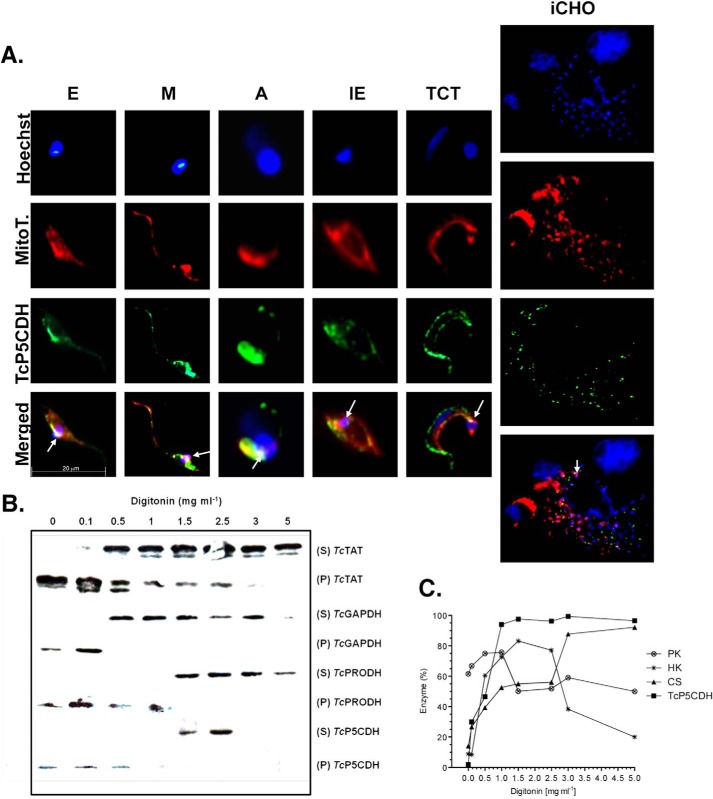
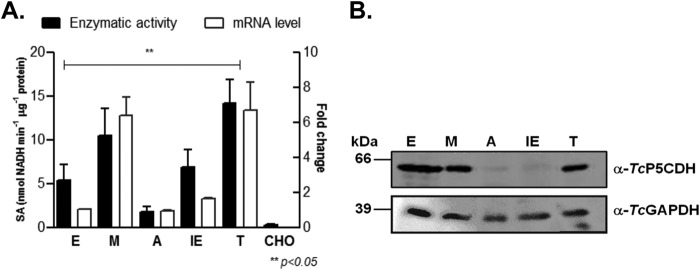
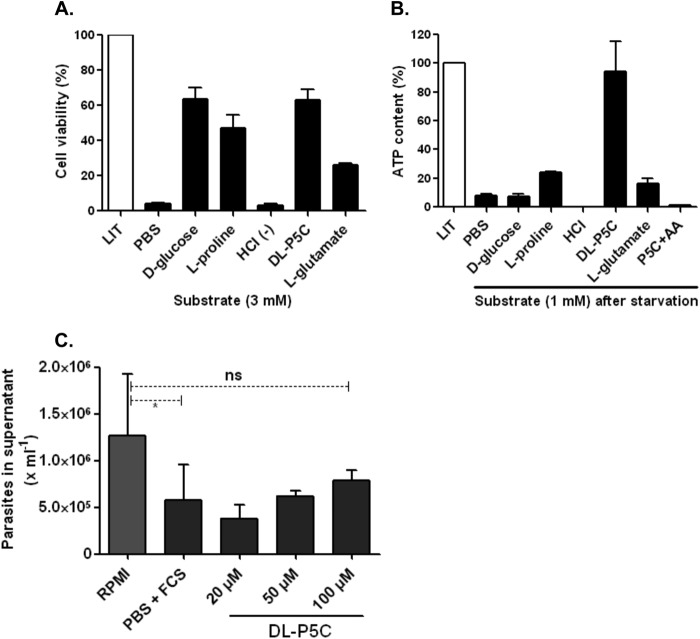
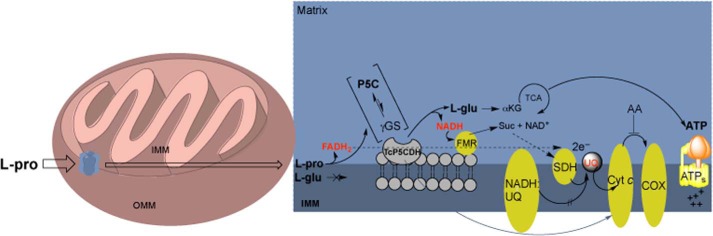
Proline is crucial for energizing critical events throughout the life cycle of Trypanosoma cruzi, the etiological agent of Chagas disease. The proline breakdown pathway consists of two oxidation steps, both of which produce reducing equivalents as follows: the conversion of proline to Δ(1)-pyrroline-5-carboxylate (P5C), and the subsequent conversion of P5C to glutamate. We have identified and characterized the Δ(1)-pyrroline-5-carboxylate dehydrogenase from T. cruzi (TcP5CDH) and report here on how this enzyme contributes to a central metabolic pathway in this parasite. Size-exclusion chromatography, two-dimensional gel electrophoresis, and small angle x-ray scattering analysis of TcP5CDH revealed an oligomeric state composed of two subunits of six protomers. TcP5CDH was found to complement a yeast strain deficient in PUT2 activity, confirming the enzyme's functional role; and the biochemical parameters (Km, kcat, and kcat/Km) of the recombinant TcP5CDH were determined, exhibiting values comparable with those from T. cruzi lysates. In addition, TcP5CDH exhibited mitochondrial staining during the main stages of the T. cruzi life cycle. mRNA and enzymatic activity levels indicated the up-regulation (6-fold change) of TcP5CDH during the infective stages of the parasite. The participation of P5C as an energy source was also demonstrated. Overall, we propose that this enzymatic step is crucial for the viability of both replicative and infective forms of T. cruzi.

Keywords: Bioenergetics; Enzyme Mechanism; Host-Pathogen Interaction; Mitochondrial Metabolism; Parasite Metabolism; Trypanosoma cruzi.


Figures

FIGURE 1.
FIGURE 1.
In silico analysis of the deduced amino acid sequence for TcP5CDH. A, alignment of primary sequences for P5CDHs from different species. The aligned sequences correspond to orthologous proteins from H. sapiens (ALDH4A1), D. melanogaster (P5CDh1), T. cruzi (TcP5CDH), T. brucei (TbP5CDH), L. major (LmP5CDH), S. cerevisiae (PUT2), E. coli (putA), and T. thermophilus (TtP5CDH). Accession code numbers are detailed under “Experimental Procedures.” The alignment was performed using the ClustalW method (default parameters) (41). Protein signatures found in the mTP (Met1–Ser18) indicating the MLRR (†††) and alanine-rich FAFAYA (¥¥¥) domains and the putative cleavable site (arrow) of TcP5CDH. The predicted trans-membrane region (Phe200–Trp221) is highly conserved among trypanosomatid sequences (- - -), as are the conserved catalytic residues Glu302, Phe387, Leu441 (stars), and Cys336, Ser340 (circles), as shown by previous structural data. B, α-helical structure presented in mTP region using the heliQuest software. The resulting model depicts the positive (+) (Arg3, Arg4, and Lys16) and hydrophobic (H) (Leu2, Leu6, Ala9, Ala11, and Ala13) residues and the putative Thr17 (arrow) cleavable site. C, bioinformatic analysis for the transmembrane region found for TcP5CDH. The complete amino acid sequence for TcP5CDH (561 residues) was used as the input sequence for the Phobius predictor tool. The graphic layout shows the probability values (0–1) for the transmembrane (TM) domains in gray, cytoplasmic (C) in green, noncytoplasmic (NC) in blue and signal peptide (SP) in red.
FIGURE 2.
FIGURE 2.
Yeast functional complementation assay. PUT2 activity-deficient mutant strain was transformed by the episomal insertion of the TcP5CDH gene. A, drop tests in selective media. For phenotypic analysis, yeast cells were grown in liquid medium (until A600 nm = 1) and then serially diluted (1–10−5) in sterile water prior to spotting. Synthetic complete plates (SC) contained a dropout mix with all amino acids, including uracil, ammonium sulfate, and galactose as nitrogen and carbon sources (SC1). SC without uracil or ammonium sulfate but with proline and G418 added are referred to as SC2. Synthetic depleted plates (SD) contained only methionine, ammonium sulfate, and galactose (SD1) or methionine, proline, and galactose (SD2). Final concentrations are described under “Experimental Procedures.” Cells were incubated at 28 °C for 2 or 4 days for the SC and SD tests, respectively. B, transcriptional levels of TcP5CDH were assayed by RT-PCR with specific primers. Amplified products were resolved in 1% agarose gel (w/v) and stained with 0.5 μg·ml−1 ethidium bromide. Gel samples were loaded as follows: 1st lane, 1-kb DNA ladder (Fermentas®); 2nd lane, products amplified using either total genomic DNA from epimastigote forms; 3rd lane, total cDNA from wild-type yeast; 4th lane, cDNA from the ΔPUT2 mutant; or 5th lane, cDNA from the TcP5CDH mutant as templates in PCR. C, Western blot analysis with protein extracts was performed as indicated. Membranes were probed against anti-TcP5CDH produced in mice (1:2000) and developed as described elsewhere. D, biochemical analysis of yeast cells. Cell-free extracts (100 μg) from 500 ml of yeast cells, grown in either SC1 or SC2 media, were used as an enzyme source in enzymatic determinations (left axis) or reacted with OAB for the quantification of free P5C levels. Intracellular P5C levels are expressed as the concentration (μm) ratio with respect to the biomass of dried yeast cells (grams) (right axis). The data are representative of three independent measurements.
FIGURE 3.
FIGURE 3.
Analysis of purified TcP5CDH-His6 in solution. A, recombinant TcP5CDH-His6 was produced in E. coli and purified by affinity chromatography and SEC. After SEC separation, two major peaks (λ280 nm) were observed (P1 and P2), and the protein sample was subjected to electrophoresis in a 10% SDS-polyacrylamide gel stained with Coomassie Blue (right inset). Size determinations were determined from calibration curve used in SEC separation (left inset). B, BNGE of the pooled fractions from SEC. Fractions 44–47 (corresponding to P1) and 51–54 (corresponding to P2) were pooled, concentrated, and resuspended at 0.5 μg/μl in P5CDH buffer in the presence or absence of 0.02% DDM. Molecular mass determinations were determined by comparing the samples migration against protein standards. C, DLS of P2 was performed at three different concentrations. Fractions 51–54 (corresponding to P2) were pooled, concentrated, and resuspended at 0.3, 0.75, and 1.5 μg/μl in P5CDH buffer in the presence of 0.02% DDM. Hydrodynamic radius (RH) and molecular mass (MW) were similar for the tested concentrations. D, distance distribution function of TcP5CDH from the experimental x-ray scattering data. The determined value of maximum distance (Dmax) is indicated. E, experimental solution scattering curves of TcP5CDH-His6 (log I versus q) and the results of the fitting procedures. Fraction P2 was resuspended in buffer containing 90 mm HEPES-NaOH, pH 7.2, and 5% glycerol (v/v) and was concentrated up to 2.5 mg ml−1. Scattering curves obtained from experimental data for TcP5CDH from the high resolution model (Protein Data Bank code 1UZB) and scattering patterns computed from the Gasbor model were plotted as indicated. The inset displays the correspondent Guinier plot (log I versus q2). F, low resolution structure of the TcP5CDH in solution as obtained by Gasbor (spheres) with superposition of the high resolution model (1UZB) (ribbons). The models were rotated 90° with respect to the y axis. a.u., absorbance units.
FIGURE 4.
FIGURE 4.
Analytical test of chemically synthesized P5C. A, wavelength scans of synthesized P5C. The DHQ yellow-colored complex absorbs light within the visible light range (λ443 nm), enabling its quantification as ϵ = 2590 m−1·cm−1. B, mass spectrum of synthetic P5C. After synthesis, the product was dissolved in two distinct solutions (pH 4.5 and 7.0) using a mixture of H3PO4/K+ phosphate buffer. Next, the sample was dissolved (1:2) in formic acid 1% (v/v) and further injected in a Finnigan Surveyor Mass Spectrometer Quadrupole Plus-MSQ (Thermo Fisher Scientific). Chromatograms from each injection were recorded and merged to analyze the differences among peaks of interest. Peaks corresponding to P5C, γGS, and Cl-γGS were detected, as indicated. A single peak with a mass-to-charge ratio of 114.15 m/z was detected for P5C. C, wavelength scans for reactants involved in the enzymatic assay for TcP5CDH. The reaction assay was prepared as described under “Experimental Procedures,” and the reaction was initiated with 200 μg of T. cruzi total lysates. Next, wavelength scans were performed (260 nm min−1), and the UV-visible light spectra were recorded over the reaction time. The graph indicates the three main peaks for P5C/γGS, NAD+, and NADH obtained at 220, 280, and 340 nm, respectively. D, structural representation of the spontaneous conversion between ring (P5C) and opened (γGS) forms in aqueous medium. Optimized structures of SMD-B3LYP/6–311++G (d,p) and values for the free-cyclization energy and the equilibrium constant (Keq) are depicted. Lowest unoccupied energy molecular orbital (LUMO) depicts the sites for potential interaction with nucleophilic species.
FIGURE 5.
FIGURE 5.
Effect of pH and temperature variations on the TcP5CDH activity. A, pH of the media in the reaction catalyzed by TcP5CDH was modified using different buffer systems. Enzymatic activity was determined in the presence of 2 mm NAD+ disodium salt, 0.3 mm γGS, and 100 mm of reaction buffer as follows: MES-NaOH (pH 5, 6) (filled circles), MOPS-NaOH (pH 6.5, 7) (open squares), HEPES-NaOH, pH 7.2, 7.6 (open triangles), potassium phosphate, pH 7.2, 7.6 (inverted triangles), Tris-HCl, pH 8, 8.5 (diamonds), and CHES (9, 9.5) (filled squares). The reaction was initiated by the addition of the enzyme, and initial velocities were calculated as linear rates at 5 or 15 min (at 30 °C with constant stirring) for the TcP5CDH-His6 or total lysates, respectively. B, effect of temperature variation in reactions catalyzed by TcP5CDH. Enzymatic activity was determined by progressively increasing the reaction temperature (from 20 to 75 °C). Arrhenius plot of the specific activity of TcP5CDH and the temperatures were assayed. y axis, log of Vmax according to temperature values used; x axis, temperature values−1 (Kelvin degrees) tested. The resulting plot was adjusted to a linear function to determine the energy of activation derived from the respective equation (slope = −Ea) (CI = 95%).
FIGURE 6.
FIGURE 6.
Biochemical steps involving P5C/γGS intermediates. The proline-glutamate interconversion pathway in T. cruzi involves two enzymatic steps in either the catabolic or biosynthetic pathway. l-Proline is oxidized to P5C by the FAD-dependent proline dehydrogenase (TcPRODH) (1.5.99.8) (UniProtKB code number F2WVH3). The reduction of P5C in proline is mediated by the enzyme P5C-reductase (TcP5CDR) (EC 1.5.1.2) (K4EAX2) and is coupled to NADPH oxidation. The reduction of glutamic acid into P5C requires two steps as follows. (i) Glutamic acid is first activated by an ATP-dependent kinase to produce glutamyl 1-phosphate, which is in turn converted to γGS by the NADPH-dependent P5C synthetase (TcP5CS) (EC 2.7.2.11) (K4E0F1). γGS is the equilibrium form of P5C in aqueous medium. (ii) carbonyl moiety of γGS is further oxidized to glutamic acid concomitantly with reduction of NAD(P)H by P5C-dehydrogenase (EC 1.5.1.1) (4) (Q4DRT8), which is the enzyme investigated in this study.
FIGURE 7.
FIGURE 7.
Cofactor dependence and membrane-bound activity of TcP5CDH. A, evaluation of cofactor specificity for TcP5CDH. Specific activity was individually determined in the presence of γGS (0.3 mm) and either NAD+ or NADP+ (2 mm). Analysis of TcP5CDH present in mitochondrial vesicles of T. cruzi. B, enzymatic activity was measured in mitochondrial preparations from replicative E forms that were solubilized (+) or not (−) with detergent (Triton X-100). The composition of the reaction mixture was detailed previously, and each reaction was initiated upon the addition of mitochondrial extract as an enzyme source. When Triton X-100 was added, the activity of TcP5CDH significantly increased. When NADP+ was used as a cofactor, a similar increase was observed. All of the measurements were conducted by monitoring the change in absorbance (λ340 nm) at a linear rate (30 °C by 15 min under constant agitation). C, Western blot analysis of TcP5CDH in mitochondrial (Mito) vesicles. Polyclonal serum (diluted 1:3000 in PBS-T plus skim milk 0.3% w/v) against the TcASATm, used as mitochondrial marker, was probed against both mitochondrial and total extracts (Te) from E forms. Similarly, anti-TcP5CDH (1:2000) was used to probe both mitochondria and total extracts. The assay detected TcP5CDH in protein extracts from both total extracts and Mc.
FIGURE 8.
FIGURE 8.
TcP5CDH native gel electrophoretic analysis. A, recombinant TcP5CDH-His6 (fraction P2, Fig. 3A) was resolved by NGE using a 4–16% acrylamide/bisacrylamide gradient gel. Lane 1, molecular mass marker for nondenaturing gels (GE Healthcare); lane 2, recombinant TcP5CDH-His6 (4 μg). The gel was run at 4 °C and further stained with Coomassie Blue R-250 solution as described under “Experimental Procedures.” Right panel, Western blot analysis from the NGE sample using purified anti-TcP5CDH (1:500). B, analysis of the TcP5CDH present in the mitochondrial fractions under native conditions. Samples were prepared from epimastigote forms, and the mitochondrial content (MitoC) was solubilized with either DIG or DDM. The mitochondrial fractions were first resolved by BNGE. Both of the samples (DIG and DDM) were electrotransferred to nitrocellulose membranes and probed with polyclonal anti-TcP5CDH; only DIG samples exhibited immunoreactivity. A single band of high molecular mass (≈450 kDa), presumably mitochondrial membrane-bound, was detected (note: the bands marked 1–5 correspond to the gel areas selected for proteomic analysis by MS/MS as summarized in Table 3). C, two-dimensional (2-D) analysis was performed under denaturing conditions (SDS-PAGE 12%). Samples from the first dimension (1D) native gel were excised (dotted region) and embedded in a gel cast for separation using conventional protein SDS-electrophoresis. After electrophoresis (two-dimensional), the proteins were electrotransferred to nitrocellulose membranes and probed with polyclonal anti-TcP5CDH. The boxes indicate proteins that were distinguished under solubilization conditions, showing two and one reactive bands for the DIG and DDM treatments, respectively. In both cases, the proteins exhibited a molecular mass compatible with that expected for TcP5CDH (∼63 kDa).
FIGURE 9.
FIGURE 9.
Subcellular localization of TcP5CDH. A, TcP5CDH immunolabeling in the predominant life stages of T. cruzi. Axenic forms from E and M forms, A, Ie, and TCT derived from infected CHO-K1 cells (iCHO) were analyzed by microscopy. The cells were preincubated with 50 nm MitoTracker-CMXROS® (MitoT) (red) and fixed on polylysine-coated coverslips for subsequent immunostaining with anti-TcP5CDH (1:100), followed by secondary staining with AlexaFluor®-488 goat anti-mouse IgG (H + L) (Invitrogen®) (1:400). The DNA was stained using Hoechst-33258 (1:5000) (blue). For the iCHO assay, CHO-K1 cells were cultured on 24-well plates containing an embedded glass coverslip, which were subsequently used for TCT infection. After the 3rd day of infection, the cells were washed twice with PBS/BSA (2% w/v) and incubated with MitoTracker, followed by immunostaining with anti-TcP5CDH and Hoechst as detailed above. The resulting images were merged using ImageJ software. The arrows indicate the co-localization of all the three probes within a region proximal to the kinetoplastid DNA. B, Western blot analysis from digitonin-titrated fractions. Epimastigotes were selectively permeabilized with increased digitonin concentrations (0–5 mg ml−1), and the resulting supernatants (S) and pellets (P) were analyzed. All of the samples (40 μg per lane) were subjected to SDS-PAGE (10%), transferred to nitrocellulose membranes, and probed with polyclonal antibodies raised against TcTAT (mass = 45 kDa, cytosolic marker), glyceraldehyde-3-phosphate dehydrogenase (TcGAPDH) (mass = 39 kDa, glycosomal marker), proline dehydrogenase (TcProDH) (mass = 65 kDa, mitochondrial marker), and TcP5CDH as indicated. C, biochemical assays for the subcellular localization of TcP5CDH. Resulting samples from digitonized epimastigotes were also used as enzymatic sources in biochemical assays. The enzymatic activities of pyruvate kinase (○) (cytosol marker), hexokinase (*) (glycosomal marker), citrate synthase (▴) (mitochondrial marker), and TcP5CDH (■) were determined for all of the resulting fractions (S and P). Values plotted on the graph correspond to the ratio between activities on S and P + S and are expressed as a percentage of the enzyme.
FIGURE 10.
FIGURE 10.
Analysis of TcP5CDH over distinct parasite life stages. A, expression levels of TcP5CDH in the predominant life stages of T. cruzi. Noninfected CHO-K1 cells served as controls. Total cell-free extracts from each parasitic stage were used as enzymatic sources in the TcP5CDH activity assay (left axis). RNA preparations from the stages noted above were used in quantitative real time PCR assays (quantitative RT-PCR). Comparisons were performed using the 2−ΔΔCt method and normalized relative to TcGAPDH expression levels. Values plotted correspond to the levels of fold change compared with the indicated epimastigote stage (right axis). The differences among the samples were calculated using one-way analysis of variance and Tukey's post test considering a p value < 0.05 as significant. B, Western blot analysis for TcP5CDH levels in the above-listed parasitic life stages. Protein sample preparations are described under “Experimental Procedures,” and equivalent amounts (40 μg) of each preparation were loaded per lane. The samples were subjected to SDS-PAGE (10%), transferred to nitrocellulose membranes, and probed with polyclonal antibodies raised against TcP5CDH (1:2000) and TcGADPH (1:2500). The latter did not react with GAPDH isoforms from the CHO-K1 cells used in our assay conditions.
FIGURE 11.
FIGURE 11.
Functional test of P5C in replicative and infective forms of T. cruzi. A, viability test in metabolically stressed cells (over 24 h) in the presence of single nutritional sources (3 mm) as indicated. After the incubation period, the cells were washed once with PBS and incubated (4 h) with MTT reagent in viability assays. Because the P5C purification method was performed in acid medium (HCl), the pH of the medium was adjusted (7.2) with KOH prior to use with the cells. An additional control of P5C-eluting agent (HCl) was also used. Absorbance ratio (590–695 nm) values were converted into percentages of cell viability using LIT as a control. B, determination of ATP levels in epimastigote forms after metabolic starvation. Intracellular ATP was depleted by incubation (30 h at 28 °C) in PBS buffer, followed by a recovery time (1 h) with 1 mm of single catabolic substrates. An additional treatment in the presence of P5C plus 0.5 μm antimycin-A (AA) (a respiratory chain complex IV inhibitor) was also performed. Next, the cells were lysed, and ATP content was determined using a luminescence-based assay following the manufacturer's protocols. The ATP content is expressed relative to cells under normal conditions (as 100%, grown in LIT medium). C, effect of P5C as a catabolic substrate was also tested for the infective TCT forms. iCHO cells were incubated (3 h) under normal (RPMI 1640 medium) and conditional media (PBS + FCS or PBS + P5C), and the number of parasites released into the supernatant (after the 6th day) was determined by hemocytometer counting. No significant (ns) differences were detected when RPMI 1640 medium was compared with PBS + 100 μm P5C, as indicated by one-way analysis of variance followed by Bonferroni's multiple comparison test (*, p < 0.05). Bars in the graph represent the results for three independent replicates (n = 3).
FIGURE 12.
FIGURE 12.
Schematic of the mitochondrial proline metabolic pathway in T. cruzi and its role in bioenergetics. Proline must be taken up from extracellular medium into mitochondria, where it is further oxidized into P5C by FAD-dependent TcProDH concomitantly with the production of FADH2. Next, the P5C is spontaneously converted into γGS, which is enzymatically converted to l-Glu. The TcP5CDH localizes within the inner mitochondrial membrane (IMM) and faces the matrix space, where the conversion of γGS into glutamate occurs at neutral pH. The glutamate produced can be deaminated into α-ketoglutarate (α-KG) and further oxidized in the tricarboxylic acid cycle (TCA), where substrate level phosphorylation can occur at a sufficient succinyl-CoA synthetase level (110). Because the function of the NADH:ubiquinone reductase complex appears limited in T. cruzi (69, 78), NADH can be reoxidized by fumarate reductase (FMR) to produce succinate. Next, e contained in FADH2 and NADH are transferred (dashed arrows) to the ubiquinone (UQ) pool to a similar degree as succinate dehydrogenase (SDH), promoting the synthesis of ATP by proton F0F1-ATP synthase via the oxidative phosphorylation process. P5C-dependent ATP production is susceptible to inhibition by antimycin-A (AA) at the level of the cytochrome c reductase complex level, thus supporting the above described assumption. However, subsequent protein associations within the mitochondria of this parasite cannot be excluded (gray arrow).

Similar articles

Cited by

References

    1. Chagas C. (1909) Nova tripanozomiaze humana. Estudos sobre a morfolojia e o ciclo evolutivo do Schizotrypanum cruzi n. gen., n. sp., ajente etiolojico de nova entidade morbida do homem. Mem. Inst. Oswaldo Cruz. 1, 159–218
    1. Brener Z. (1973) Biology of Trypanosoma cruzi. Annu. Rev. Microbiol. 27, 347–382 - PubMed
    1. World Health Organization (2012) in Epidemiology and Burden of Disease (www.who.int/iris/bitstream/10665/77472/1/WHO_TRS_975_eng.pdf)
    1. Brener Z. (1971) Life cycle of Trypanosoma cruzi. Rev. Inst. Med. Trop Sao. Paulo. 13, 171–178 - PubMed
    1. Bastos C. J., Aras R., Mota G., Reis F., Dias J. P., de Jesus R. S., Freire M. S., de Araújo E. G., Prazeres J., Grassi M. F. (2010) Clinical outcomes of thirteen patients with acute Chagas disease acquired through oral transmission from two urban outbreaks in northeastern Brazil. PLoS Negl. Trop. Dis. 4, e711. - PMC - PubMed

Publication types

Substances

Associated data

LinkOut - more resources