. 2015 Mar 13;290(11):6825-36.
doi: 10.1074/jbc.M114.617258. Epub 2015 Jan 25.

Class I histone deacetylase-mediated repression of the proximal promoter of the activity-regulated cytoskeleton-associated protein gene regulates its response to brain-derived neurotrophic factor

Affiliations

Class I histone deacetylase-mediated repression of the proximal promoter of the activity-regulated cytoskeleton-associated protein gene regulates its response to brain-derived neurotrophic factor

Mamoru Fukuchi et al. J Biol Chem. .

Abstract

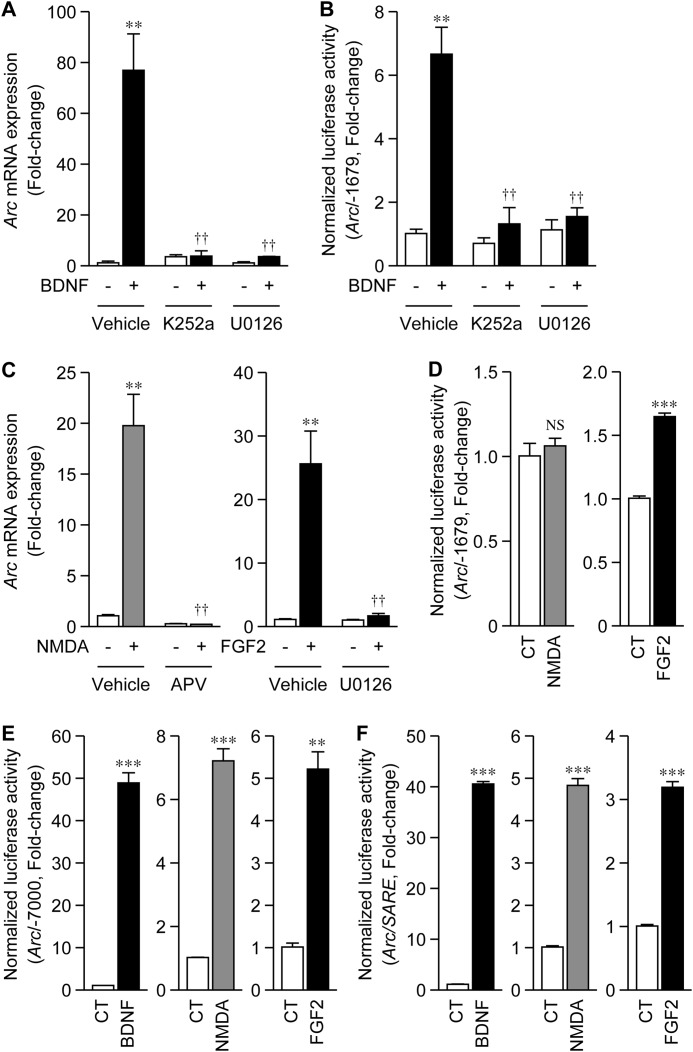
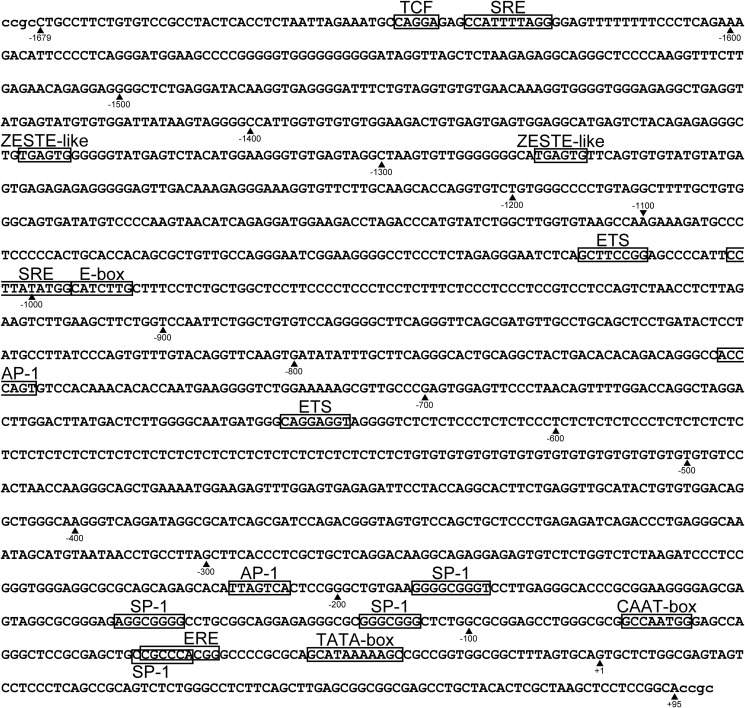
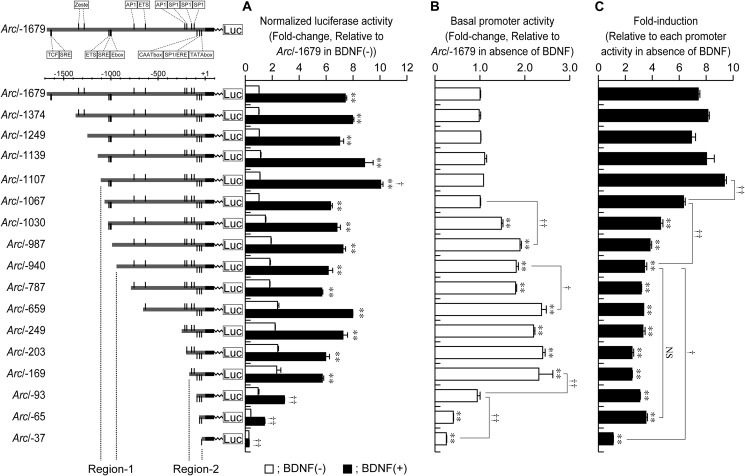
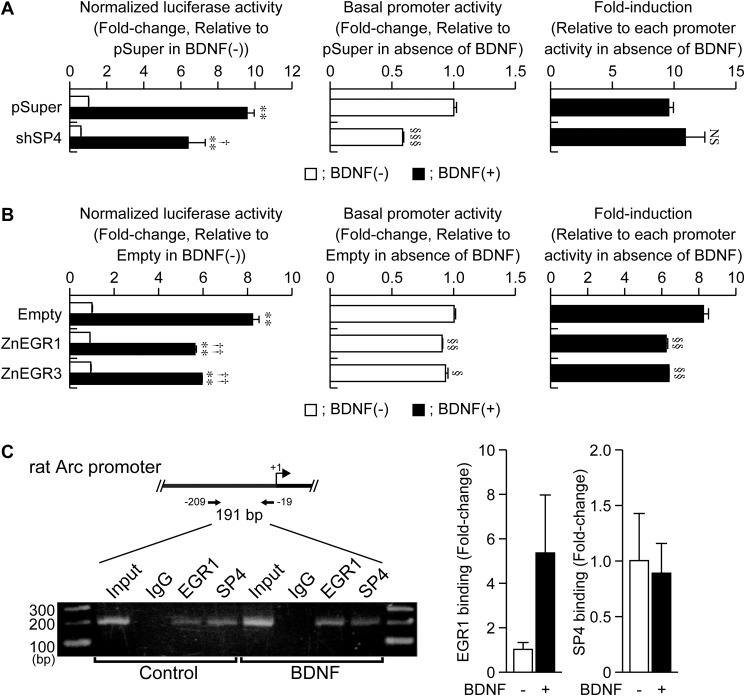
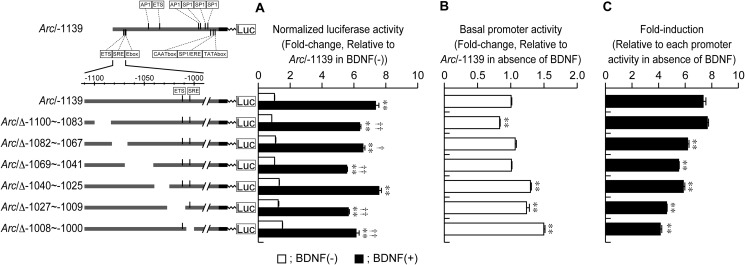
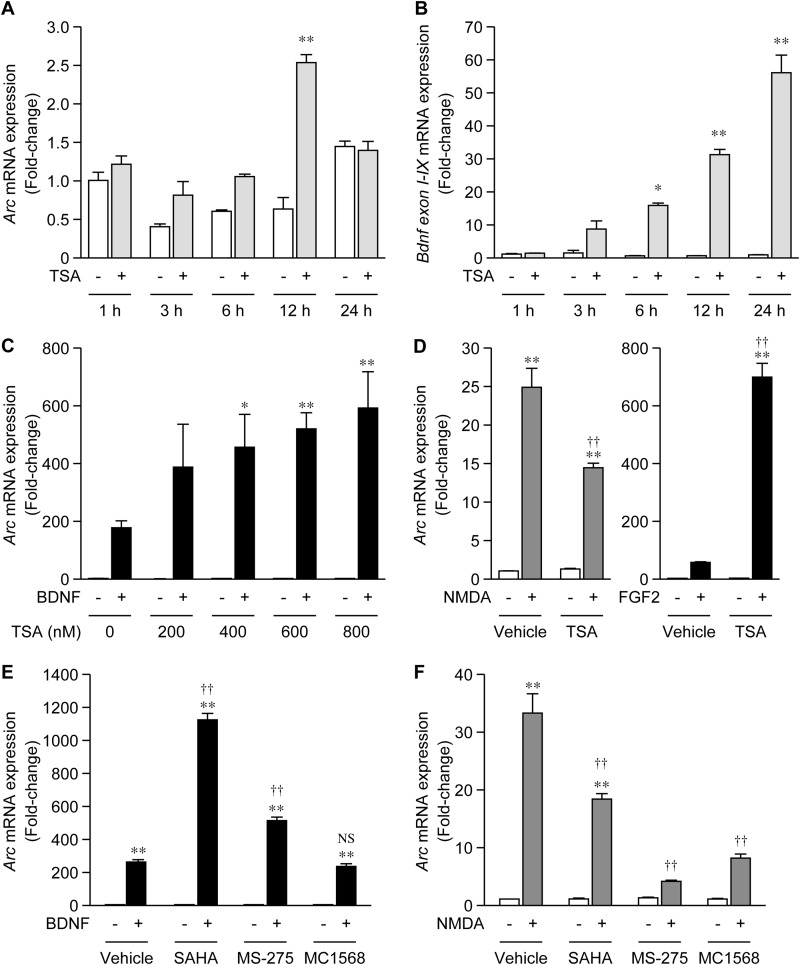
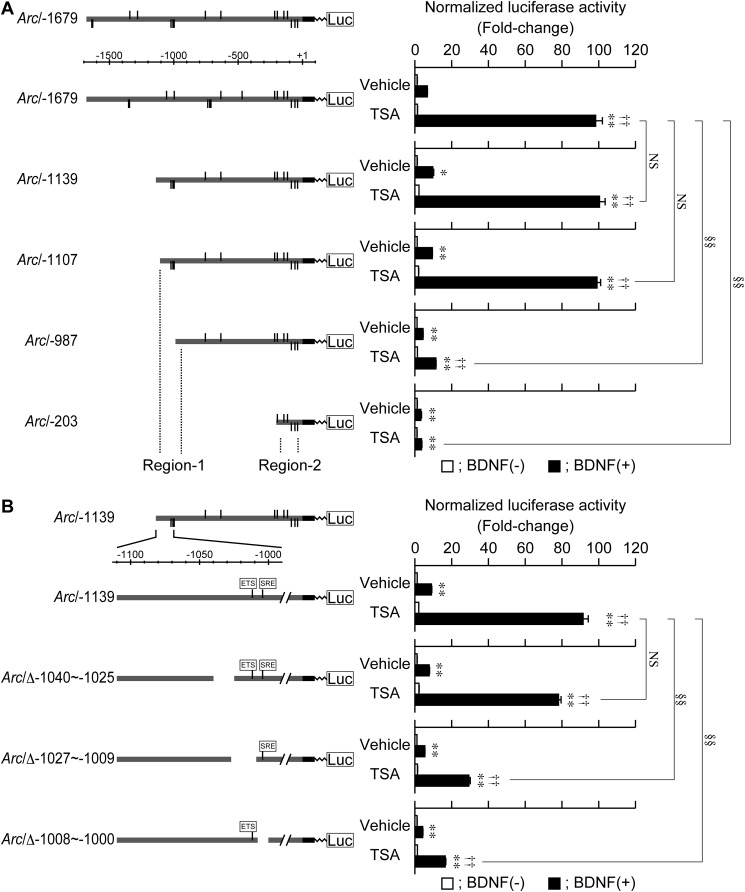
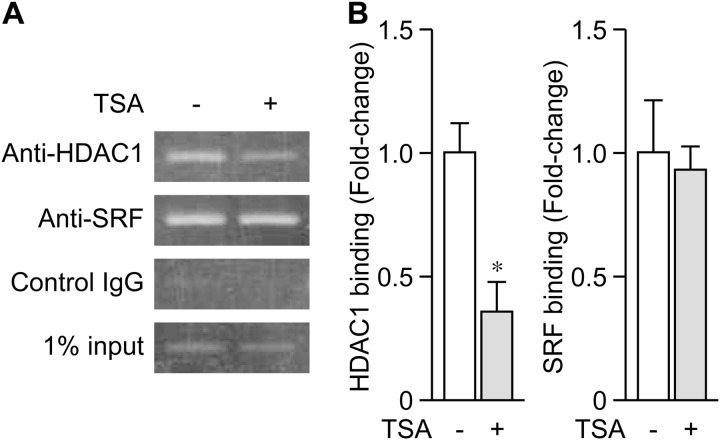
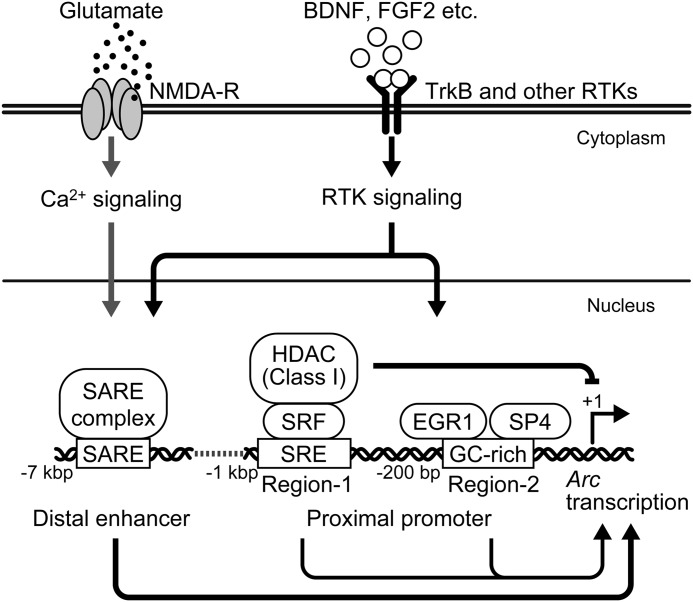
We examined the transcriptional regulation of the activity-regulated cytoskeleton-associated protein gene (Arc), focusing on BDNF-induced Arc expression in cultured rat cortical cells. Although the synaptic activity-responsive element (SARE), located -7 kbp upstream of the Arc transcription start site, responded to NMDA, BDNF, or FGF2, the proximal region of the promoter (Arc/-1679) was activated by BDNF or FGF2, but not by NMDA, suggesting the presence of at least two distinct Arc promoter regions, distal and proximal, that respond to extracellular stimuli. Specificity protein 4 (SP4) and early growth response 1 (EGR1) controlled Arc/-1679 transcriptional activity via the region encompassing -169 to -37 of the Arc promoter. We found that trichostatin A (TSA), a histone deacetylase (HDAC) inhibitor, significantly enhanced the inductive effects of BDNF or FGF2, but not those of NMDA on Arc expression. Inhibitors of class I/IIb HDACs, SAHA, and class I HDACs, MS-275, but not of class II HDACs, MC1568, enhanced BDNF-induced Arc expression. The enhancing effect of TSA was mediated by the region from -1027 to -1000 bp, to which serum response factor (SRF) and HDAC1 bound. The binding of HDAC1 to this region was reduced by TSA. Thus, Arc expression was suppressed by class I HDAC-mediated mechanisms via chromatin modification of the proximal promoter whereas the inhibition of HDAC allowed Arc expression to be markedly enhanced in response to BDNF or FGF2. These results contribute to our understanding of the physiological role of Arc expression in neuronal functions such as memory consolidation.

Keywords: activity-regulated cytoskeleton-associated protein; brain-derived neurotrophic factor (BDNF); histone deacetylase 1 (HDAC1); neuron; receptor tyrosine kinase; transcription regulation.


Figures

FIGURE 1.
FIGURE 1.
Proximal region of the Arc promoter was activated by RTK signaling. A, change in Arc mRNA levels with BDNF treatment. At 5 DIV, cortical cells were treated with 100 ng/ml BDNF, and total RNA was extracted 1 h after treatment. Ten minutes before BDNF treatment, 200 nm K252a or 20 μm U0126 was added to the cells. The change in Arc mRNA levels was investigated using quantitative RT-PCR. Values represent the mean ± S.E. (n = 3). **, p < 0.01 versus control (the sample without BDNF). ††, p < 0.01 versus vehicle (the same sample without inhibitors). B, change in Arc/−1679 activity with BDNF treatment. To measure the promoter activity of Arc/−1679, reporter plasmids were transfected into cultured cortical cells at 3 DIV. Forty hours after transfection, cells were treated with BDNF, and cell lysates were prepared 6 h after treatment. K252a or U0126 was added to cells 10 min before BDNF treatment. Values represent the mean ± S.E. (n = 5–7). **, p < 0.01 versus control. ††, p < 0.01 versus vehicle. C and D, change in Arc mRNA levels (C) and Arc/−1679 activity (D) upon the treatment of cells with 100 μm NMDA or 100 ng/ml FGF2. APV (200 μm) or U0126 was added to cells 10 min before treatment (C). Values represent the mean ± S.E. (n = 3–4). **, p < 0.01 and ***, p < 0.001 versus control. ††, p < 0.01 versus vehicle. NS: not significant. E and F, change in Arc/−7000 (E) or Arc/SARE (F) activity upon treatment of cells with BDNF, NMDA, or FGF2. Values represent the mean ± S.E. (n = 3–4). **, p < 0.01 and ***, p < 0.001 versus control.
FIGURE 2.
FIGURE 2.
Sequence of the Arc proximal promoter region. The transcription start site was designed as +1. Regulatory elements were boxed (3, 5, 6, 15).
FIGURE 3.
FIGURE 3.
Identification of BDNF-responsive regions in Arc/−1679. A, to identify regions contributing to the transcriptional activation of Arc/−1679, we constructed 5′-deletion mutants of the promoter. Values represent the mean ± S.E. (n = 3–6). **, p < 0.01 versus control (the sample without BDNF). †, p < 0.05 and ††, p < 0.01 versus Arc/−1679 activity in the presence of BDNF. B, basal activity of full length and 5′-deleted Arc promoters. Values represent the mean ± S.E. (n = 3–6). **, p < 0.01 versus Arc/-1679. †, p < 0.05, and ††, p < 0.01. C, fold-induction level of each promoter (Fold-induction) was calculated relative to the basal activity of each promoter. Values represent the mean ± S.E. (n = 3–6). **, p < 0.01 versus Arc/−1679. †, p < 0.05 and ††, p < 0.01. NS: not significant.
FIGURE 4.
FIGURE 4.
Involvement of SP4 and EGR1 in the BDNF-induced activation of Arc/−1679. A and B, effect of endogenous SP4 knockdown (A) or overexpression of dominant negative EGR (ZnEGR1 or ZnEGR3) (B) on the BDNF-induced activation of Arc/−1679. At 3 DIV, an expression vector of SP4 shRNA (shSP4), ZnEGR1, or ZnEGR3 was co-transfected with reporter plasmids into cells. Seventy-two hours (A) or 40 h (B) after the DNA transfection, cells were treated with BDNF for 6 h, and cell lysates were extracted for the dual-luciferase assay. Values represent the mean ± S.E. (n = 3). **, p < 0.01 versus control (the sample without BDNF). †, p < 0.05 and ††, p < 0.01 versus pSuper (A) or empty vector (B) in the presence of BDNF. The basal activity and fold-induction were also shown. §, p < 0.05, §§, p < 0.01, and §§§, p < 0.001 versus pSuper (A) or empty vector (B). NS: not significant. C, binding of EGR1 and SP4 to Region-2. At 5 DIV, cells were treated with BDNF for 30 min, and then cross-linked with 1% formaldehyde for ChIP assays. After immunoprecipitation, purified DNA was amplified by PCR, and the product was separated on 2% agarose gels. Purified DNA was also amplified by real-time PCR. Values represent the mean ± S.E. (n = 3–4).
FIGURE 5.
FIGURE 5.
Identification of BDNF-responsive elements in Region-1. A, to identify the BDNF-responsive regions in Region-1, we constructed a series of internal deletion mutants. Values represent the mean ± S.E. (n = 3). **, p < 0.01 versus control (the sample without BDNF). †, p < 0.05 and ††, p < 0.01 versus Arc/−1139 activity in the presence of BDNF. B, basal activity of Arc/−1139 and internally deleted Arc/−1139. Values represent the mean ± S.E. (n = 3). **, p < 0.01 versus Arc/−1139. C, fold-induction level of each promoter (Fold-induction) was calculated relative to the basal activity of each promoter. Values represent the mean ± S.E. (n = 3). **, p < 0.01 versus Arc/−1139.
FIGURE 6.
FIGURE 6.
Effects of HDAC inhibitors on Arc mRNA expression. A and B, time-course of the changes in the levels of Arc (A) and Bdnf exon I-IX (B) mRNA after TSA treatment. At 5 DIV, cultured cortical cells were treated with 800 nm TSA, and total RNA was extracted at the indicated time points. The expression level of each mRNA was measured by quantitative RT-PCR analysis. Values represent the mean ± S.E. (n = 3). *, p < 0.05 and **, p < 0.01 versus control (the sample without TSA) at the same time point. C, effects of TSA on BDNF-induced Arc mRNA levels. At 5 DIV, cells were treated with TSA for 24 h, and BDNF was then added to the TSA-treated or non-treated cells. One hour after BDNF treatment, total RNA was extracted, and the levels of Arc mRNA were measured by quantitative RT-PCR analysis. Values represent the mean ± S.E. (n = 3–4). *, p < 0.05 and **, p < 0.01 versus control (the sample without TSA/BDNF). D, twenty-four hours after the 800 nm TSA treatment, cells were further treated with NMDA or FGF2 for 1 h. Values represent the mean ± S.E. (n = 3–4). **, p < 0.01 versus control (the sample without NMDA or FGF2). ††, p < 0.01 versus vehicle (the same sample without TSA). E and F, effects of SAHA, MS-275, and MC1568 on BDNF (E) or NMDA (F)-induced Arc expression. Twenty-four hours after the HDAC inhibitor treatment, cells were further treated with BDNF or NMDA for 1 h. The concentration for each HDAC inhibitor (5 μm) was taken from a previous report (33). Values represent the mean ± S.E. (n = 3–4). **, p < 0.01 versus control (the sample without BDNF). ††, p < 0.01 versus vehicle (the same sample without HDAC inhibitors). NS: not significant.
FIGURE 7.
FIGURE 7.
TSA enhanced the BDNF-induced activation of Arc/−1679. At 3 DIV, reporter plasmids were transfected into cultured cortical cells to measure promoter activity of Arc/−1679 and a series of deletion mutants (Figs. 2 and 4). Forty hours after DNA transfection, cells were treated with 800 nm TSA for 24 h, and BDNF was then added. Cell lysates were prepared 6 h after BDNF treatment. Values represent the mean ± S.E. (n = 3–5). *, p < 0.05 and **, p < 0.01 versus control (the sample without BDNF). ††, p < 0.01 versus vehicle (the same sample without TSA). §§, p < 0.01 versus Arc/−1679 (A) and Arc/−1139 (B) in the presence of TSA/BDNF. NS: not significant.
FIGURE 8.
FIGURE 8.
Changes in the binding of HDAC1 to Region-1 upon TSA treatment. At 5 DIV, cultured cortical cells were treated with TSA for 24 h, and then cross-linked with 1% formaldehyde for ChIP assays. After immunoprecipitation with anti-HDAC1, anti-SRF, or control IgG, purified DNA was amplified by PCR, and products were separated on 2% agarose gels (A). Purified DNA was also amplified by real-time PCR (B). Values represent the mean ± S.E. (n = 3). *, p < 0.05 versus control (the sample without TSA).
FIGURE 9.
FIGURE 9.
A schematic model of Arc expression in neurons. BDNF-TrkB and other RTK signaling pathways induce the expression of Arc via either the distal SARE enhancer or the proximal region of the Arc promoter, whereas NMDAR activation-induced Arc expression is mainly mediated by the SARE. RTK signaling-induced Arc expression is repressed by HDACs (class I HDACs)-mediated mechanisms through Region-1, which contains binding sites for SRF and Elk1. The inhibition of class I HDACs allows Arc expression to be markedly induced in response to RTK signaling.

Similar articles

Cited by

References

    1. Link W., Konietzko U., Kauselmann G., Krug M., Schwanke B., Frey U., Kuhl D. (1995) Somatodendritic expression of an immediate early gene is regulated by synaptic activity. Proc. Natl. Acad. Sci. U.S.A. 92, 5734–5738 - PMC - PubMed
    1. Lyford G. L., Yamagata K., Kaufmann W. E., Barnes C. A., Sanders L. K., Copeland N. G., Gilbert D. J., Jenkins N. A., Lanahan A. A., Worley P. F. (1995) Arc, a growth factor and activity-regulated gene, encodes a novel cytoskeleton-associated protein that is enriched in neuronal dendrites. Neuron 14, 433–445 - PubMed
    1. Waltereit R., Dammermann B., Wulff P., Scafidi J., Staubli U., Kauselmann G., Bundman M., Kuhl D. (2001) Arg3.1/Arc mRNA induction by Ca2+ and cAMP requires protein kinase A and mitogen-activated protein kinase/extracellular regulated kinase activation. J. Neurosci. 21, 5484–5493 - PMC - PubMed
    1. Kawashima T., Okuno H., Nonaka M., Adachi-Morishima A., Kyo N., Okamura M., Takemoto-Kimura S., Worley P. F., Bito H. (2009) Synaptic activity-responsive element in the Arc/Arg3.1 promoter essential for synapse-to-nucleus signaling in activated neurons. Proc. Natl. Acad. Sci. U.S.A. 106, 316–321 - PMC - PubMed
    1. Pintchovski S. A., Peebles C. L., Kim H. J., Verdin E., Finkbeiner S. (2009) The serum response factor and a putative novel transcription factor regulate expression of the immediate-early gene Arc/Arg3.1 in neurons. J. Neurosci. 29, 1525–1537 - PMC - PubMed

Publication types

MeSH terms

Substances