

The evidence of glioblastoma heterogeneity
- PMID: 25623281
- PMCID: PMC4306917
- DOI: 10.1038/srep07979
The evidence of glioblastoma heterogeneity
Erratum in
-
CORRIGENDUM: The Evidence of Glioblastoma Heterogeneity.Sci Rep. 2015 May 26;5:9630. doi: 10.1038/srep09630. Sci Rep. 2015. PMID: 26010816 Free PMC article. No abstract available.
Abstract
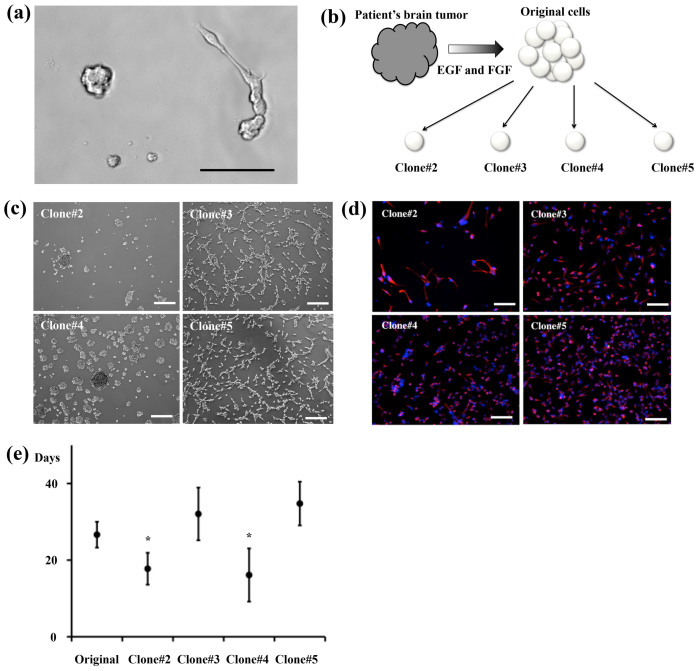
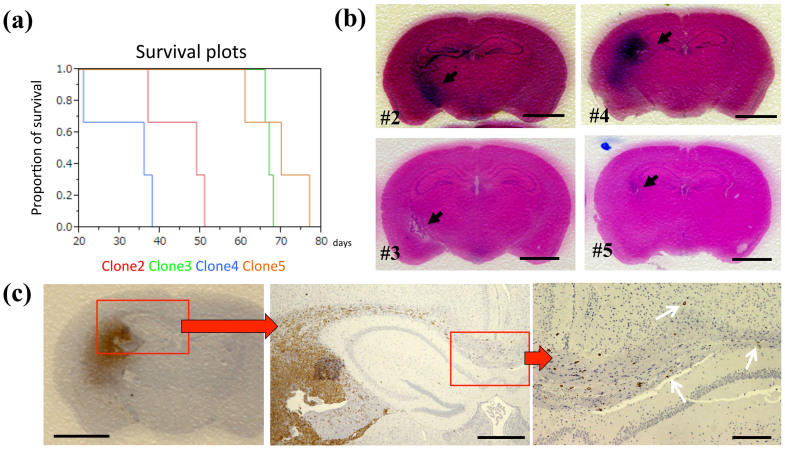
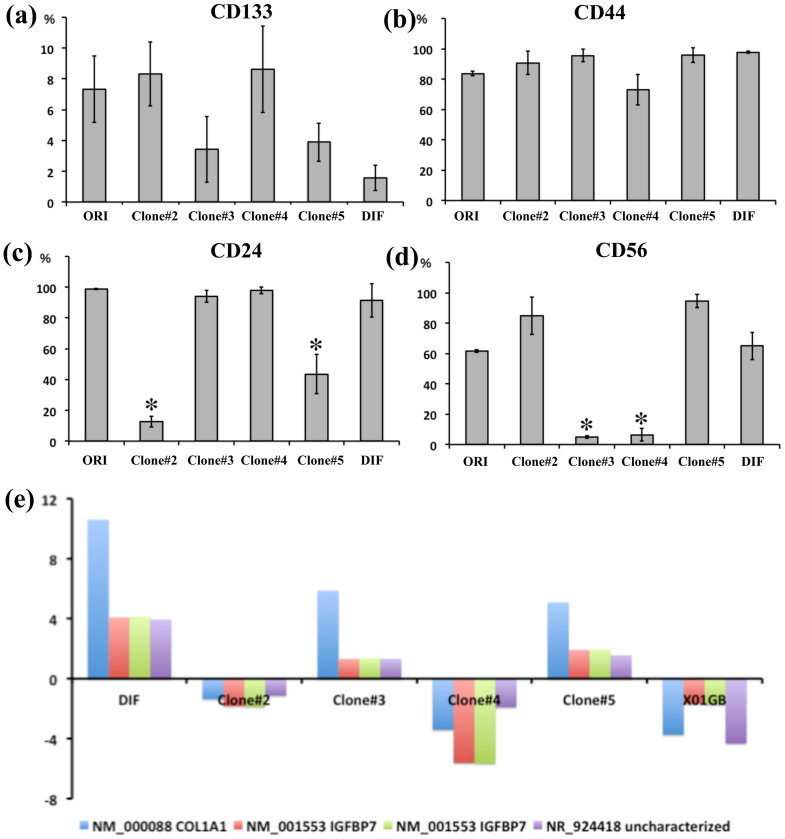
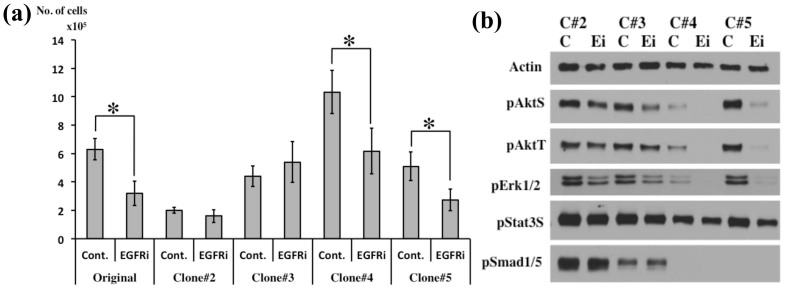
Cancers are composed of heterogeneous combinations of cells that exhibit distinct phenotypic characteristics and proliferative potentials. Because most cancers have a clonal origin, cancer stem cells (CSCs) must generate phenotypically diverse progenies including mature CSCs that can self-renew indefinitely and differentiated cancer cells that possess limited proliferative potential. However, no convincing evidence exists to suggest that only single CSCs are representative of patients' tumors. To investigate the CSCs' diversity, we established 4 subclones from a glioblastoma patient. These subclones were subsequently propagated and analyzed. The morphology, the self-renewal and proliferative capacities of the subclones differed. Fluorescence-activated cell sorting and cDNA-microarray analyses revealed that each subclone was composed of distinct populations of cells. Moreover, the sensitivities of the subclones to an inhibitor of epidermal growth factor receptor were dissimilar. In a mouse model featuring xenografts of the subclones, the progression and invasion of tumors and animal survival were also different. Here, we present clear evidence that a brain tumor contains heterogeneous subclones that exhibit dissimilar morphologies and self-renewal and proliferative capacities. Our results suggest that single cell-derived subclones from a patient can produce phenotypically heterogeneous self-renewing progenies in both in vitro and in vivo settings.
Figures
References
-
- Stupp R. et al. Radiotherapy plus concomitant and adjuvant temozolomide for glioblastoma. N Engl J Med 352, 987–996 (2005). - PubMed
-
- Kleihues P. et al. The WHO classification of tumors of the nervous system. J Neuropathol Exp Neurol 61, 215–225 (2002). - PubMed
-
- Singh S. K. et al. Identification of human brain tumour initiating cells. Nature 432, 396–401 (2004). - PubMed
-
- Park D. M. & Rich J. N. Biology of glioma cancer stem cells. Mol Cells 28, 7–12 (2009). - PubMed
Publication types
MeSH terms
Substances
LinkOut - more resources
Full Text Sources
Other Literature Sources
Medical
Research Materials
