. 2015 May;67(5):640-50.
doi: 10.1111/jphp.12362. Epub 2015 Jan 26.

The effect of injection using narrow-bore needles on mammalian cells: administration and formulation considerations for cell therapies

Affiliations

The effect of injection using narrow-bore needles on mammalian cells: administration and formulation considerations for cell therapies

Mahetab H Amer et al. J Pharm Pharmacol. 2015 May.

Abstract

Objectives: This study focuses on the effect of the injection administration process on a range of cell characteristics.

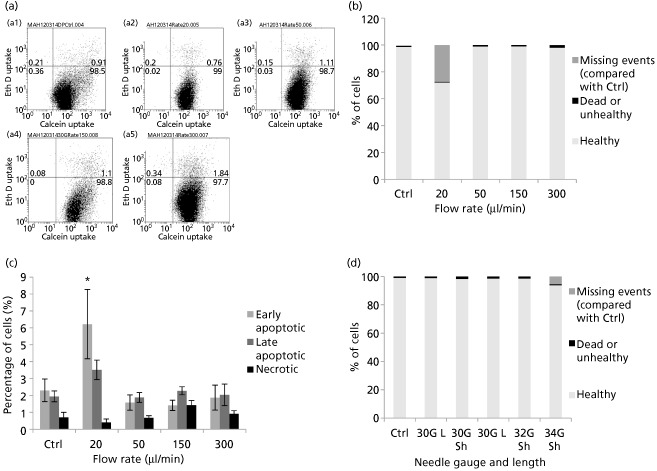
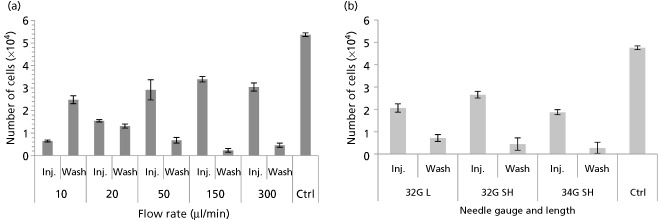
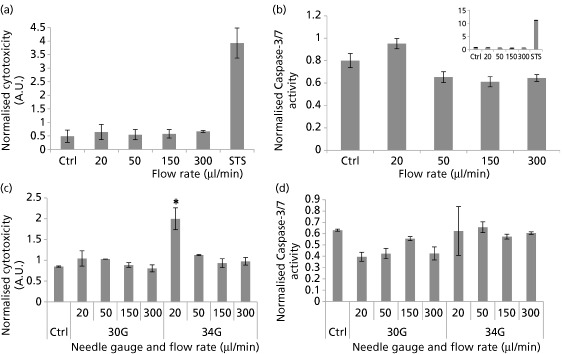
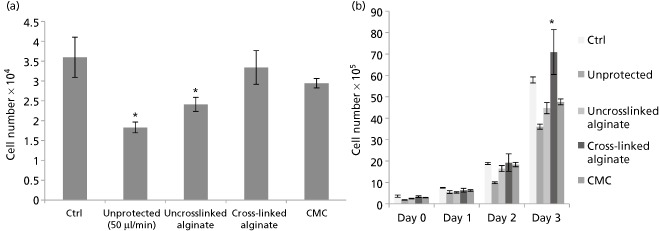
Methods: Effects of different ejection rates, needle sizes and cell suspension densities were assessed in terms of viability, membrane integrity, apoptosis and senescence of NIH 3T3 fibroblasts. For ratiometric measurements, a multiplex assay was used to verify cell viability, cytotoxicity and apoptosis independent of cell number. Co-delivery with alginate hydrogels and viscosity-modifying excipients was also assessed.

Key findings: Ejections at 150 μl/min resulted in the highest percentage of dose being delivered as viable cells among ejection rates tested. The difference in proportions of apoptotic cells became apparent 48 h after ejection, with proportions being higher in samples ejected at slower rates. Co-delivery with alginate hydrogels demonstrated a protective action on the cell payload.

Conclusions: This study demonstrates the importance of careful consideration of administration protocols required for successful delivery of cell suspensions, according to their nature and cellular responses post-ejection.

Keywords: NIH 3T3; apoptosis; cell injection; cell therapies; viability.


Figures

Figure 1
Figure 1
(a) Percentage of NIH 3T3 cells delivered as viable cells, determined using PrestoBlue, following ejection at various flow rates through a 30G needle. Results are mean values ± Standard error of mean (SEM) (n = 3). Data were normalised against control value of directly plated cells. Asterisks represent significant difference between samples (P < 0.05) and control. (b) Proliferation of NIH 3T3 cells, measured using PrestoBlue, following ejection at various flow rates through a 30G needle. Results are mean values ± SEM (n = 3). (c) Proliferation data given as the fold change in mean fluorescence intensity, measured using PrestoBlue, following ejection at various flow rates through a 30G needle from Day 0 of each sample. Results are mean values ± SEM (n = 3). (d) Quantitation of cell viability using Trypan blue following ejection of NIH 3T3 cells at various flow rates (mean ± SEM; n = 2).
Figure 2
Figure 2
NIH 3T3 cells undergoing senescence following delivery via 30G needles (n = 3). Senescence‐associated β‐galactosidase assay was performed at 5 days after injection, with 150 μM H2O2 for 2 h as positive control. Results are mean values ± SEM.
Figure 3
Figure 3
(a) Percentage of NIH 3T3 cells, delivered as viable cells, after ejection at 150 μl/min using various needle gauges and lengths. Results are mean values ± SEM% (n = 3). Asterisks represent significant difference between samples and control, and ¥ represent significant difference between needle lengths (Short (SH) = 20 mm; Long (L) = 51 mm) of the same needle gauge, using the Kruskal–Wallis test. (b) Proliferation of NIH 3T3 cells ejected at 150 μl/min using different needle gauges and lengths (mean values ± SEM). Asterisks represent significant difference between samples (P < 0.05) and control. DP, directly plated control. (c) Percentage of NIH 3T3 cells, delivered as viable cells, 6 h following ejection at various flow rates using 30G and 34G 20‐mm needles. Results are normalised mean values to control ± SEM (n = 3). Asterisks indicate statistically significant differences between control and ejected samples using the Kruskal–Wallis test (P < 0.05).
Figure 4
Figure 4
(a) Flow cytometric dot plot quadrant analysis of NIH 3T3 cells, using Live/Dead stain, (a1) directly plated or ejected at (a2) 20, (a3) 50, (a4) 150 or (a5) 300 μl/min. (b) Graph showing results of flow cytometric analysis of NIH 3T3 cells ejected at various flow rates, classified as healthy, dead/unhealthy or missing events (compared with control). (c) Percentages of apoptotic and necrotic cells were analysed by flow cytometric analysis of NIH 3T3 cells 48‐h post‐injection, by double labelling with Alexa Fluor 488 Annexin V and propidium iodide (PI). Mean values of five independent experiments are shown ± SEM. Asterisk represents significant difference between samples and control using two‐way ANOVA followed by Tukey's post‐hoc test. (d) Graph showing results of flow cytometric analysis of NIH 3T3 cells ejected using various needle gauges and lengths, classified as healthy, dead/unhealthy or missing events (compared with control).
Figure 5
Figure 5
(a) To investigate cell fate at low flow rates, each cell ejection was followed by needle washes (3 × 100 μl of phosphate buffered saline (PBS) ejected at 300 μl/min each), and the number of cells recovered was measured using PrestoBlue (mean ± SEM, n = 3). (b) Ejections through needles of various gauges and lengths were followed by washes using 3 × 100 μl of PBS ejected at 300 μl/min each, and the number of cells recovered was measured using PrestoBlue (mean ± SEM).
Figure 6
Figure 6
(a) Cytotoxicity in NIH 3T3 cells 4‐h post‐injection (analysed by ApoTox‐Glo Triplex Assay). Cytotoxicity fluorescence at wavelengths 485EXT and 520EM were normalised to viability within the same well. (b) Caspase‐3/7 activity luminescence was represented as normalised to viability in well‐to‐well normalisation. Staurosporine treatment (1 μM) was used as a positive control, and the graph showing its effect is superimposed for clarity (n = 3; mean ± SEM). (c) Cytotoxicity in NIH 3T3 cells 4‐h post‐injection (analysed by ApoTox‐Glo Triplex Assay). Cytotoxicity readings were normalised to viability within the same well. (d) Caspase‐3/7 activity luminescence was represented as normalised to viability measurements. Asterisks represent significant difference between sample and control (P < 0.05). (n = 2; mean ± SEM).
Figure 7
Figure 7
(a) To investigate the proportion of NIH 3T3 cells delivered within phosphate buffered saline (PBS), uncross‐linked 1% alginate solution, 1:4 cross‐linked alginate gels and high viscosity CMC after ejection through a 30G syringe needle at 50 μl/min, normalised to directly plated control (mean ± SEM%, n = 3). (b) Cell proliferation of NIH 3T3 cells when injected unprotected in PBS and in several carriers (n = 3, mean ± SEM). Asterisks indicate statistically significant improvement in proliferation of ejected cells compared with the directly plated control cells at 72 h (P < 0.05); CMC, carboxymethylcellulose.

References

    1. Freed CR et al Transplantation of embryonic dopamine neurons for severe Parkinson's disease. N Engl J Med 2001; 10: 710–719. - PubMed
    1. Olanow CW et al A double‐blind controlled trial of bilateral fetal nigral transplantation in Parkinson's disease. Ann Neurol 2003; 3: 403–414. - PubMed
    1. Bang OY et al Autologous mesenchymal stem cell transplantation in stroke patients. Ann Neurol 2005; 6: 874–882. - PubMed
    1. Kondziolka D et al Neurotransplantation for patients with subcortical motor stroke: a phase 2 randomized trial. J Neurosurgery 2005; 1: 38–45. - PubMed
    1. Bliss TM et al Optimizing the success of cell transplantation therapy for stroke. Neurobiol Dis 2010; 2: 275–283. - PMC - PubMed

Publication types