. 2015 May;20(5):573-84.
doi: 10.1038/mp.2014.176. Epub 2015 Jan 27.

Dysregulation of miR-34a links neuronal development to genetic risk factors for bipolar disorder

Affiliations

Dysregulation of miR-34a links neuronal development to genetic risk factors for bipolar disorder

S Bavamian et al. Mol Psychiatry. 2015 May.

Abstract

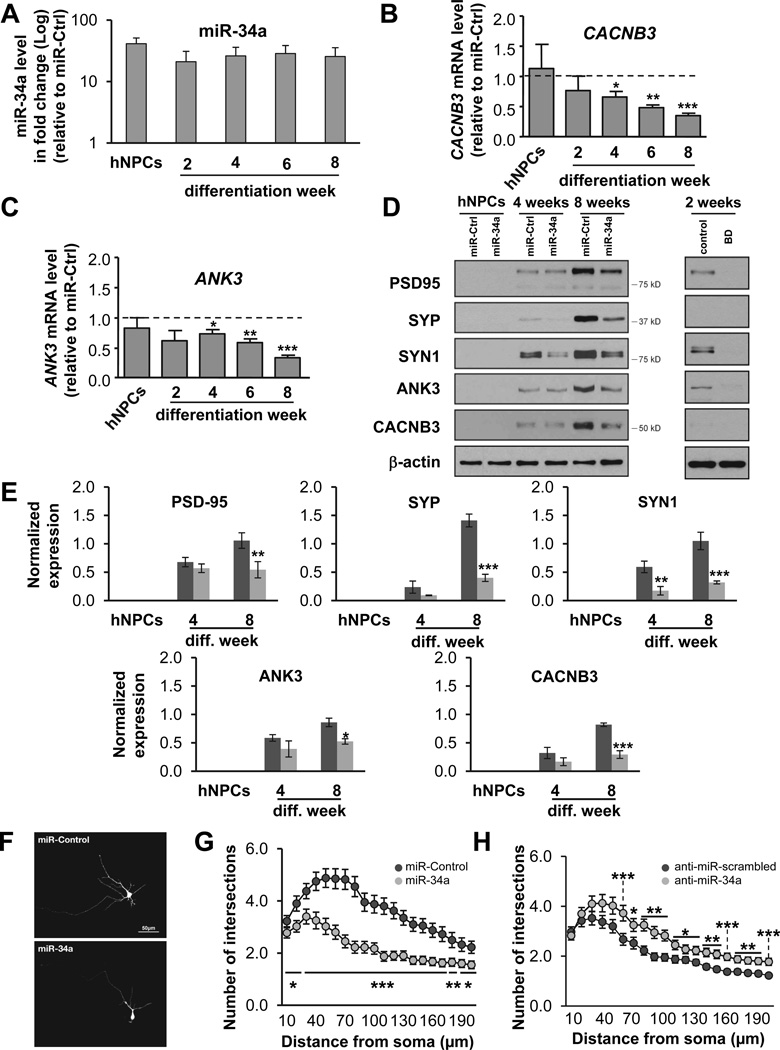
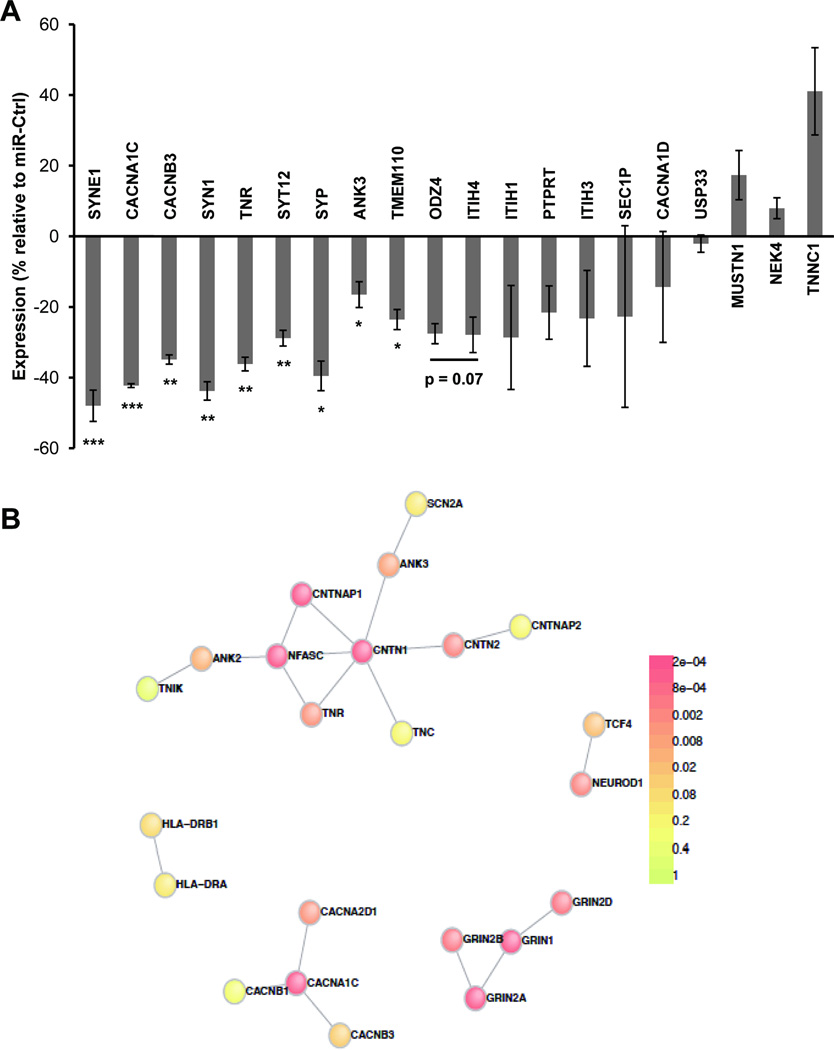
Bipolar disorder (BD) is a heritable neuropsychiatric disorder with largely unknown pathogenesis. Given their prominent role in brain function and disease, we hypothesized that microRNAs (miRNAs) might be of importance for BD. Here we show that levels of miR-34a, which is predicted to target multiple genes implicated as genetic risk factors for BD, are increased in postmortem cerebellar tissue from BD patients, as well as in BD patient-derived neuronal cultures generated by reprogramming of human fibroblasts into induced neurons or into induced pluripotent stem cells (iPSCs) subsequently differentiated into neurons. Of the predicted miR-34a targets, we validated the BD risk genes ankyrin-3 (ANK3) and voltage-dependent L-type calcium channel subunit beta-3 (CACNB3) as direct miR-34a targets. Using human iPSC-derived neuronal progenitor cells, we further show that enhancement of miR-34a expression impairs neuronal differentiation, expression of synaptic proteins and neuronal morphology, whereas reducing endogenous miR-34a expression enhances dendritic elaboration. Taken together, we propose that miR-34a serves as a critical link between multiple etiological factors for BD and its pathogenesis through the regulation of a molecular network essential for neuronal development and synaptogenesis.


Figures

Figure 1
Figure 1. miR-34a expression is increased in the cerebellum of BD patients and in patient-derived cellular models of BD
A) Mean ± SEM miR-34a levels depicted as fold change relative to controls. N = 34 control and 29 BD cerebellar samples. **p<0.01 compared to control conditions, based on a two-tailed, one-sample t-test. B) Mean ± SEM miR-34a levels in cerebellum of controls (N = 34) and BD patients segregated into medicated (N = 19) and non-medicated (N = 10). **p<0.01 based on ANOVA with Tukey's Multiple Comparison Test. C) Schematic of the neuronal differentiation process from iPSCs to eight weeks differentiated neurons. D) Immunostaining of Nestin in hNPCs and MAP2 in eight weeks differentiated neurons, scale bar = 50 µm. E) Graphs showing relative miR-34a expression in hNPCs and differentiated neurons of a healthy control individual (light grey circles) and a BD patient (dark grey circles). Data are shown as fold change relative to miR-34a level at hNPC stage. Stars over data depict statistical significance based on a two-tailed t-test (*p<0.05, **p<0.01, *p<0.001). F) Schematic of induced neurons (iNs) generation. G) miR-34a expression in iNs from three control and five BD subjects. The graph shows mean ± SEM miR-34a expression relative to control iNs. miR-34a expression was normalized to U6 and RNU44 expression, which control for the total amount of RNA present in each sample. *p<0.05 compared to control conditions, based on a two-tailed, one-sample t-test.
Figure 2
Figure 2. Bipolar disorder-related genes differentially expressed during differentiation of human iPSC-derived neuronal progenitors are targets of miR-34a
A) Upper: Schematic of luciferase assay. The interaction of a putative target with miR-34a is shown. Lower: Results from luciferase reporter gene assays in HEK293T transfected with either a non-targeting control having no sequence homology to the human (miR-Neg - light grey bars) or miR-34a mimics (dark grey bars). Data are shown as fold change relative to miR-Neg treatment. **p<0.01, ***p<0.001 compared to miR-Neg treatment, based on a two-tailed, one-sample t-test. B-E) Expression (B-C) and correlation (D-E) data relative to miR-34a expression of the two validated miR-34a targets ANK3 (B, D) and CACNB3 (C, E) in control (light grey bars) and BD (dark grey bars) iPSC-derived NPCs/neurons. Data are shown as fold change relative to miR-34a level at hNPC stage. Stars over data depict statistical significance based on a two-tailed t-test (*p<0.05, **p<0.01, ***p<0.001). Spearman correlation coefficients (r) and p values (two-tailed) are shown. F) Control (light grey bars) and BD patient (dark grey bars) iPSC-derived NPCs were transfected with either an anti-miR-scrambled or anti-miR-34a construct designed to trap endogenous miR-34a and differentiated for two weeks. Data show expression of the two validated miR-34a targets ANK3 and CACNB3 expressed as the ratio of anti-miR34a to anti-miR-scrambled. Stars over data depict statistical significance based on a two-tailed t-test (**p<0.01, ***p<0.001). G-J) Expression (G-I) and correlation (H-J) data relative to miR-34a expression of ANK3 (G, H) and CACNB3 (I, J) in the cerebellum of controls (light grey bar, N = 32) and BD patients (dark grey bar, N = 28). Star and p-value depicted in (G) and (I) are based on two-tailed, Mann-Whitney test (*p<0.05). Pearson correlation coefficients (r) and p values (two-tailed) are shown.
Figure 3
Figure 3. Ectopic expression of miR-34a decreases CACNB3 and ANK3 expression and affects neuronal differentiation and morphology of human iPSC-derived neurons
A) hNPCs were transduced with either miR-Ctrl or miR-34a lentiviral constructs and differentiated for eight weeks. Data show expression of miR-34a shown as fold change relative to the transcript level at the initial hNPC stage. B-C) Follow-up of the two validated miR-34a targets ANK3 and CACNB3 at transcriptional level in miR-Ctrl and miR-34a overexpressing hNPCs and differentiated neurons. Data are shown as fold change relative to the transcript of interest at hNPC stage and normalized to the transcript level in miR-Ctrl conditions. Data are mean ± SEM from three independent experiments. *p <0.05, **p<0.01, ***p<0.001 compared to miR-Ctrl treatment, based on a two-tailed, one-sample t-test. D) PSD95, Synaptophysin (SYP), Synapsin-1 (SYN1), ANK3 and CACNB3 Western blot results on hNPCs, four and eight weeks differentiated neurons overexpressing either miR-Ctrl or miR-34a (left panel) or two weeks differentiated control and BD neurons (right panel). β-actin was used as internal standard. E) Quantification of Western blot data in (D) by densitometric analysis. The bars show the mean ± SEM ratio of the protein of interest and β-actin signals, as evaluated by densitometric analysis of three independent biological replicates. *p <0.05, **p<0.01, ***p<0.001 compared to miR-Ctrl treatment, based on a two-way ANOVA using the Bonferroni correction as post hoc comparisons between two means. F) Image-based analysis of the effect of miR-34a overexpression on the morphology of hNPCs after three weeks of differentiation with sparse transfection with membrane-targeted GFP for two days, scale bar = 50 µm. G-H) Graph showing the number of branches in function of the soma distance in (G), three weeks differentiated neurons overexpressing miR-Ctrl (dark grey circles) and miR-34a (light grey circles) or in (H), two weeks differentiated neurons expressing anti-miR-scrambled control (dark grey circles) and anti-miR-34a (light grey circles). 12 days differentiated cells were transfected with anti-miR constructs for 2 days. Since both constructs co-expressed mCherry as a reporter gene, cells expressing the anti-miR constructs were immunostained for mCherry. For each condition, a total of 40 neurons were imaged and quantified using classical Sholl analysis. *p <0.05, **p<0.01, ***p<0.001 compared to miR-Ctrl treatment (G) or anti-miR-scrambled (H), based on a two-tailed t-test.
Figure 4
Figure 4. miR-34a overexpression affects BD-risk genes that are highly connected through a protein interaction network
A) Data show expression of 18 BD-risk genes (SYNE1, CACNA1C, CACNB3, TNR, SYT12, ANK3, TMEM110, ODZ4, ITIH4, ITIH1, PTPRT, ITIH3, SEC1P, CACNA1D, USP33, MUSTN1, NEK4 and TNCC1) and two validated miR-34a targets (SYN1 and SYT) measured in six week differentiated neurons overexpressing either miR-Ctrl or miR-34a. Data are expressed in percentage relative to miR-Ctrl overexpressing neurons with n=3 replicates. *p<0.05, **p<0.01, ***p<0.001 compared to miR-Ctrl treatment based on a two-tailed, one-sample t-test. B) Direct protein-protein interactions amongst genes differentially affected by miR-34a overexpression over a neurodevelopmental time course (t=0, 2, 4, 8 weeks in duplicate; t=6 weeks in triplicate) in human iPSC-derived NPCs visualized using DAPPLE v2.0. Color coding corresponds to p-value from 5,000 within-degree, node-label permutations. See Supplemental Text for additional details.

References

    1. Ketter TA. Diagnostic features, prevalence, and impact of bipolar disorder. The Journal of clinical psychiatry. 2010;71(6):e14. - PubMed
    1. Craddock N, Sklar P. Genetics of bipolar disorder. Lancet. 2013;381(9878):1654–1662. - PubMed
    1. Bartel DP. MicroRNAs: target recognition and regulatory functions. Cell. 2009;136(2):215–233. - PMC - PubMed
    1. Krichevsky AM, King KS, Donahue CP, Khrapko K, Kosik KS. A microRNA array reveals extensive regulation of microRNAs during brain development. RNA. 2003;9(10):1274–1281. - PMC - PubMed
    1. Krol J, Loedige I, Filipowicz W. The widespread regulation of microRNA biogenesis, function and decay. Nature reviews Genetics. 2010;11(9):597–610. - PubMed

Publication types

MeSH terms