. 2015 May;36(5):1847-65.
doi: 10.1002/hbm.22741. Epub 2015 Jan 27.

View-centralized multi-atlas classification for Alzheimer's disease diagnosis

Affiliations

View-centralized multi-atlas classification for Alzheimer's disease diagnosis

Mingxia Liu et al. Hum Brain Mapp. 2015 May.

Abstract

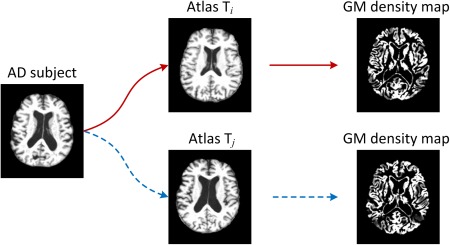
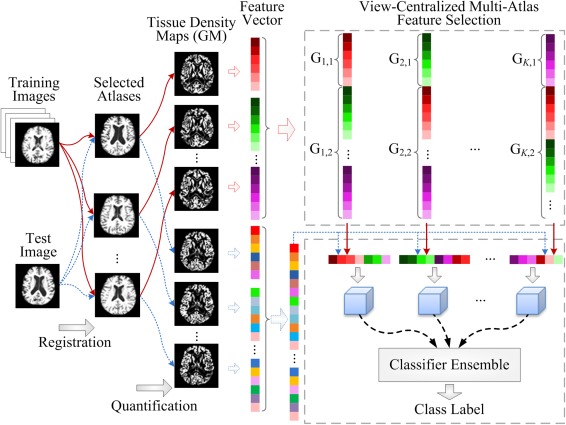
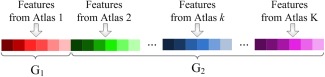
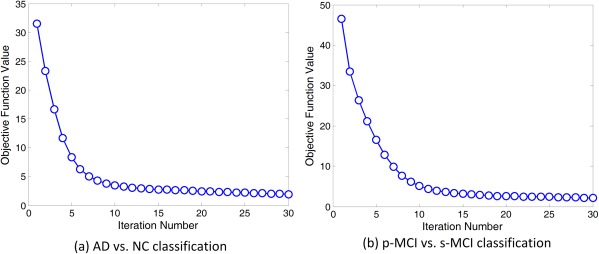
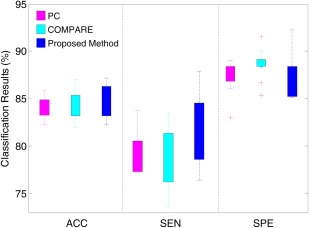
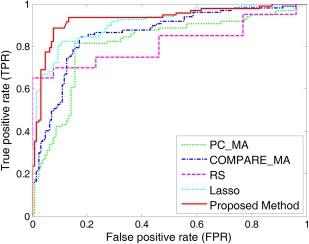
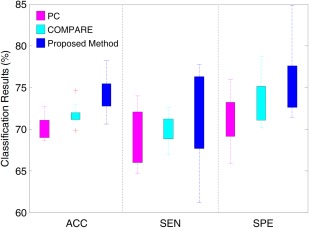
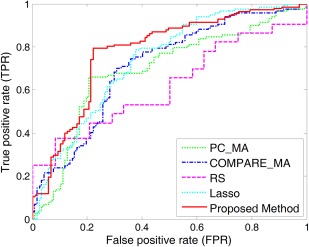
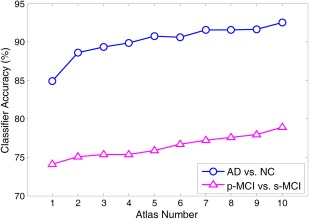
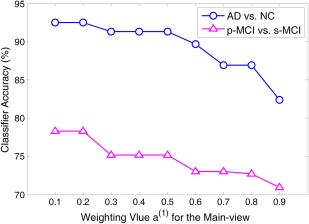
Multi-atlas based methods have been recently used for classification of Alzheimer's disease (AD) and its prodromal stage, that is, mild cognitive impairment (MCI). Compared with traditional single-atlas based methods, multiatlas based methods adopt multiple predefined atlases and thus are less biased by a certain atlas. However, most existing multiatlas based methods simply average or concatenate the features from multiple atlases, which may ignore the potentially important diagnosis information related to the anatomical differences among different atlases. In this paper, we propose a novel view (i.e., atlas) centralized multi-atlas classification method, which can better exploit useful information in multiple feature representations from different atlases. Specifically, all brain images are registered onto multiple atlases individually, to extract feature representations in each atlas space. Then, the proposed view-centralized multi-atlas feature selection method is used to select the most discriminative features from each atlas with extra guidance from other atlases. Next, we design a support vector machine (SVM) classifier using the selected features in each atlas space. Finally, we combine multiple SVM classifiers for multiple atlases through a classifier ensemble strategy for making a final decision. We have evaluated our method on 459 subjects [including 97 AD, 117 progressive MCI (p-MCI), 117 stable MCI (s-MCI), and 128 normal controls (NC)] from the Alzheimer's Disease Neuroimaging Initiative database, and achieved an accuracy of 92.51% for AD versus NC classification and an accuracy of 78.88% for p-MCI versus s-MCI classification. These results demonstrate that the proposed method can significantly outperform the previous multi-atlas based classification methods.

Keywords: Alzheimer's disease; ensemble learning; feature selection; multiatlas classification; multiview learning.


Figures

Figure 1
Figure 1
Illustration of different morphometric patterns generated from different atlases. Here, an AD subject image is registered to two different atlases (i.e., Ti and Tj), through which two different representations (i.e., density maps for GM) are generated as features for the AD subject. [Color figure can be viewed in the online issue, which is available at http://wileyonlinelibrary.com.]
Figure 2
Figure 2
The framework of our proposed view‐centralized multi‐atlas classification method, which includes four main steps: (1) preprocessing and atlas selection, (2) feature extraction, (3) feature selection, and (4) ensemble classification. [Color figure can be viewed in the online issue, which is available at http://wileyonlinelibrary.com.]
Figure 3
Figure 3
Illustration of group information for feature representations generated from multiple atlases. The first group G1 (i.e., the main‐view group) consists of features from a certain atlas, while the second group G2 (i.e., the side‐view group) contains features from all other (supplementary) atlases. [Color figure can be viewed in the online issue, which is available at http://wileyonlinelibrary.com.]
Figure 4
Figure 4
Objective function values versus optimization iteration number in (a) AD versus NC classification and (b) p‐MCI versus s‐MCI classification. [Color figure can be viewed in the online issue, which is available at http://wileyonlinelibrary.com.]
Figure 5
Figure 5
Distribution of accuracy (ACC), sensitivity (SEN) and specificity (SPE) achieved by different singleatlas based methods in AD versus NC classification. [Color figure can be viewed in the online issue, which is available at http://wileyonlinelibrary.com.]
Figure 6
Figure 6
ROC curves for the classification between AD and NC achieved by different methods. [Color figure can be viewed in the online issue, which is available at http://wileyonlinelibrary.com.]
Figure 7
Figure 7
Distributions of accuracy (ACC), sensitivity (SEN) and specificity (SPE) achieved by different singleatlas based methods in p‐MCI versus s‐MCI classification. [Color figure can be viewed in the online issue, which is available at http://wileyonlinelibrary.com.]
Figure 8
Figure 8
ROC curves for the classification between p‐MCI and s‐MCI achieved by different methods. [Color figure can be viewed in the online issue, which is available at http://wileyonlinelibrary.com.]
Figure 9
Figure 9
Results of our proposed method by adding the atlas number from 1 to 10 in both the AD versus NC classification (a line with circle markers) and the p‐MCI versus s‐MCI classification (a line with triangle markers). [Color figure can be viewed in the online issue, which is available at http://wileyonlinelibrary.com.]
Figure 10
Figure 10
Correlation coefficients among ten atlases computed according to Eq. (7). Here, red and yellow indicate high correlation coefficients, while blue and green denote low coefficients. [Color figure can be viewed in the online issue, which is available at http://wileyonlinelibrary.com.]
Figure 11
Figure 11
The diversity‐error diagrams of classifiers in (a) AD versus NC classification and (b) p‐MCI versus s‐MCI classification using RS, Lasso and our proposed method. The final ensemble is composed of ten classifiers. The x‐axis represents the diversity of a pair of classifiers evaluated by the kappa measure, and y‐axis represents the average classification error of a pair of classifiers. The green, blue and red squares denote the centroids of RS, Lasso, and our proposed method classifier clouds, respectively. [Color figure can be viewed in the online issue, which is available at http://wileyonlinelibrary.com.]
Figure 12
Figure 12
Results of AD versus NC classification with different parameter values for λ1 and λ2. Note that λ1 and λ2 are chosen from {2−10, 2−9, ⋯, 20}. Here, ACC denotes accuracy, SEN means sensitivity, SPE represents specificity, and AUC denotes the area under ROC curve. [Color figure can be viewed in the online issue, which is available at http://wileyonlinelibrary.com.]
Figure 13
Figure 13
Classification accuracy achieved by our proposed method with different weighting values of a(1) for the main‐view group in AD versus NC classification (a line with circle markers) and p‐MCI versus s‐MCI classification (a line with triangle markers). Note that the weighting values for the main‐view group range from 0.1 to 0.9 with step 0.1, while other two parameters λ1 and λ2 are chosen from {2−10, 2−9, ⋯, 20} through cross‐validation. [Color figure can be viewed in the online issue, which is available at http://wileyonlinelibrary.com.]

References

    1. Ashburner J, Friston KJ (2000): Voxel‐based morphometry‐the methods. NeuroImage 11:805–821. - PubMed
    1. Ashburner J, Hutton C, Frackowiak R, Johnsrude I, Price C, Friston K (1998): Identifying global anatomical differences: Deformation‐based morphometry. Hum Brain Mapp 6:348–357. - PMC - PubMed
    1. Basha T, Moses Y, Kiryati N (2013): Multi‐view scene flow estimation: A view centered variational approach. Int J Comput Vis 101:6–21.
    1. Beck A, Teboulle M (2009): A fast iterative shrinkage‐thresholding algorithm for linear inverse problems. Siam J Imging Sci 2:183–202.
    1. Bozzali M, Filippi M, Magnani G, Cercignani M, Franceschi M, Schiatti E, Castiglioni S, Mossini R, Falautano M, Scotti, G , Comi G, Falini A. (2006): The contribution of voxel‐based morphometry in staging patients with mild cognitive impairment. Neurology 67:453–460. - PubMed

Publication types

LinkOut - more resources