. 2015 Apr 16;520(7547):349-52.
doi: 10.1038/nature14108. Epub 2015 Jan 26.

Thirst driving and suppressing signals encoded by distinct neural populations in the brain

Affiliations

Thirst driving and suppressing signals encoded by distinct neural populations in the brain

Yuki Oka et al. Nature. .

Abstract

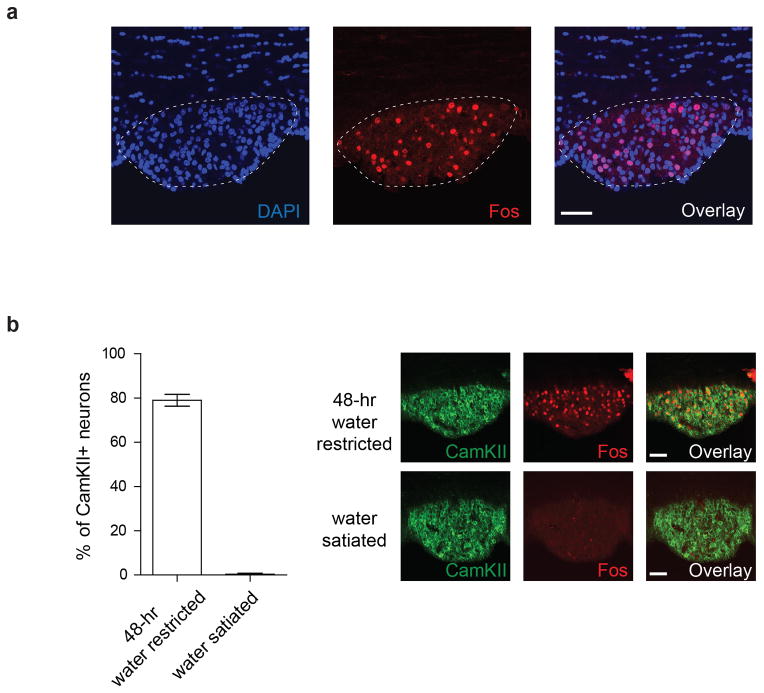
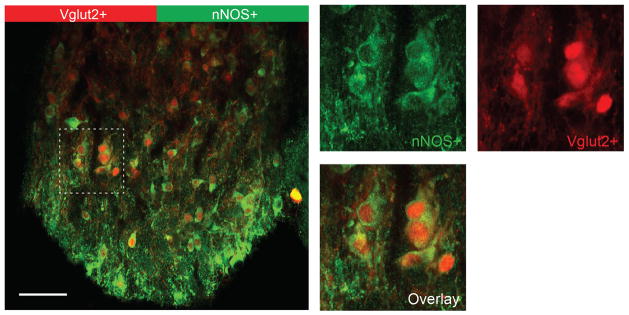
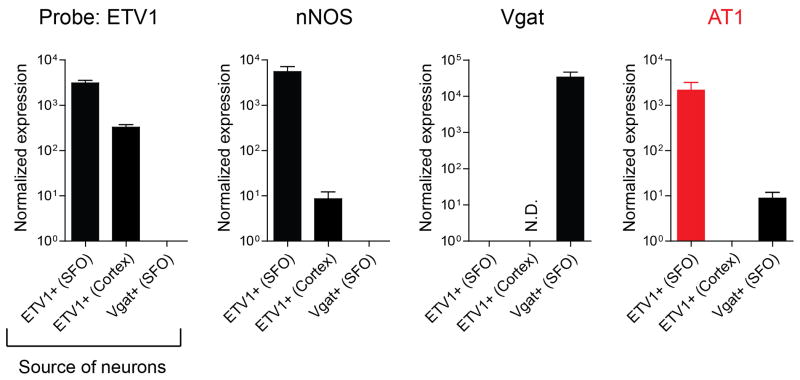
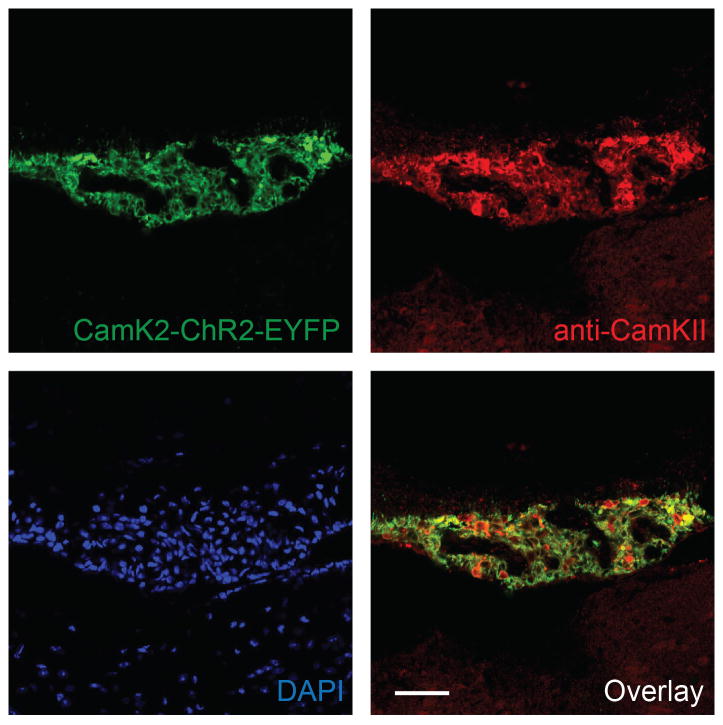
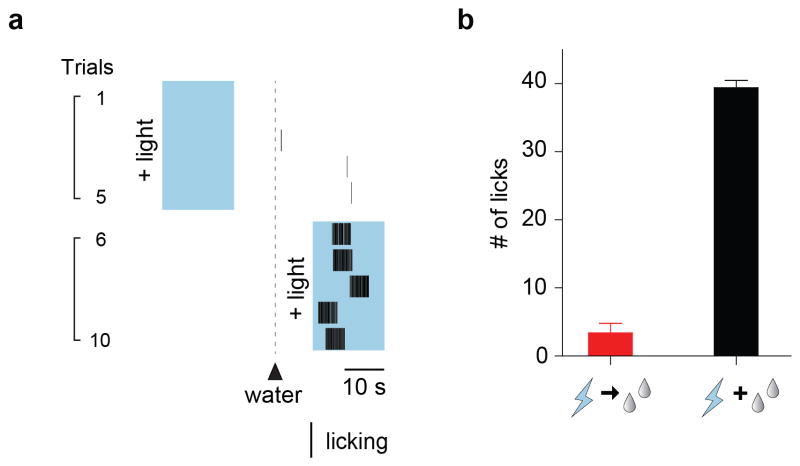
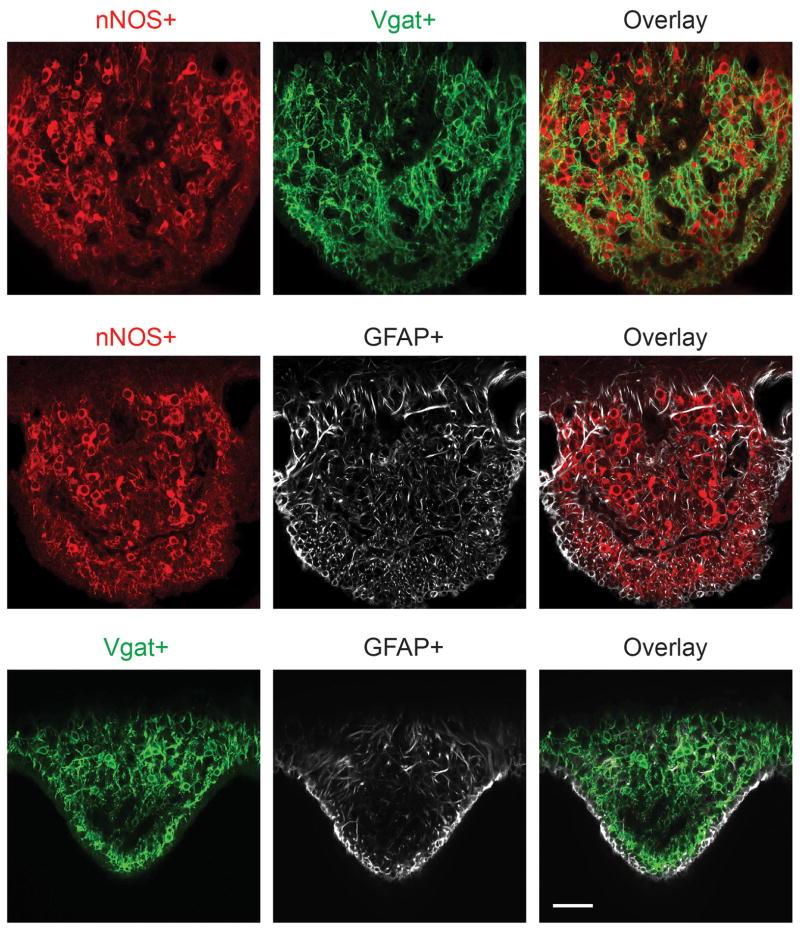
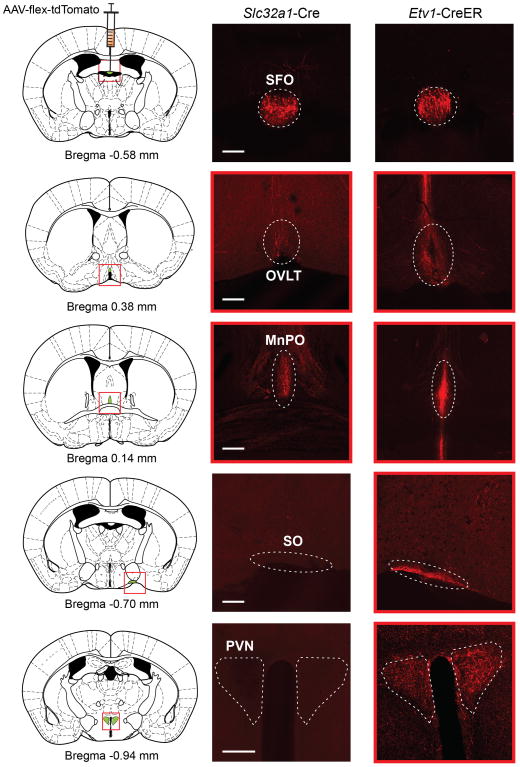
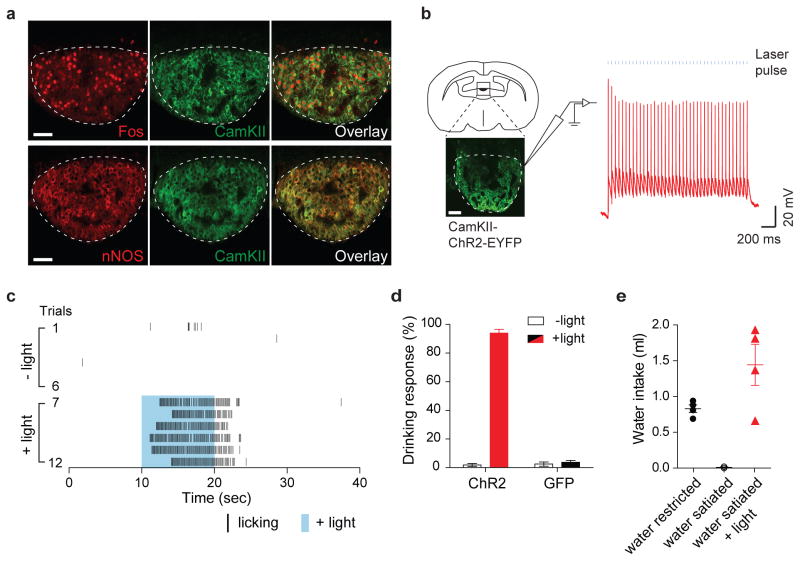
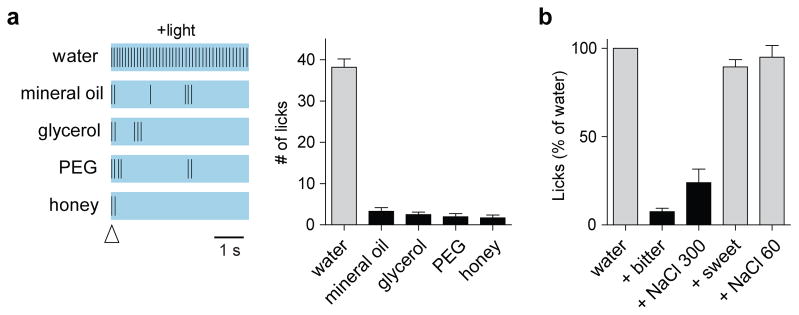
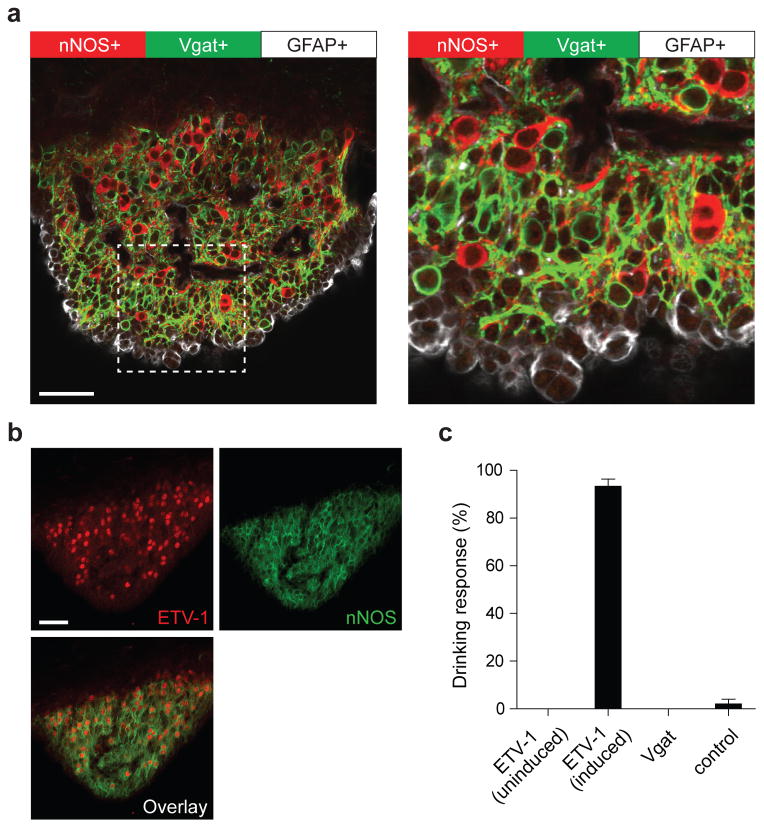
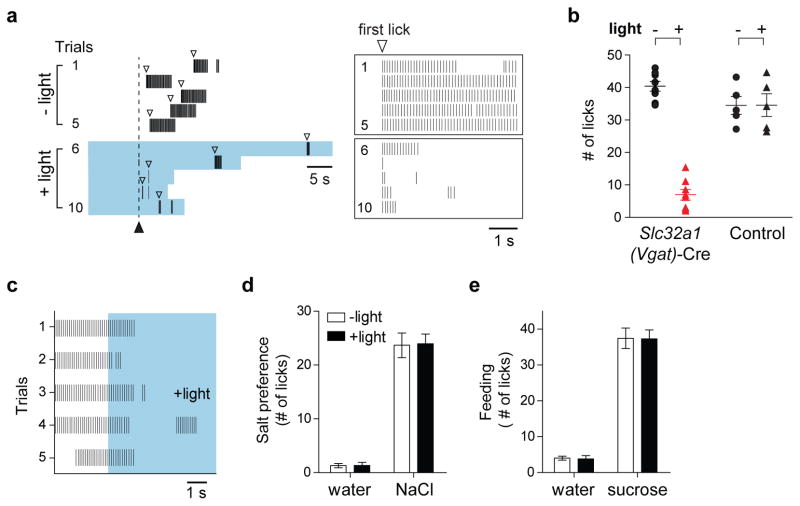
Thirst is the basic instinct to drink water. Previously, it was shown that neurons in several circumventricular organs of the hypothalamus are activated by thirst-inducing conditions. Here we identify two distinct, genetically separable neural populations in the subfornical organ that trigger or suppress thirst. We show that optogenetic activation of subfornical organ excitatory neurons, marked by the expression of the transcription factor ETV-1, evokes intense drinking behaviour, and does so even in fully water-satiated animals. The light-induced response is highly specific for water, immediate and strictly locked to the laser stimulus. In contrast, activation of a second population of subfornical organ neurons, marked by expression of the vesicular GABA transporter VGAT, drastically suppresses drinking, even in water-craving thirsty animals. These results reveal an innate brain circuit that can turn an animal's water-drinking behaviour on and off, and probably functions as a centre for thirst control in the mammalian brain.


Figures

Extended Data Figure 1
Extended Data Figure 1. Fos induction by water-deprivation in the SFO
(a) Approximately 30% of cells in the SFO (visualized with DAPI staining, blue) of a water restricted animal (48-hr) are Fos-positive (red, 26 ± 1.9%, n=3). (b) No significant Fos labeling was detected under water-satiated condition (lower panel). Scale bar, 50 μm. The graph shows quantification of Fos-positive cells among CamKII+ neurons, both under water-restricted and satiated conditions. Values are means ± s.e.m (n=3)
Extended Data Figure 2
Extended Data Figure 2. nNOS-positive neurons in the SFO co-express Vglut2, an excitatory neuronal marker
nNOS antibody staining (green) of the SFO from a Slc17a6-Cre/Ai9 transgenic animal expressing tdTomato in Vglut2-positive neurons (red); the right panel shows a magnified view illustrating the overlap between tdTomato- and nNOS-positive signals. Scale bar, 50 μm.
Extended Data Figure 3
Extended Data Figure 3. Angiotensin receptor AT1 is enriched in ETV-1+ neurons in the SFO
Quantitative PCR analysis of gene expression in three groups of neurons: ETV-1+ neurons from the SFO, ETV-1+ from the cerebral cortex, and Vgat+ neurons from the SFO. Individual data points were normalized to the levels of GAPDH. Shown are the qPCR results for ETV1, nNOS, Vgat and AT1 in the three different samples; data is presented for each gene as its relative abundance compared to the tissue with the lowest level of expression (for example nNOS is expressed 10x more abundantly in ETV1-positive neurons from the cortex than in Vgat neurons from the SFO, and 1000x more abundantly in ETV-1 positive neurons from the SFO than the cortex). Note, that AT1 is highly enriched in ETV-1+ SFO neurons. N.D.: not detected. Values are means ± s.e.m (n=3 technical replicates)
Extended Data Figure 4
Extended Data Figure 4. Virally-expressed ChR2-EYFP under the control of CamKII promoter co-localized with endogenous CamKII
Tissue staining of the SFO in a wild type animal infected with AAV-CamKIIa-ChR2-EYFP. Expression of ChR2-EYFP (labeled with anti-GFP antibody) overlapped endogenous CamKII expression (anti-CamKII antibody, upper right). Lower left panel shows DAPI staining (blue). Scale bar, 50 μm.
Extended Data Figure 5
Extended Data Figure 5. ChR2-dependent drinking requires activation of SFO CamKII positive neurons concurrently with water presentation
(a) Representative raster plots illustrating drinking behavior in a wild type animal expressing ChR2-EYFP under the control of CamKII promoter. Trials were performed with photostimulation (blue shadings) delivered before (trials 1–5) or during (trials 6–10) water presentation. The solid arrowhead indicates the first lick in each trial. Each black bar denotes an individual licking event. Note that photostimulation in the absence of water does not lead to drinking after stimulation, even if water is presented a few seconds after the termination of the light stimulation. (b) Quantification of drinking responses in 6 animals expressing AAV-flex-ChR2-EYFP in CamKII-positive neurons before (red bar) and during (black bar) water presentation (Mann-Whitney test, P< 0.003). Animals were tested for 5 trials each, and the total number of licks was averaged across trials. Values are means ± s.e.m.
Extended Data Figure 6
Extended Data Figure 6. Three distinct cell populations in the SFO
Using a combination of data from the Allen Brain Atlas (http://mouse.brain-map.org) and a candidate gene approach we identified three genetically separable, non-overlapping populations in the SFO. One population is defined by the expression of nNOS (red); also overlapping with CamKII- and ETV-1-positive cells (see Figures 3a and b). A second one is Vgat-expressing population visualized in a transgenic animal expressing ChR2-EYFP in Vgat-positive neurons (labeled with anti-GFP antibody, green). A third one is characterized by the expression of GFAP (white). Shown are double immunohistochemical staining of nNOS and Vgat-positive neurons (top panel), nNOS and GFAP (middle panel), and GFAP and Vgat-positive neurons (bottom panel). Scale bar, 50 μm.
Extended Data Figure 7
Extended Data Figure 7. Neural projections from Vgat- and Etv-1-positive SFO neurons
Slc32a1-Cre (Vgat-cre; left panel) and Etv1-CreER (right panel) mice were independently injected with AAV-flex-tdTomato in the SFO, and the axon-projections of Vgat-positive and ETV1-positive neurons examined using tdTomato reporter expression (red). Shown are the injection sites (top panels) and representative images of four brain regions receiving input from the SFO: OVLT, the organum vasculosum of the lamina terminalis; MnPO, the median preoptic nucleus; SO, the supraoptic nucleus; PVN, the paraventricular hypothalamic nucleus. Although we cannot preclude additional sites, these four areas exhibited the most prominently labeled projections from the SFO neurons. Scale bars, 200 μm.
Figure 1
Figure 1. Activation of excitatory neurons in the subfornical organs (SFO) triggers immediate drinking behavior
(a) Water-deprivation activates CamKII/nNOS-positive neurons in the SFO. Robust Fos expression was induced in the SFO after water restriction for 48-hr. Shown are double immunolabeling for Fos and CamKII. Most Fos positive neurons co-expressed CamKII (95.9 ± 0.3%, n=3); also shown is the co-expression of CamKII with nNOS. These neurons are excitatory as they are marked by a VGlut2 trasgenic reporter (Extatended Data Fig 2). (b) Whole-cell patch-clamp recording from SFO CamKII-positive neurons in acute hypothalamic slices demonstrating light-induced activation of the ChR2-expressing neurons. Shown are traces of a representative neuron subjected to 40 pulses of ChR2 excitation (20 Hz; 2 ms pulses); blue bars denote the time and duration of the light stimulus. Scale bars, 50 μm. (c) Photostimulation of CamKII-positive neurons in the SFO (trials 7–12; blue shading) triggered intense drinking; each black bar indicates an individual licking event. In the absence of light stimulation the same water-satiated animal exhibits very sparse events of drinking (trials 1–6). (d) Success of inducing drinking by photostimulation of the SFO. The Drinking Response (%) was calculated by determining the number of trials with >5 licks over the total number of trials; animals were tested for >10 trials each (see Methods for details). The panel shows animals infected with AAV-CamKIIa-ChR2-EYFP (n=10; red bar), and control mice infected with AAV-CamKIIa-GFP (n=4; black bar); white bars indicate the responses in the absence of photostimulation (Mann-Whitney test P < 0.0003). (e) Quantitation of the volume of water consumed within 15 min by 3 groups of animals: water-restricted for 48-hr, water-satiated, and water-satiated but photostimulated during the test; light (20 Hz) was delivered with a regime of 30 s ON and 30 s OFF for the entire 15 min session (n=4, Mann-Whitney test, P < 0.03 for water-satiated ± light). Values are means ± s.e.m.
Figure 2
Figure 2. CamKII-positive SFO neurons mediate thirst
Activation of CamKII-positive neurons in the SFO drives selective drinking of water. (a) Representative raster plots illustrating licking events during a 5 s window in the presence of photostimulation; the open arrowhead indicates the first lick in each trial. The right panel shows quantification of similar data for multiple animals (n=6 for honey, and 7 for others; Mann Whitney P < 0.002); all animals were water-satiated. (b) Photostimulated animals did not drink water in the presence of a bitter compound (3 μM cycloheximide; paired t test, P < 0.0001), or high concentration of salt (300 mM; paired t test, P < 0.001), but did so in the presence of a sweet compound (30 mM sucrose), or low salt (60 mM); data were normalized to the number of licks to water alone. Values are means ± s.e.m (n=5 animals)
Figure 3
Figure 3. Three distinct cell populations in the SFO
(a) Tissue staining of the SFO from a transgenic animal expressing ChR2-EYFP in Vgat neurons (labeled with anti-GFP antibody, green) and co-labeled with anti-nNOS (red) and anti-GFAP antibodies (white); the right panel shows a magnified view illustrating the non-overlap between the three populations. (b) ETV-1 (red) and nNOS (green) are co-expressed in most of the same neurons (>90% overlap, n=3). Scale bars 50 μm. (c) Photostimulation of ChR2 in ETV-1-positive neurons triggers robust drinking responses in tamoxifen-induced (n=6), but not uninduced animals (n=4). In contrast, stimulation of ChR2 in Vgat (n=8) neurons or GFAP+ glial cells (data not shown) had no effect on drinking behavior. Control wild type mice infected with AAV-flex-ChR2-EYFP showed no responses to light stimulation (n=5). Values are means ± s.e.m
Figure 4
Figure 4. Activation of Vgat-positive neurons in the SFO suppresses thirst
(a) Drinking behavior of a 24-hr water-deprived animal expressing ChR2 in Vgat-positive neurons. Trials were performed in the absence (trials1–5) or presence of photostimulation (trial 6–10). The solid arrowhead indicates the time of water presentation, and the open arrowheads mark the first lick; animals were allowed to lick for 5 s following the first lick in each trial. Light stimulation (blue shading) was started 10 s prior to water presentation, and maintained until the end of the 5 s licking window. The boxes on the right show an enlargement of these 10 trials, each aligned to the first lick. Note the strong suppression during photostimulation. (b) Graph quantifying the degree of suppression animals expressing AAV-flex-ChR2-EYFP in Vgat-positive neurons of the SFO (Slc32a1-Cre) with or without light stimulation (Mann-Whitney test, P< 0.002; n=8). Also shown are wild type control mice infected with the same AAV-flex-ChR2-EYFP construct (n=5). Animals were tested for >5 trials each, and the total number of licks was averaged across trials. Photostimulation of the GFAP-positive population had no effect on drinking (data not shown). (c) Activation of Vgat-positive neurons suppresses drinking behavior even if animals were actively drinking. The plot illustrates the drinking response of a thirsty animal in 5 tests, before and during photostimulation (blue shading); the trials were aligned 3 s before photostimulation. (de) Photostimulation of Vgat-positive neurons did not suppress salt appetite in salt- depleted animals (150 mM NaCl), or sugar intake in hungry animals (300 mM sucrose); values are means ± s.e.m (n=7).

References

    1. McKinley MJ, et al. The sensory circumventricular organs of the mammalian brain. Advances in anatomy, embryology, and cell biology. 2003;172:1–122. - PubMed
    1. Young JK. Hunger, Thirst, Sex, and Sleep: How the Brain Controls Our Passions. Rowman & Littlefield Publishers, Inc; 2012.
    1. Sternson SM. Hypothalamic survival circuits: blueprints for purposive behaviors. Neuron. 2013;77:810–824. - PMC - PubMed
    1. Daniels D, Fluharty SJ. Salt appetite: a neurohormonal viewpoint. Physiology & behavior. 2004;81:319–337. - PubMed
    1. Geerling JC, Loewy AD. Central regulation of sodium appetite. Experimental physiology. 2008;93:177–209. - PubMed

Publication types

Substances