. 2015 Feb 26;518(7540):502-506.
doi: 10.1038/nature14183. Epub 2015 Jan 26.

Lagging-strand replication shapes the mutational landscape of the genome

Affiliations

Lagging-strand replication shapes the mutational landscape of the genome

Martin A M Reijns et al. Nature. .

Abstract

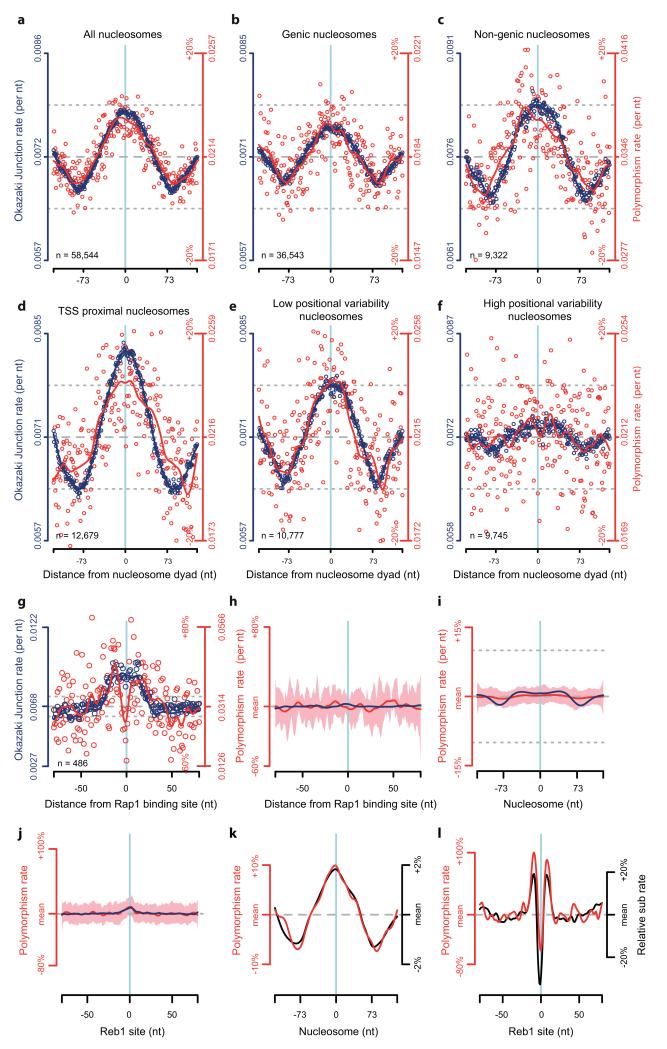
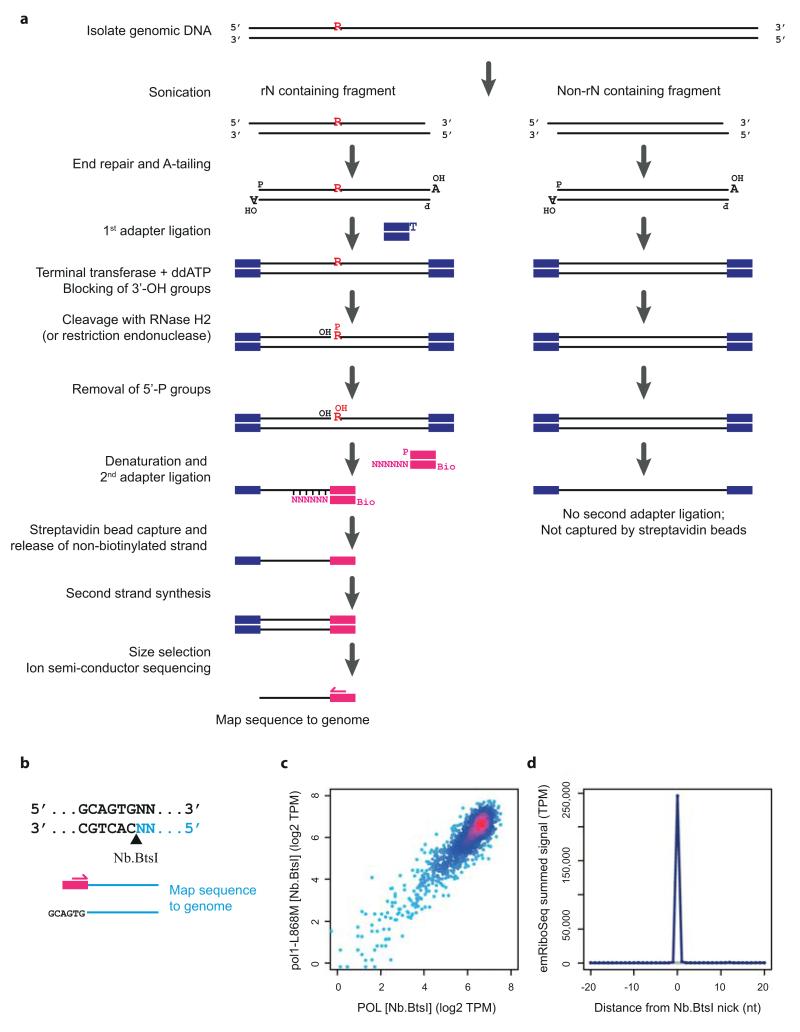
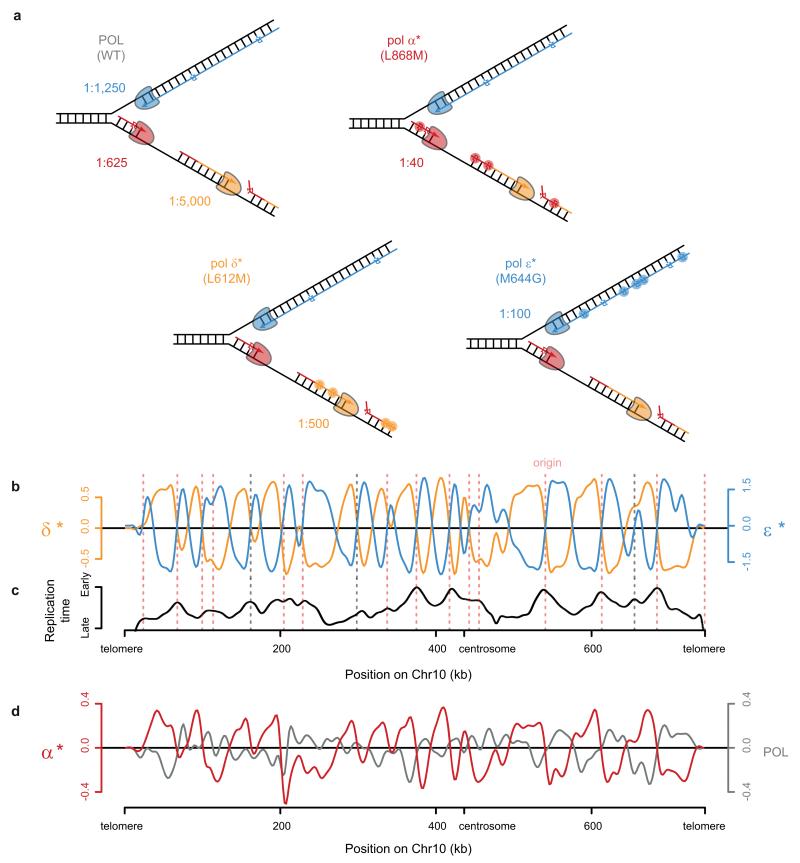
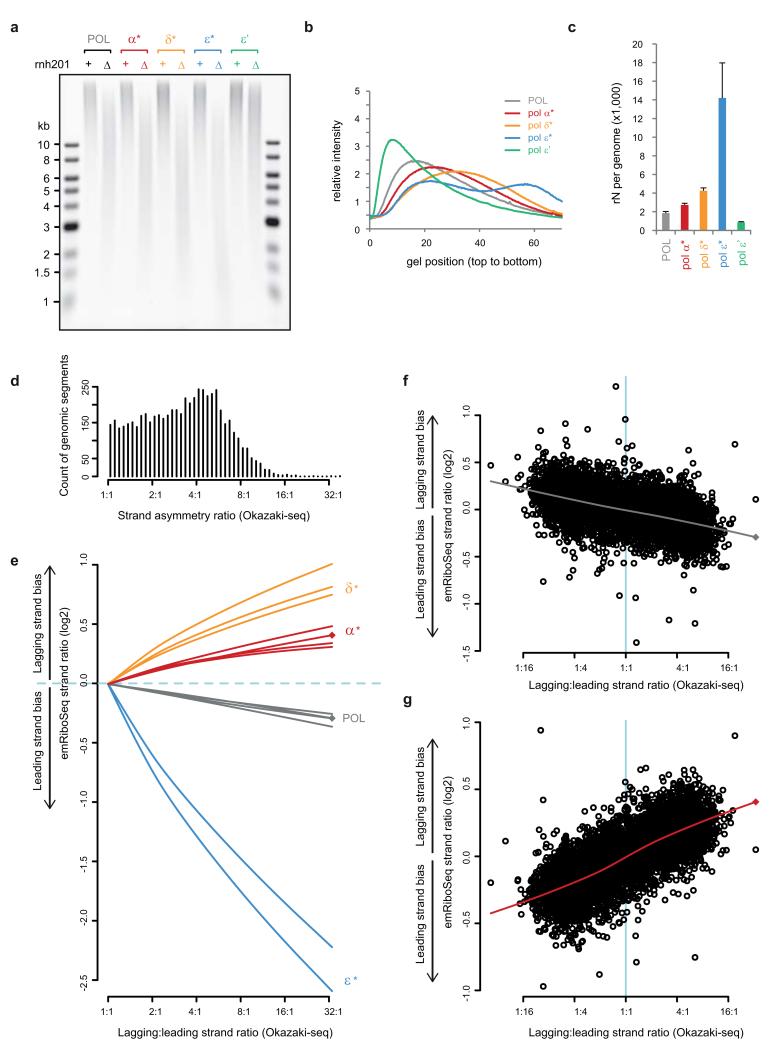
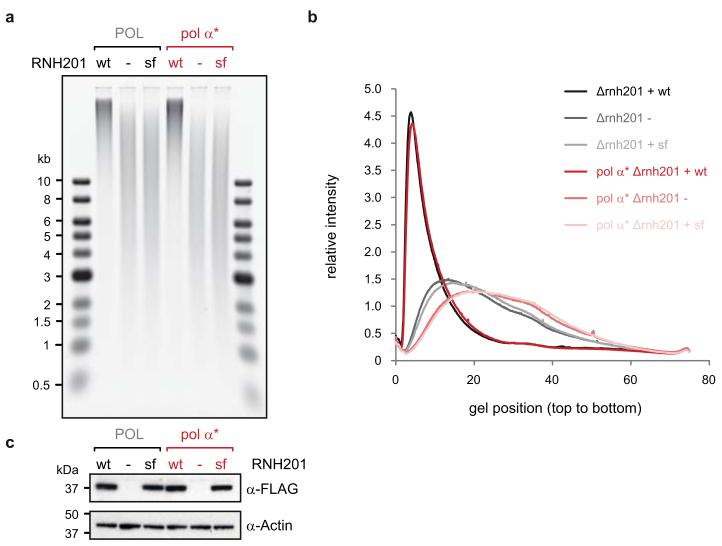
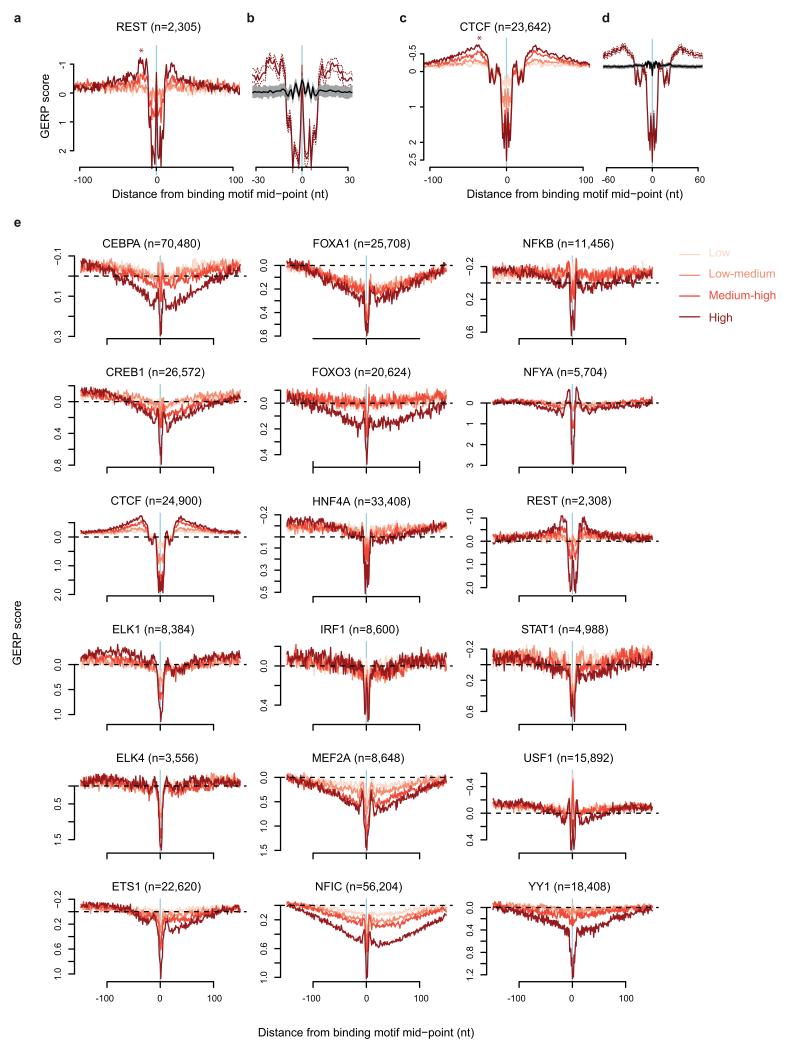
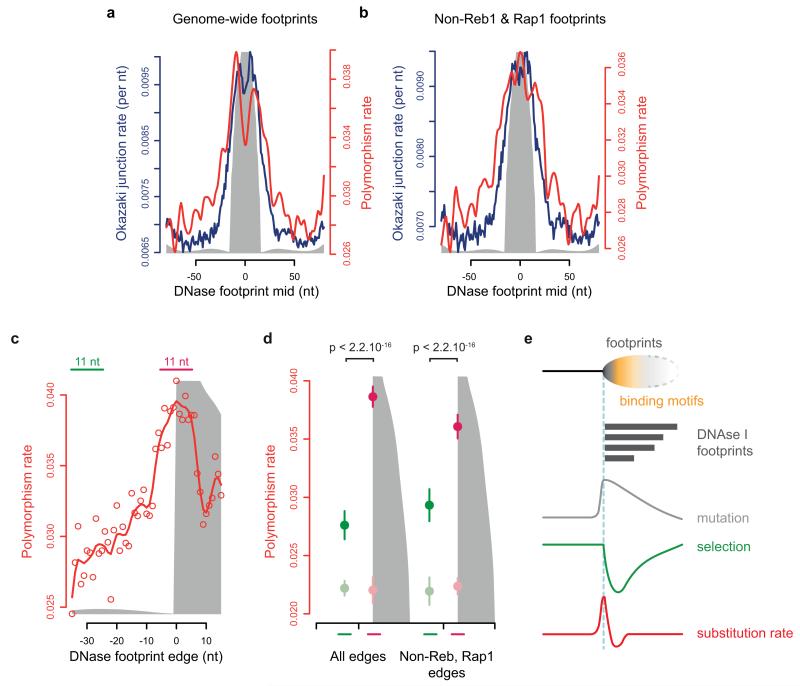
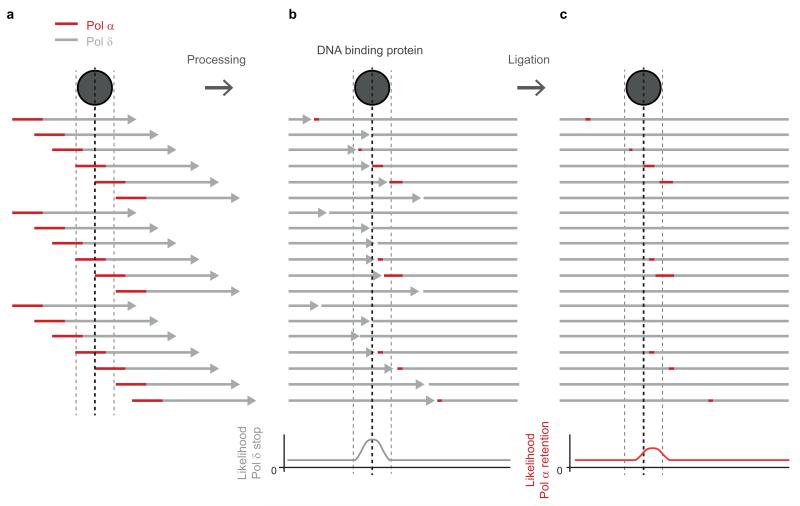
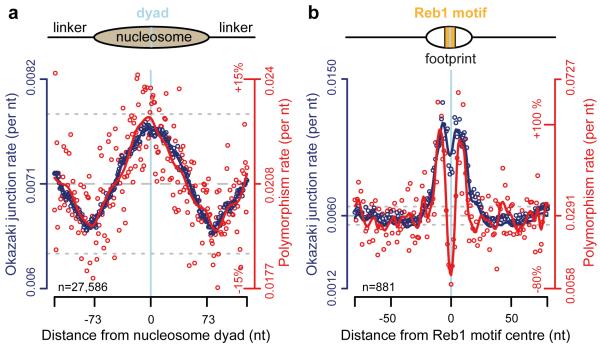
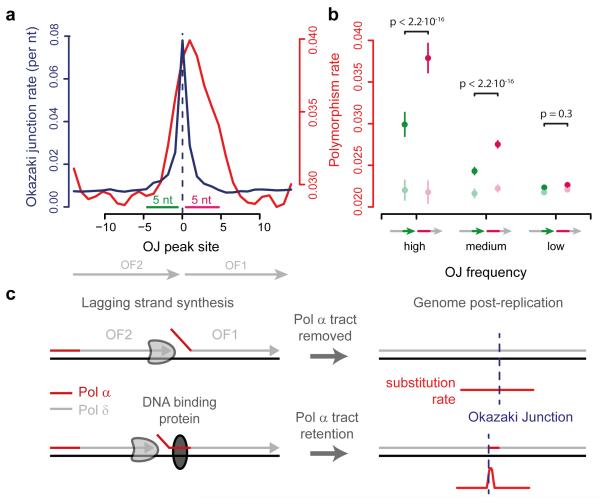
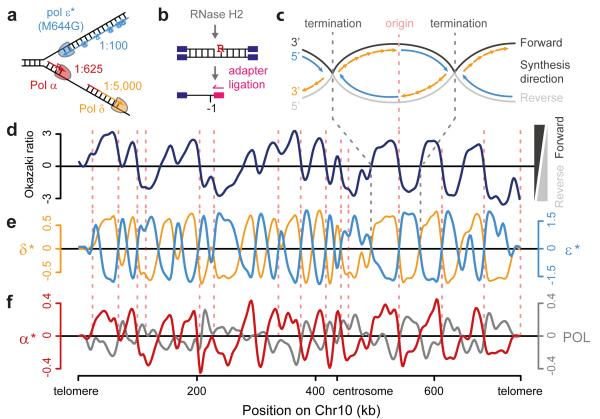
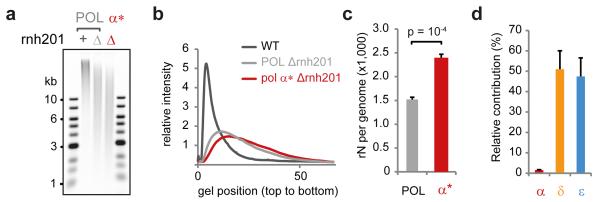
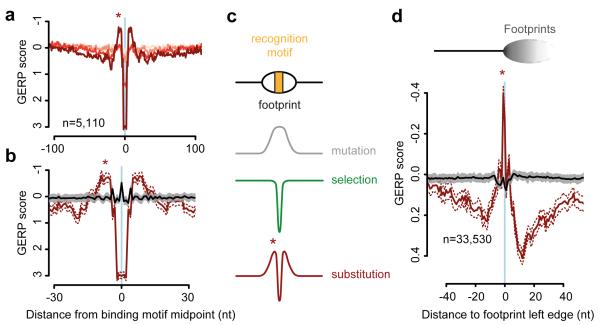
The origin of mutations is central to understanding evolution and of key relevance to health. Variation occurs non-randomly across the genome, and mechanisms for this remain to be defined. Here we report that the 5' ends of Okazaki fragments have significantly increased levels of nucleotide substitution, indicating a replicative origin for such mutations. Using a novel method, emRiboSeq, we map the genome-wide contribution of polymerases, and show that despite Okazaki fragment processing, DNA synthesized by error-prone polymerase-α (Pol-α) is retained in vivo, comprising approximately 1.5% of the mature genome. We propose that DNA-binding proteins that rapidly re-associate post-replication act as partial barriers to Pol-δ-mediated displacement of Pol-α-synthesized DNA, resulting in incorporation of such Pol-α tracts and increased mutation rates at specific sites. We observe a mutational cost to chromatin and regulatory protein binding, resulting in mutation hotspots at regulatory elements, with signatures of this process detectable in both yeast and humans.


Figures

Extended Data Figure 1
Extended Data Figure 1. Increased OJ and polymorphism rates correlate at binding sites of different nucleosome classes and at Rap1 binding sites
a-f, OJ and polymorphism rates are strongly correlated for different classes of nucleosomes. Data presented as in Fig. 1a, for different sub-classes of S. cerevisiae nucleosomes, demonstrating that OJ and polymorphism rates co-vary in all cases. Transcription start site (TSS) proximal nucleosomes (d) are likely subject to strong and asymmetrically distributed selective constraints, which likely explains the modestly reduced correlation for this subset. Such TSS proximal nucleosomes were excluded from analyses of other categories presented (b, c, e, f), except ‘All nucleosomes’ (a). g, OJ and polymorphism rates are correlated for the S. cerevisiae TF, Rap1. Data presented, as for Reb1 in Fig. 1b, show elevated OJ and polymorphism rates around its binding site, with a dip corresponding to its central recognition sequence. h-j, Elevated polymorphism and OJ rates at Rap1 (h), nucleosome (i) and Reb1 binding sites (j) are not due to biases in nucleotide content. Distributions calculated as for g, Fig. 1a and b respectively, using a 3-mer preserving genome shuffle. Pink shaded areas, 95% confidence intervals for nucleotide substitution rates (100 shuffles). k, l, Polymorphism (red) and between-species (black) substitution rates are highly correlated for nucleosome (k) and Reb1 (l) binding sites. Best fit splines shown only. Y-axes scaled to demonstrate similar shape distribution. Values plotted as percentage relative to the mean rate for all data points (central 11 nt excluded for calculation of mean in l).
Extended Data Figure 2
Extended Data Figure 2. EmRiboSeq methodology and validation
a, Schematic of emRiboSeq library preparation. b-d, Validation of strand-specific detection of enzymatically generated nicks through linker-ligation. Nb.BtsI nicking endonuclease cleaves the bottom strand of its recognition site releasing a 5′ fragment (cyan) with a free 3′-OH group after denaturation, to which the sequencing adaptor (pink) is ligated, allowing sequencing and mapping of this site to the genome (b). Nb.BtsI libraries have high reproducibility between Δrnh201 POL and Δrnh201 Pol-α* (pol1-L868M) strains after normalising read counts to sequence tags per million (TPM). Bona fide Nb.BtsI sites were equally represented, at maximal frequency, in both libraries (c). Those with lower frequencies represented sites in close proximity to other Nb.BtsI sites, causing their partial loss during size selection. Additionally, Nb.BtsI-like sites were detected as the result of star activity. Libraries were also prepared using BciVI restriction enzyme digestion, that did not show such star activity (data not shown), allowing calculation of the site specificity for the method (>99.9%). Summed signal at Nb.BtsI sites shows >99.9% strand specificity (blue, correct strand; grey, opposite strand) and >99% single nucleotide resolution (d).
Extended Data Figure 3
Extended Data Figure 3. Mapping replicative polymerase DNA synthesis using emRiboSeq
a, Point mutations in replicative polymerases elevate ribonucleotide incorporation rates, permitting their contribution to genome synthesis to be tracked. Schematic of replication fork with polymerases and their ribonucleotide incorporation rates (, and JS Williams, AR Clausen & TA Kunkel, personal communication) as indicated (POL, WT polymerases; *, point mutants). Embedded ribonucleotides indicated by ‘R’; additional incorporation events due to polymerase mutations highlighted by shaded circles. b, c, Mapping of leading/lagging strand synthesis by Pol δ* and Pol ε* yeast strain using emRiboSeq (as in Fig. 3) highlights both experimentally validated (pink dotted lines) and putative replication origins (grey dotted lines). These often correspond to regions of early replicating DNA (c). d, Pol α* DNA is detected genome-wide by emRiboSeq as a component of the lagging strand in stationary phase yeast, as shown by the opposite pattern for a polymerase WT strain. Strand ratios are shown as best fit splines with 80 degrees of freedom, y-axes show log2 of the strand ratio calculated in 2,001 nt windows (b-d).
Extended Data Figure 4
Extended Data Figure 4. Quantification of in vivo ribonucleotide incorporation by replicative polymerases
a, b, Representative alkaline gel electrophoresis of genomic DNA from yeast strains with mutant replicative DNA polymerases (a), with accompanying densitometry plots (b). Embedded ribonucleotides are detected by increased fragmentation of genomic DNA following alkaline treatment in an RNase H2-deficient (Δrnh201) background. Elevated rates are seen with all three mutant polymerases (indicated by *, as defined in Extended data Fig. 3a), and are reduced in Pol-ε′ which contains the point mutation M664L, a mutation that increases selectivity for dNTPs over rNTPs. c, Quantification of average ribonucleotide incorporation in polymerase mutants from n=4 independent experiments. DNA isolated from mid-log phase cultures; error bars, SE. Overall ribonucleotide content is the product of incorporation frequency and the total contribution of each polymerase, resulting in the total ribonucleotide content detected to be highest for Pol-ε* (14,200 per genome), followed by Pol-δ* (4,300 per genome), Pol-α* (2,700 per genome), POL (1,900 per genome) and Pol-ε′ (860 per genome). d, The majority of the yeast genome exhibits directional asymmetry in replication (median 4:1 strand ratio). Count of genomic segments calculated for consecutive 2,001 nt windows over the yeast genome based on reanalysis of OF sequencing data denoted as ‘Okazaki-seq’. The strand asymmetry ratio was calculated after re-orienting all regions such that the predominant lagging strand was the forward strand. e-g, Genome-wide quantification of strand-specific incorporation of wild type and mutant replicative DNA polymerases determined by emRiboSeq reflects their roles in leading and lagging strand replication. A close to linear correlation with Okazaki-seq strand ratios is observed. The strand ratio preference for lagging strand ribonucleotide incorporation for independent libraries (including stationary phase libraries for POL and Pol-α*, marked by diamonds) was plotted against the lagging:leading strand ratio determined using Okazaki-seq data (only ratios ≥ 1:1 for the latter are shown for clarity). There was high reproducibility between experiments in strand ratio preferences. Lines are lowess smoothed (see Methods) representations of the full datasets (representative examples given in f and g). f, g, Scatter plots illustrating the individual strand ratio data points for 2,001 nt windows, for stationary phase POL (f) and Pol-α* (g) yeast. Pearson’s cor=0.49, p < 2.2×10⁻¹⁶ for POL (f); cor=0.75, p< 2.2×10⁻¹⁶ for Pol-α* (g).
Extended Data Figure 5
Extended Data Figure 5. Pol-α synthesised DNA retention is independent of RNaseH2 processing of RNA primers
a, b, The ribonucleotide content of genomic DNA is unchanged between Δrnh201 strains transformed with empty vector (−) or vector expressing Rnh201p separation of function mutant (sf), that retains the ability to cleave RNA:DNA hybrids, including RNA primers, but cannot cleave single embedded ribonucleotides. In contrast, the same vector expressing wild type Rnh201p (wt) fully rescues alkaline sensitivity of the DNA. As complementation with the SOF mutant had no detectable effect on the ribonucleotide content seen in the Pol-α L868M Δrnh201 strain, retention of Pol-α synthesised DNA appears to be independent of a putative role for RNase H2 in RNA primer removal. c, Wild type and mutant Rnh201p are expressed at equal levels, as shown by immuno-detection of the C-terminal FLAG tag. Loading control, actin.
Extended Data Figure 6
Extended Data Figure 6. Elevated substitution rates are observed adjacent to many human TF binding sites
a-d, Nucleotide substitution rates (plotted as GERP scores) are elevated immediately adjacent to REST (a, b) and CTCF binding sites (c, d). Colour intensity shows quartiles of ChIP-seq peak height (pink to brown: lower to higher), reflecting strength of binding/occupancy. Stronger binding correlates with greater elevation of proximal substitution rate in the ‘shoulder’ region (*). Elevated substitution rates are not a consequence of local sequence composition effects (b, d). Strongest binding quartile of sites (brown) is shown compared to a 3-mer preserving shuffle (black) based on the flanking sequence (100 to 300 nt from motif mid-point) of the same genomic locations. 95% confidence intervals are shown as a brown dashed line and grey shading, respectively. e, Substitution rates plotted as GERP scores for human TF binding sites identified in ChIP-seq datasets (in conjunction with binding site motif). Sites aligned (x=0) on the mid-point of the TF binding site within the ChIP-seq peak (colours as for a-d). Dashed black line shows y=0, the genome wide expectation for neutral evolution.
Extended Data Figure 7
Extended Data Figure 7. OJ and polymorphism rates are elevated at yeast DNase I footprints
a, b, DNase I footprint edges correspond, genome-wide, to elevated OJ rates and locally elevated polymorphism rates in S. cerevisiae (a), a pattern that is maintained when footprints associated with Reb1 and Rap1 binding sites are excluded (b). Genome-wide DNase I footprints (n=6,063) and excluding those within 50 nt of a Reb1 or Rap1 binding site (n=5,136) were aligned to their midpoint. c, d, Aligning DNase I footprints on their left edge rather than midpoint (to compensate for substantial heterogeneity in footprint size) demonstrates a distinct shoulder of elevated polymorphism rate at the aligned edge (c), with a significant elevation compared to nearby sequence upstream from the footprint (d). DNase I footprints from a were aligned to their left edge (x=0) with corresponding polymorphism rates shown (c). The elevated polymorphism rate cannot be explained by local sequence compositional distortions (d). Nucleotide substitution rates in the 11 nt centred on the DNase footprint edge (pink line), and another 11 nt encompassing positions −35 to −25 relative to the footprint edge (green line) were quantified. Darker pink and green filled circles denote the mean of observed substitution rates and lighter shades denote the mean for the same sites after 3-nucleotide preserving genomic shuffles. Error bars, SD; Mann-Whitney test. e, Model: Correlation of increased nucleotide substitution and OJ rates are consistent with elevated mutation frequency across heterogeneous DNase I footprints. Polymorphism is reduced at sequence-specific binding sites within the footprints, due to functional constraint. Therefore the effect of OF-related mutagenesis in these regions is most sensitively detected in the region immediately adjacent to the binding site (left of vertical dashed blue line, representing footprints aligned to their left edge). This ‘shoulder’ of elevated nucleotide substitutions represents sites with elevated, OJ-associated mutation is followed by a region of depressed substitution rates, owing to selective effects of the functional binding sites within the footprints (to the right of the dashed blue line). Signals further to the right are not interpretable given the heterogeneity in DNase I footprint sizes. Given strong selection at TF and DNase I footprint sites, this ‘shoulder’ of elevated nucleotide substitutions could represent a measure for the local mutation rate for such regions, analogous to that measured by the 4-fold degenerate sites in protein coding sequence.
Extended Data Figure 8
Extended Data Figure 8. Model: Pol-α DNA tract retention downstream of protein binding sites
a, OF priming occurs stochastically, with the 5′ end of each OF initially synthesised by Pol-α and the remainder of the OF synthesised by Pol-δ. b, c, OF processing: when Pol-δ encounters the previously synthesised OF, Pol-δ continues to synthesise DNA displacing the 5′ end of the downstream OF, which is removed by nucleases to result in mature OFs which are then ligated. The OJs of such mature OFs prior to ligation were detected by Smith and Whitehouse after depletion of temperature sensitive DNA ligase I. They demonstrated that if a protein barrier is encountered (grey circle) Pol-δ progression is impaired, leading to reduced removal of the downstream OF (b). Given that ~1.5% of the mature genome is synthesised by Pol-α, a proportion of lagging strands will retain Pol-α synthesised DNA (red). When Pol-δ progression is impaired by protein binding, this will lead to an increased fraction of fragments containing Pol-α synthesised DNA downstream of such sites (c).
Figure 1
Figure 1. Elevated substitution rates at OJs
a, b, Nucleotide substitution rates (red) closely correlate with elevated OJ site frequency (blue) at (a) nucleosome and (b) Reb1 binding sites. S. cerevisiae polymorphism rates per nucleotide computed using sequences from nucleosome and Reb1 binding sites. Individual data points, open circles. Solid curves, best fit splines. Mean, dashed grey line; ±10% dotted grey lines.
Figure 2
Figure 2. Frequent nucleotide substitutions at OF 5′-ends
a, Mutation rates are elevated downstream of OJs. Substitution polymorphisms (red) and OJ rate (blue) in regions surrounding high frequency OJs (top 0.1%). n=5,660 sequences orientated for dominant direction of OF synthesis. b, Mutation rates correlate with OJ peak size. Mutations are significantly enriched downstream of the junction (pink), compared to genome shuffle controls (light green/pink). Sites grouped by OJ frequency. Error bars, SD; paired two-sided t-test. c, Hypothesis: DNA synthesised by non-proofreading Pol-α is preferentially trapped in regions rapidly bound by proteins post-replication. These act as partial barriers to Pol-δ displacement of Pol-α synthesised DNA, resulting in locally elevated mutations.
Figure 3
Figure 3. Mapping DNA synthesis in vivo using emRiboSeq
a, Replicative polymerases can be tracked using point mutants with elevated ribonucleotide incorporation. Schematic of replication fork with Pol-ε (*, M644G mutant) and ribonucleotide incorporation rates for each polymerase. Embedded ribonucleotides (R) highlighted. b, Schematic of emRiboSeq methodology. c, Schematic of replication. d, e, Mapping of leading/lagging strand synthesis and replication origins using emRiboSeq. Ratio of OFs reads between forward and reverse strands of chromosome 10 (d) corresponds to the ratio of their respective ribonucleotide content (e) for Pol-δ* (orange), whereas Pol-ε* shows negative correlation (cyan). Intersections with x-axis correspond to replication origins and termination regions (c-e). Experimentally validated origins (dotted pink lines). f, Pol-α* DNA is detected genome-wide by emRiboSeq as a component of the lagging strand. Strand ratios are shown as best fit splines, y-axes log2 of ratios (d-f)
Figure 4
Figure 4. Pol-α DNA synthesis contributes ~1.5% of the mature genome
a, b Increased ribonucleotide incorporation in Pol-α* stationary phase yeast is detected by alkaline gel electrophoresis. c, Quantification confirms significantly elevated rates (n=6; error bars, SE; paired two-sided t-test) in the Pol-α* genome. d, Estimate of relative contribution of polymerases to the genome (n=4; error bars, SE).
Figure 5
Figure 5. OF mutational signatures are conserved in humans
a, Nucleotide substitutions (plotted as GERP scores) are elevated immediately adjacent to TF NFYA binding sites. Pink to brown: lower to higher quartiles of ChIP-seq peak height (reflecting strength of binding/occupancy). Stronger binding correlates with substitution rate in the ‘shoulder’ region (*). b, Elevated substitution rates are not a consequence of local sequence composition effects. Strongest binding sites (brown) compared to 3-mer preserving shuffle (black). c, Model: Nucleotide substitution profiles are the sum of mutation rate and selective pressure. d, Interspecies substitution rates are also elevated adjacent to DNase I footprint edges (*). Sequences aligned to left footprint edges as indicated in schematic. Right footprint edge is indistinct due to heterogeneity in footprint length. Substitution rates are no longer increased after 3-mer preserving shuffle from local flanking sequences (black). 95% confidence intervals, brown dashes and grey shading (b, d).

References

    1. Kunkel TA. Evolving views of DNA replication (in)fidelity. Cold Spring Harb Symp Quant Biol. 2009;74:91–101. - PMC - PubMed
    1. Wolfe KH, Sharp PM, Li WH. Mutation rates differ among regions of the mammalian genome. Nature. 1989;337:283–5. - PubMed
    1. Alexandrov LB, Stratton MR. Mutational signatures: the patterns of somatic mutations hidden in cancer genomes. Curr Opin Genet Dev. 2014;24:52–60. - PMC - PubMed
    1. Ciccia A, Elledge SJ. The DNA damage response: making it safe to play with knives. Mol Cell. 2010;40:179–204. - PMC - PubMed
    1. Lindblad-Toh K, et al. A high-resolution map of human evolutionary constraint using 29 mammals. Nature. 2011;478:476–82. - PMC - PubMed

Methods References

    1. Kuhn RM, Haussler D, Kent WJ. The UCSC genome browser and associated tools. Brief Bioinform. 2013;14:144–61. - PMC - PubMed
    1. Derrien T, et al. Fast computation and applications of genome mappability. PLoS One. 2012;7:e30377. - PMC - PubMed
    1. Eaton ML, Galani K, Kang S, Bell SP, MacAlpine DM. Conserved nucleosome positioning defines replication origins. Genes Dev. 2010;24:748–53. - PMC - PubMed
    1. Hesselberth JR, et al. Global mapping of protein-DNA interactions in vivo by digital genomic footprinting. Nat Methods. 2009;6:283–9. - PMC - PubMed
    1. Jiang C, Pugh BF. A compiled and systematic reference map of nucleosome positions across the Saccharomyces cerevisiae genome. Genome Biol. 2009;10:R109. - PMC - PubMed

Publication types

Associated data