. 2015 Feb;145(2):93-106.
doi: 10.1085/jgp.201411304.

Gating pore currents are defects in common with two Nav1.5 mutations in patients with mixed arrhythmias and dilated cardiomyopathy

Affiliations

Gating pore currents are defects in common with two Nav1.5 mutations in patients with mixed arrhythmias and dilated cardiomyopathy

Adrien Moreau et al. J Gen Physiol. 2015 Feb.

Abstract

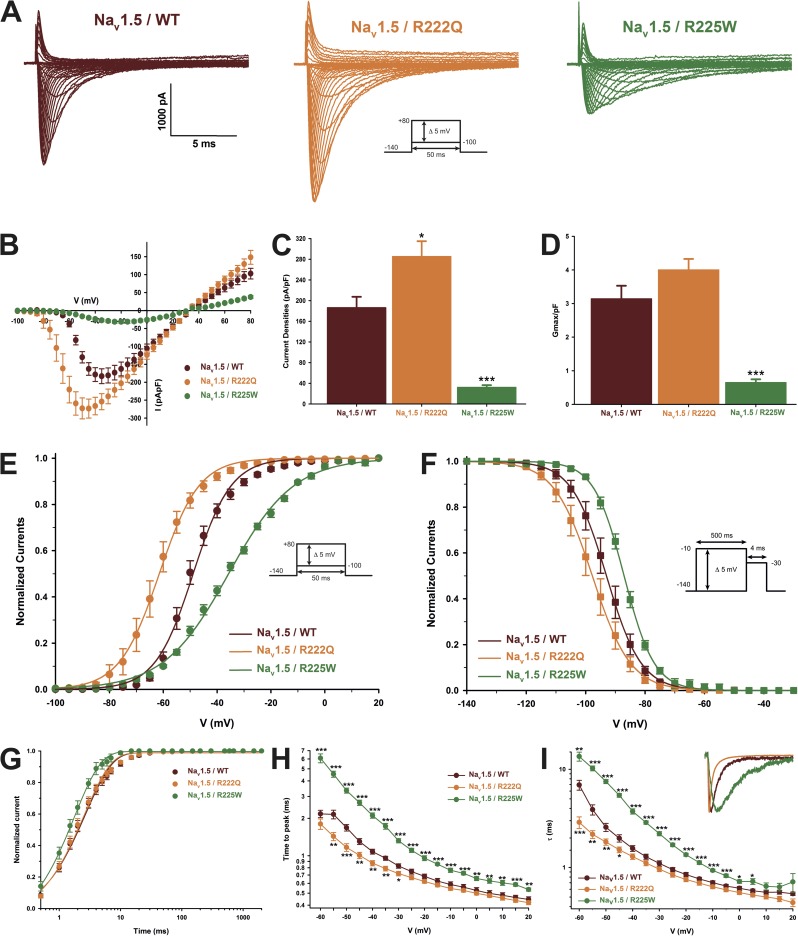
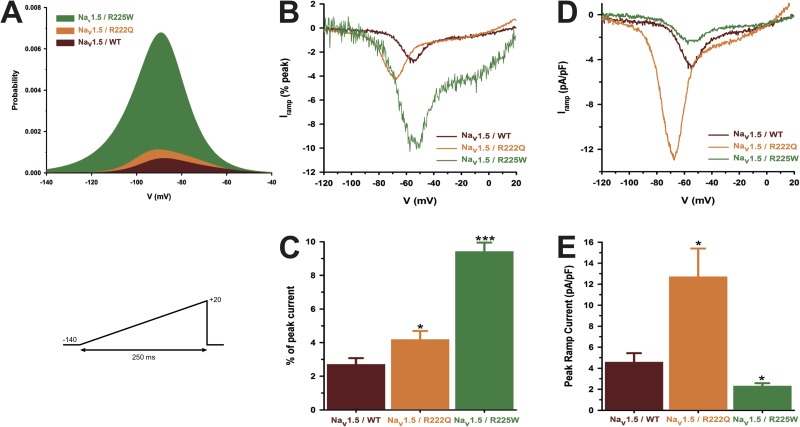
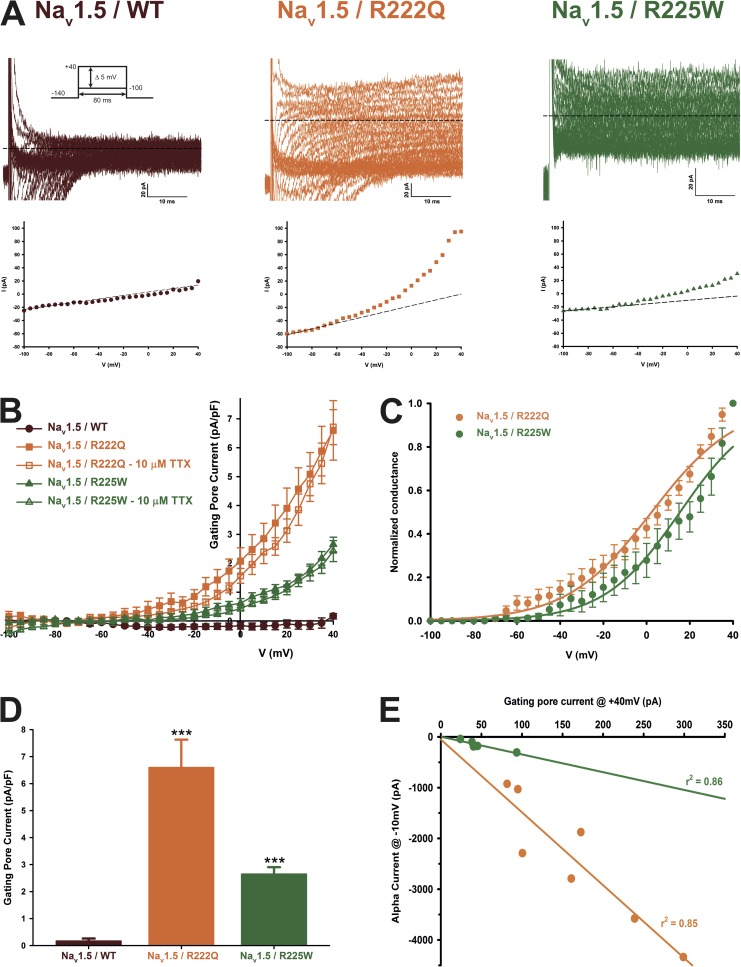
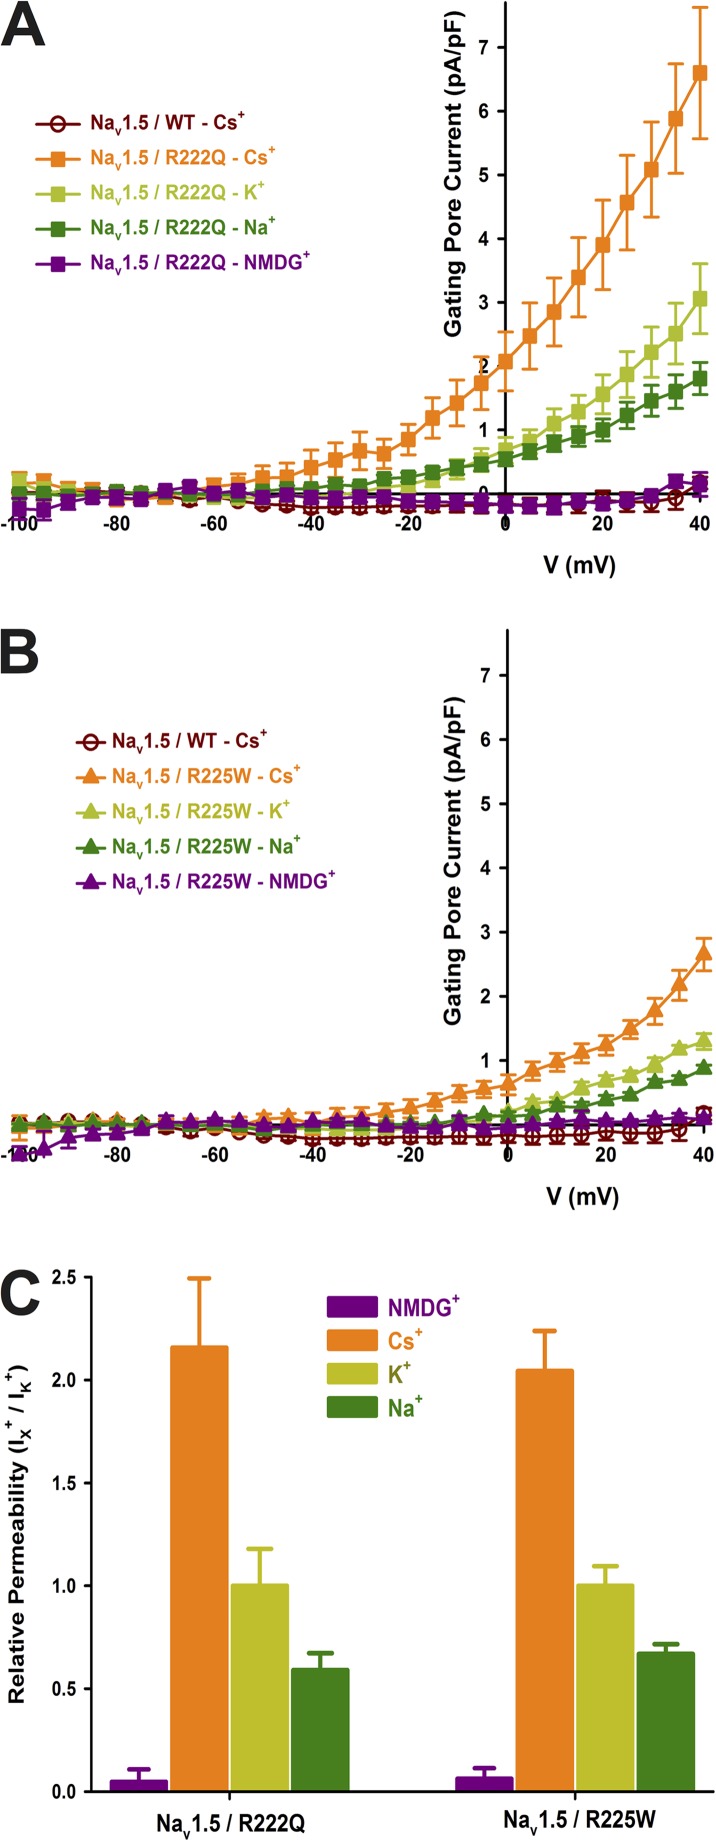
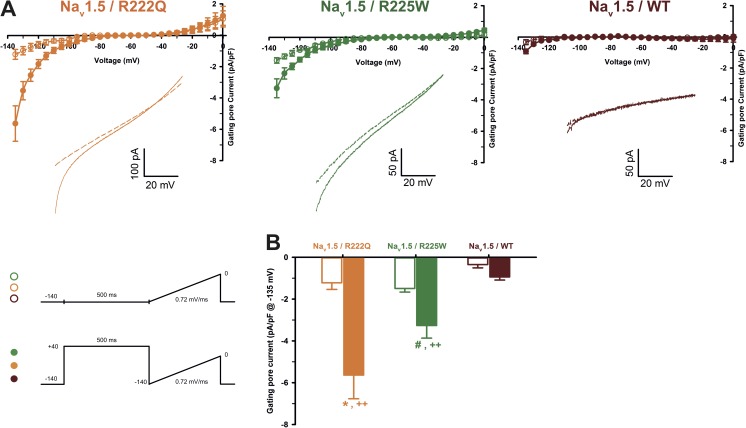
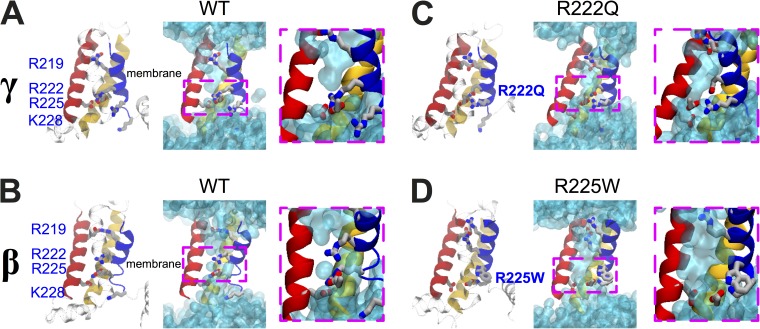
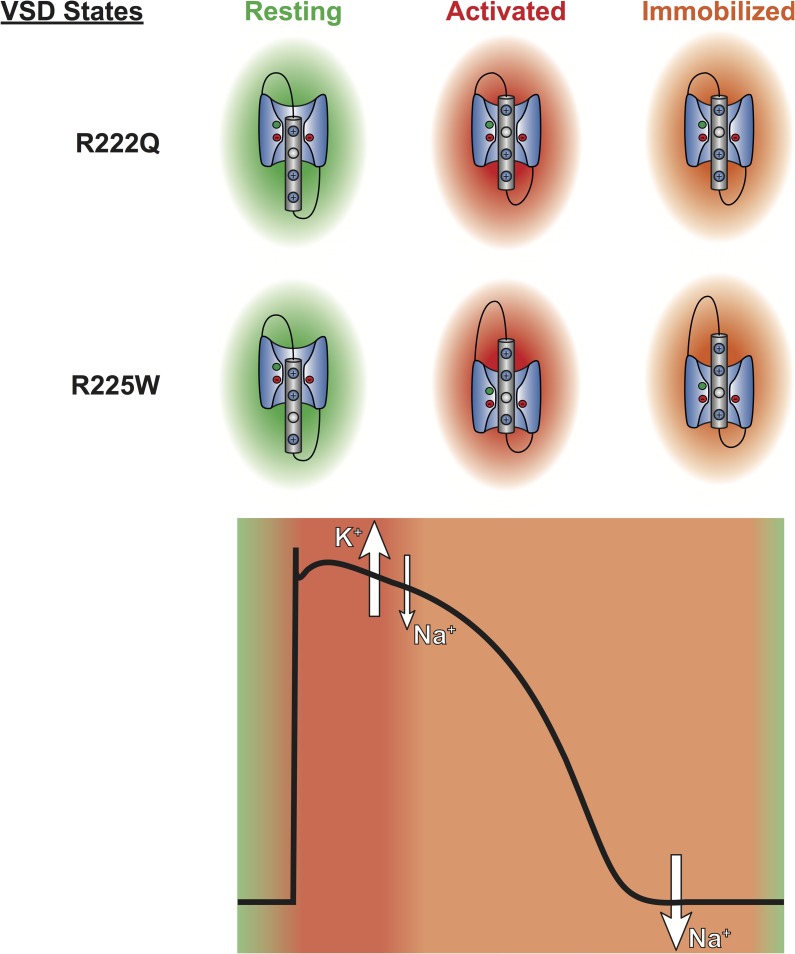
The gating pore current, also called omega current, consists of a cation leak through the typically nonconductive voltage-sensor domain (VSD) of voltage-gated ion channels. Although the study of gating pore currents has refined our knowledge of the structure and the function of voltage-gated ion channels, their implication in cardiac disorders has not been established. Two Na(v)1.5 mutations (R222Q and R225W) located in the VSD are associated with atypical clinical phenotypes involving complex arrhythmias and dilated cardiomyopathy. Using the patch-clamp technique, in silico mutagenesis, and molecular dynamic simulations, we tested the hypothesis that these two mutations may generate gating pore currents, potentially accounting for their clinical phenotypes. Our findings suggest that the gating pore current generated by the R222Q and R225W mutations could constitute the underlying pathological mechanism that links Na(v)1.5 VSD mutations with human cardiac arrhythmias and dilatation of cardiac chambers.


Figures

Figure 1.
Figure 1.
The R222Q residue is highly conserved among ion channels. (A) Schematic 2-D representation of the 24-transmembrane segments of Nav1.5 organized in four homologous domains. The red circles indicate the locations of the R222Q and R225W mutations. (B) The S4 segments of the first domains of the Nav1.5, Nav1.4, and Cav1.1 channels, and the S4 segments of the NavAb and Shaker channels were aligned using CLC sequence viewer 6 (QIAGEN). Positively charge residues (arginines or lysines) are numbered from R0 to R7 and bolded in blue. The R2 and R3 indicated by the red arrow correspond to R222Q and R225W in Nav1.5.
Figure 2.
Figure 2.
Biophysical characterization of the Nav1.5 mutant channels. The results for the Nav1.5 WT channel are indicated by red symbols, those for the R222Q mutant channel by orange symbols, and those for the R225W mutant channel by green symbols. (A) Representative whole-cell current traces of the WT and mutant channels. Currents were elicited using a voltage-clamp protocol where depolarizing pulses were applied for 50 ms from −100 to 80 mV in 5-mV increments (see protocol in inset). (B) Current density–voltage (I-V) relationships of the WT and mutant channels. (C) Histogram summarizing the peak current density of the WT and mutant channels. The R222Q channel displayed a higher peak current density than the WT channel (−285.5 ± 29.4 pA/pF, n = 13, and −186.5 ± 21.0 pA/pF, n = 9, respectively). The R225W mutation reduced the peak current density (−32.3 ± 4.2 pA/pF, n = 11). (D) The maximal global conductance (Gmax) of each cell was normalized to the cell membrane capacitance. No differences were observed between the WT (3.1 ± 0.4 pS/pF, n = 9) and R222Q channels (4.0 ± 0.3 pS/pF, n = 13), indicating that there were a similar number of each type of channel on the cell surface. On the other hand, the normalized conductance was significantly lower for the R225W channel (0.6 ± 0.1 pS/pF, n = 11), indicating that there were fewer R225W channels in the cell membrane. (E) Voltage dependence of steady-state activation of the WT and mutant channels. Activation curves were generated using a standard Boltzmann distribution (G(V)/Gmax = 1/(1 + exp(−(VV1/2)/k))) to give the V1/2 and k values listed in Table 2. (F) Steady-state inactivation of the WT and mutant channels. Inactivation currents were obtained by applying conditioning prepulses to membrane potentials ranging from a holding potential of −140 to −10 mV for 500 ms in 5-mV increments and were then measured using a 4-ms pulse to −30 mV at each step (see protocol in inset). The recorded inactivation values were fitted to a standard Boltzmann equation (I(V)/Imax = 1/(1 + exp((VV1/2)/k)) + C) to give the values listed in Table 1. (G) Recovery from fast inactivation was obtained using a two-pulse protocol at 30 mV to obtain maximal activation (see protocol in inset). The time constants listed in Table 1 were obtained using a two-exponential function: (Afast(1 − exp(−t/τfast)) + Aslow(1 − exp(−t/τslow)) + C). (H) The times to peak of the WT and mutant channels were used to evaluate the activation kinetics. The times to peak were measured on the same current traces used to construct the I-V relationship. (I) The time constants of fast inactivation decay were plotted as a function of voltage for the WT and mutant channels. The time constants were obtained using a simple-exponential function: (Afast(exp(−t/τ) + C). Normalized raw data shown in the inset illustrate the current decay kinetics. Data are expressed as means ± SEM. Differences were considered significant at P < 0.05 (*), < 0.01 (**), or < 0.001 (***).
Figure 3.
Figure 3.
Window currents of the Nav1.5 WT and mutant channels. (A) The overlap between activation and inactivation defines the window current. The predicted window current was obtained using the following equation: (1/(1 + exp((V1/2activation − V)/kactivation))((1 − C)/(1 + exp((V − V1/2inactivation)/kinactivation)) + C). The presence of the mutation increased the predicted window current over 2.3-fold. (B–E) Ramp protocols (see protocol in inset) were imposed (0.64 mV/ms) to study the window current. As predicted in A, the window currents of the mutant channels were higher than that of the WT channel. (B) Ramp current traces normalized to the α peak current. (C) Histogram showing the peak window current normalized to the α peak current (% of peak current). (D) Average traces of ramp currents normalized to cell capacitance to study ramp current density. (E) Peak ramp current density (pA/pF). Data are expressed as means ± SEM. Differences were considered significant at P < 0.05 (*) or < 0.001 (***).
Figure 4.
Figure 4.
The Nav1.5 R222Q and R225W channels conduct gating pore currents. Gating pore currents were recorded using a voltage-step protocol from −100 to 40 mV in 5-mV increments. (A) Examples of raw traces of gating pore currents recorded in Cs+ solutions (solutions 1 and 5 in Table 1). The inward α pore current is not totally shown for WT and R222Q channels. For R225W channels, this current is mingled in the gating pore current traces as a result of lower channel expression. The currents are also plotted as a function of voltage at the bottom of each trace. Linear nonspecific leaks are indicated by dotted lines. (B) Current density–voltage relationships of gating pore currents recorded for the WT, R222Q, and R225W channels in the absence of TTX are shown in closed symbols (n = 8 for R222Q, n = 10 for R225W, and n = 5 for WT channels). The current density–voltage relationships in the presence of 10 µM TTX are shown in open symbols (n = 7 for R222Q and n = 6 for R225W channels). (C) Normalized voltage dependence of gating pore currents caused by R222Q and R225W mutations. Curves were fitted using a standard Boltzmann distribution (Normalized conductance = 1/(1 + exp(−(VV1/2)/k))). (D) Histogram summarizing the gating pore current densities at 40 mV in a Cs+ solution for the WT, R222Q, and R225W channels (0.17 ± 0.09 pA/pF, 6.6 ± 1.0 pA/pF, and 2.7 ± 0.3 pA/pF, n = 5–10). (E) Coupling between the α pore and the gating pore current. Each point represents the α peak current amplitude at −10 mV and the associated gating pore current amplitude at 40 mV. Lines indicate the best linear regression and the associated r2 Data are expressed as means ± SEM. Differences were considered significant at P < 0.001 (***).
Figure 5.
Figure 5.
Gating pore current ionic selectivity. After linear leak subtraction, the gating pore currents were normalized to the cell capacitance and plotted as a function of voltage. The WT channel displayed an almost nonexistent gating pore current of 0.17 ± 0.09 pA/pF (n = 5). The solution used to record gating pore are listed in Table 1 (solutions 1 and 5 for Cs+ condition, solutions 2 and 6 for K+ condition, solutions 3 and 7 for Na+ condition, and solutions 4 and 5 for NMDG+ condition). (A) The normalized gating pore current carried by Cs+ was 6.6 ± 1.0 pA/pF (n = 8), the maximal K+ current was 3.1 ± 0.5 pA/pF (n = 7), and the maximal Na+ current was 1.8 ± 0.3 pA/pF (n = 8) for the R222Q channel. No NMDG+ currents were observed (0.1 ± 0.2 pA/pF, n = 4). (B) The normalized gating pore current carried by Cs+ was 2.7 ± 0.3 pA/pF (n = 10), the maximal K+ current was 1.3 ± 0.1 pA/pF (n = 4), and the maximal Na+ current was 0.87 ± 0.06 pA/pF (n = 5) for the R225W channel. No NMDG+ currents were observed (0.1 ± 0.1 pA/pF, n = 4). (C) Histogram summarizing the relative permeabilities of the gating pore currents. Cs+ was approximately twice as permeant as K+ (2.2 ± 0.3 for the R222Q channel and 2.0 ± 0.2 for the R225W channel). Na+ was less permeant than K+ (0.59 ± 0.08 for the R222Q channel and 0.67 ± 0.05 for the R225W channel). NMDG+ was dramatically less permeant than K+ (0.05 ± 0.06 for R222Q channel and 0.06 ± 0.05 for R225W channel). Data are expressed as means ± SEM.
Figure 6.
Figure 6.
Gating pore current after long depolarizations. (A) Current generated by ramp pulses (see protocols in inset), for R222Q (left), R225W (middle), and WT (right) channels (using solutions 1 and 5 listed in Table 1). The I-V curves were constructed by averaging values of current at each 5 mV. The voltage was calculated using the known time course of the ramp protocol. Thus, for purpose of clarity, the plotted points (mean ± SEM) do not represent steady-state currents, but they represent average current every 5 mV. The linear leak subtraction around −75 to −45 mV was performed to eliminate inherent linear leak. The insets show the currents in response to ramp protocols. Dashed lines indicate the current obtained without 500-ms predepolarization. Solid lines indicate the response after 500-ms predepolarization. (B) Histogram summarizing the inward gating pore current density at −135 mV recorded with or without 500-ms predepolarization. R222Q and R225W exhibit gating pore currents when compared with control ramp protocols without predepolarization (−5.6 ± 1.1 pA/pF, n = 5, for R222Q [*], and −3.3 ± 0.6, n = 3, for R225W [#]). ++, statistical difference between mutant and WT condition (P < 0.01). Data are expressed as means ± SEM. Differences were considered significant at P < 0.05 (*, #) or < 0.01 (++).
Figure 7.
Figure 7.
Structural models of the DI VSDs of the Nav1.5 WT, R222Q, and R225W mutants. Structural models of the relaxed DI VSD of the WT in the γ (A) and β (B) states. (C) Structural model of the relaxed DI VSD of the R222Q mutant in the γ state. (D) Structural model of the relaxed DI VSD of the R225W mutant in the β state. For all the structural models, the VSD protein backbone is represented as a ribbon (left panel, S1 in yellow, S2 in red, S3 in transparent cyan, and S4 in blue). The gating charges of S4 and the counter charges of S2 and S3 are shown as sticks (carbon in gray, nitrogen in blue, and oxygen in red; hydrogens are omitted for clarity). In the middle panel, the water-accessible volume is shown as a transparent cyan surface. For each configuration, a higher magnification of the GCTC (dotted pink box) is shown.
Figure 8.
Figure 8.
The gating pore current generated by R222Q and R225W mutations is permeant in both activated and resting states. The VSD of domain I of mutated Nav1.5 is shown in their resting (green), activated (red), and immobilized (orange) states. These states are represented during the cardiac AP. The gating pore permeation pathway is open during the plateau phase of the AP, leading to an outward K+ leak and an inward Na+ leak. Because of S4 immobilization, the gating pore is also permeant to Na+ at the end of the AP.

References

    1. Amaral C., Carnevale V., Klein M.L., and Treptow W.. 2012. Exploring conformational states of the bacterial voltage-gated sodium channel NavAb via molecular dynamics simulations. Proc. Natl. Acad. Sci. USA. 109:21336–21341 10.1073/pnas.1218087109 - DOI - PMC - PubMed
    1. Amin A.S., Asghari-Roodsari A., and Tan H.L.. 2010. Cardiac sodium channelopathies. Pflugers Arch. 460:223–237 10.1007/s00424-009-0761-0 - DOI - PMC - PubMed
    1. Berger T.K., and Isacoff E.Y.. 2011. The pore of the voltage-gated proton channel. Neuron. 72:991–1000 10.1016/j.neuron.2011.11.014 - DOI - PMC - PubMed
    1. Bezzina C.R., and Remme C.A.. 2008. Dilated cardiomyopathy due to sodium channel dysfunction: What is the connection? Circ Arrhythm Electrophysiol. 1:80–82 10.1161/CIRCEP.108.791434 - DOI - PubMed
    1. Bezzina C.R., Rook M.B., Groenewegen W.A., Herfst L.J., van der Wal A.C., Lam J., Jongsma H.J., Wilde A.A., and Mannens M.M.. 2003. Compound heterozygosity for mutations (W156X and R225W) in SCN5A associated with severe cardiac conduction disturbances and degenerative changes in the conduction system. Circ. Res. 92:159–168 10.1161/01.RES.0000052672.97759.36 - DOI - PubMed

Publication types

MeSH terms

Substances