. 2015 Mar 1;194(5):2380-9.
doi: 10.4049/jimmunol.1401170. Epub 2015 Jan 26.

Constraints contributed by chromatin looping limit recombination targeting during Ig class switch recombination

Affiliations

Constraints contributed by chromatin looping limit recombination targeting during Ig class switch recombination

Scott Feldman et al. J Immunol. .

Abstract

Engagement of promoters with distal elements in long-range looping interactions has been implicated in regulation of Ig class switch recombination (CSR). The principles determining the spatial and regulatory relationships among Igh transcriptional elements remain poorly defined. We examined the chromosome conformation of C region (CH) loci that are targeted for CSR in a cytokine-dependent fashion in mature B lymphocytes. Germline transcription (GLT) of the γ1 and ε CH loci is controlled by two transcription factors, IL-4-inducible STAT6 and LPS-activated NF-κB. We showed that although STAT6 deficiency triggered loss of GLT, deletion of NF-κB p50 abolished both GLT and γ1 locus:enhancer looping. Thus, chromatin looping between CH loci and Igh enhancers is independent of GLT production and STAT6, whereas the establishment and maintenance of these chromatin contacts requires NF-κB p50. Comparative analysis of the endogenous γ1 locus and a knock-in heterologous promoter in mice identified the promoter per se as the interactive looping element and showed that transcription elongation is dispensable for promoter/enhancer interactions. Interposition of the LPS-responsive heterologous promoter between the LPS-inducible γ3 and γ2b loci altered GLT expression and essentially abolished direct IgG2b switching while maintaining a sequential μ→γ3→γ2b format. Our study provides evidence that promoter/enhancer looping interactions can introduce negative constraints on distal promoters and affect their ability to engage in germline transcription and determine CSR targeting.


Figures

Figure 1
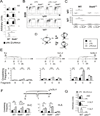
Figure 1. NFκB but not transcription is required for γ1:3’Eα and Eμ:3’Eα looping
Resting B cells from WT, Stat6−/− or NFκB p50−/− mice were stimulated with LPS or LPS and IL4lo (10 ng/ml), for 40 hours (RT-PCR, 3C assays) or 4 days (FACS). A) Q-RT-PCR assays for GLT g3, g2b and g1 and AID were normalized to the 18S rRNA gene transcript using two to four samples from two to four independent experiments. B) FACS analyses of B cells stained with anti-IgG1 or anti-IgG3 in combination with anti-B220. Numbers indicate percentage of switched cells. C) Average percentage of IgG3 (top) or IgG1 (bottom) from FACS analyses of LPS or LPS+IL4lo activated B cells. Each symbol represents a single mouse and the line indicates the average. D) Schematic for long range chromatin looping interactions for LPS activated WT B cells in which Eμ:3’Eα interacts with γ3 (a) or γ2b (b) loci. E) HindIII restriction fragments used in the 3C analysis are indicated (fragments A-D,G,H). 3C assays were anchored at Eμ (fragment A), hs1,2 (fragment G) or hs3b,4 (fragment H) were analyzed for interaction with I-S-CH loci (fragments B, C, D). Two-tailed Students t test p values of 0.05 and 0.001 or less are indicated by * and **, respectively. F) 3C assays anchored at hs3b,4 (fragment H) interrogated interactions with the γ1 (C fragment) or Eμ (A fragment) as indicated. G) Q-RT-PCR assays for GLT g3, and g1 and AID from WT or NFkB p50−/− B cells activated with LPS or LPS+IL4 as indicated. Q-RT-PCR assays were normalized to the 18S rRNA gene transcript using two to four samples from two to four independent experiments.
Figure 2
Figure 2. The γ1hMT/hMT locus perturbs γ2b and ε GLT expression
Resting B cells from WT or IgHhMT/ hMT mice were stimulated with LPS or LPS and IL4lo (10 ng/ml) or IL4hi (20 ng/ml) for 40 hours or as indicated. Two-tailed Students t test p values of ≤ 0.05 or 0.001 are indicated by (*) and (**), respectively. A) GLT g3, g2b, g1 and ε and AID expression were analyzed by qRT-PCR and signals were normalized to the 18S rRNA gene transcript using two to five samples from two to three independent experiments. B) FACS analyses of B cells stained with anti-IgG1 in combination with anti-B220. Numbers indicate percentage of switched cells. C) Average percentage of IgG3 (top) or IgG1 (bottom) from FACS analyses of LPS or LPS+IL4 activated B cells, as indicated. Each symbol represents a single mouse and the line indicates the average.
Figure 3
Figure 3. Igh enhancers contact the γ1 GLT Pr in the absence of GLT production
Resting WT or IgHhMT/ hMT B cells were activated with LPS or LPS+IL4lo for 40 hours then analyzed in 3C, 3D DNA FISH or ChIP assays as indicated. A) Schematic for long range looping interactions in LPS activated WT or IgHhMT/hMT B cells in which Eμ:3’Eα interacts with γ3 (a), γ2b (b) or γhMT/hMT (c) loci. B–D) In 3C assays two to three 3C chromatin samples from at least two independent experiments were analyzed. B) Schematic showing HindIII restriction fragments (B,C,D) analyzed with anchor hs3b,4 (fragment H) (upper panel). 3C assays (lower panel). C) 3C HindIII restriction fragments (C,H) analyzed with anchor γ3 (fragment B) or Eμ (fragment A) (upper panel). 3C assays (lower panel). D) 3C HindIII restriction fragments (A,H) analyzed with anchor Eμ (fragment A) or hs3b,4Eμ (fragment H) (upper panel). 3C assays (lower panel). E) A 220 kb segment of the Igh locus (top). 3D DNA FISH probes h4 (green) (27), Eμ5 (red) (13) and BAC210H14 (blue) (Top panel). High resolution three color 3D-DNA FISH with WT splenic B cells. Probes were labeled with Alexa Fluor 594 (red) and 488 (green) and BAC RP23-201H14 was labeled with Alexa Fluor 697 (blue) and hybridized with fixed splenic B cells. Signals were visualized by epifluorescence microscopy and distances between probes were determined as described (13, 27). B cells were purified from two mice (Middle panel). Quantitation of FISH data is shown (Bottom panel). Distances between red and green FISH signals were divided into two categories (<0.2 µm, 0.2 – 0.5 µm) for ~100 nuclei. The probes h4 (green) and Eμ5 (red) correspond to hs3b,4 and Eμ, respectively. The percentage of Igh alleles in each group (y axis) was determined for each activation condition (x axis) and are displayed in different colors. P values of less than 0.0001 are indicated ***. F) ChIP assays were performed on nuclei from four to six samples derived from two independent experiments using anti-H3K9Ac or anti-H3K4me3 antibodies. All samples were analyzed in duplicate then averaged and SEM are shown. Histone modifications and primer pairs tested are indicated. The qPCR product concentration relative to 10% input and indicates the enrichment of a sequence following immunoprecipitation.
Figure 4
Figure 4. GLT γ1hMT/hMT Pr alters the balance between direct and sequential CSR
Resting B cells from three WT and three IgHhMT/hMT mice were independently stimulated with LPS or LPS and IL4lo for 42 hours (DC-PCR, CT assays) or 4 days (FACS). A) Diagram depicting direct μ->γ2b (above the line) or sequential μ->γ3->γ2b (below the line) CSR. B) FACS analyses of B cells stained with anti-IgG2b in combination with anti-B220. Numbers indicate percentage of switched cells. C) Average percentage of IgG2b from FACS analyses of LPS or LPS+IL4lo activated B cells, as indicated. Each symbol represents a single mouse and the line indicates the average. D) Circle transcript (CT) assays measure hybrid Ig2b-Cμ transcripts which arise from excised circular DNA generated by direct μ->γ2b CSR and are detected using a forward primer in Iγ2b together with a reverse primer in Cμ in qRT-PCR and normalized to the 18S rRNA gene transcript using 6 samples from three independent experiments. E) CT Ig2b-Cγ3 switching are detected using a forward primer in Iγ2b together with a reverse primer in Cγ3 indicating sequential CSR by qRT-PCR and signals were normalized to the 18S rRNA gene transcript using 6 samples from three independent experiments. F) Schematic of the DC-PCR assay with nested PCR primers and Eco RI (RI) sites indicated by the arrows and filled circles, respectively (upper panel) are compared to the nAChR gene used as a loading control. Representative gel images for the semi-quantitative DC-PCR assays (lower panel). PCR products were harvested in the second round at 26 (lanes 1,4,7,10), 29 (lanes 2,5,8,11), and 32 cycles (lanes 3,6,9,12). G) CT assays measure hybrid Iε-Cμ transcripts which are detected using a forward primer in Iε with a reverse primer in Cμ using semi-quantitative RT-PCR are compared to the Hprt loading control.

References

    1. Schatz DG, Ji Y. Recombination centres and the orchestration of V(D)J recombination. Nature reviews. Immunology. 2011;11:251–263. - PubMed
    1. Kenter AL. AID targeting is dependent on RNA polymerase II pausing. Semin Immunol. 2012;24:281–286. - PMC - PubMed
    1. Chaudhuri J, Basu U, Zarrin A, Yan C, Franco S, Perlot T, Vuong B, Wang J, Phan RT, Datta A, Manis J, Alt FW. Evolution of the immunoglobulin heavy chain class switch recombination mechanism. Adv Immunol. 2007;94:157–214. - PubMed
    1. Sanyal A, Lajoie BR, Jain G, Dekker J. The long-range interaction landscape of gene promoters. Nature. 2012;489:109–113. - PMC - PubMed
    1. Sellars M, Reina-San-Martin B, Kastner P, Chan S. Ikaros controls isotype selection during immunoglobulin class switch recombination. J Exp Med. 2009;206:1073–1087. - PMC - PubMed

Publication types

MeSH terms