. 2015 Feb 10;112(6):E586-95.
doi: 10.1073/pnas.1406549111. Epub 2015 Jan 26.

Therapeutic mechanisms of high-frequency stimulation in Parkinson's disease and neural restoration via loop-based reinforcement

Affiliations

Therapeutic mechanisms of high-frequency stimulation in Parkinson's disease and neural restoration via loop-based reinforcement

Sabato Santaniello et al. Proc Natl Acad Sci U S A. .

Abstract

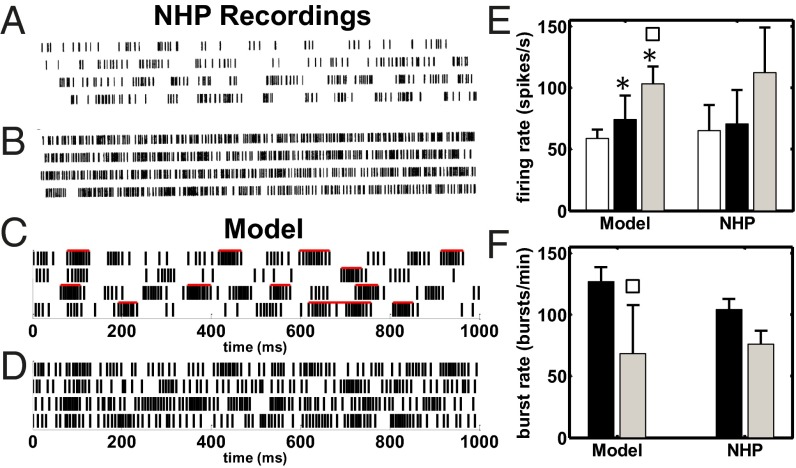
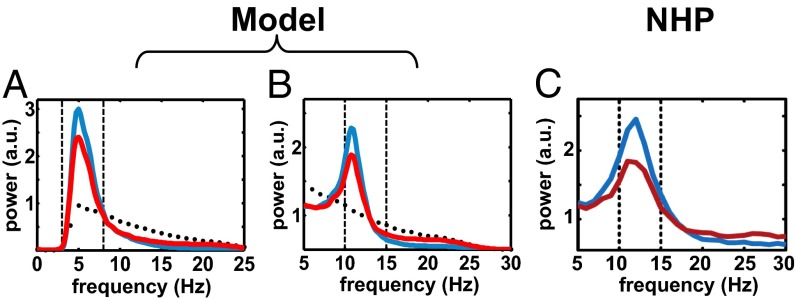
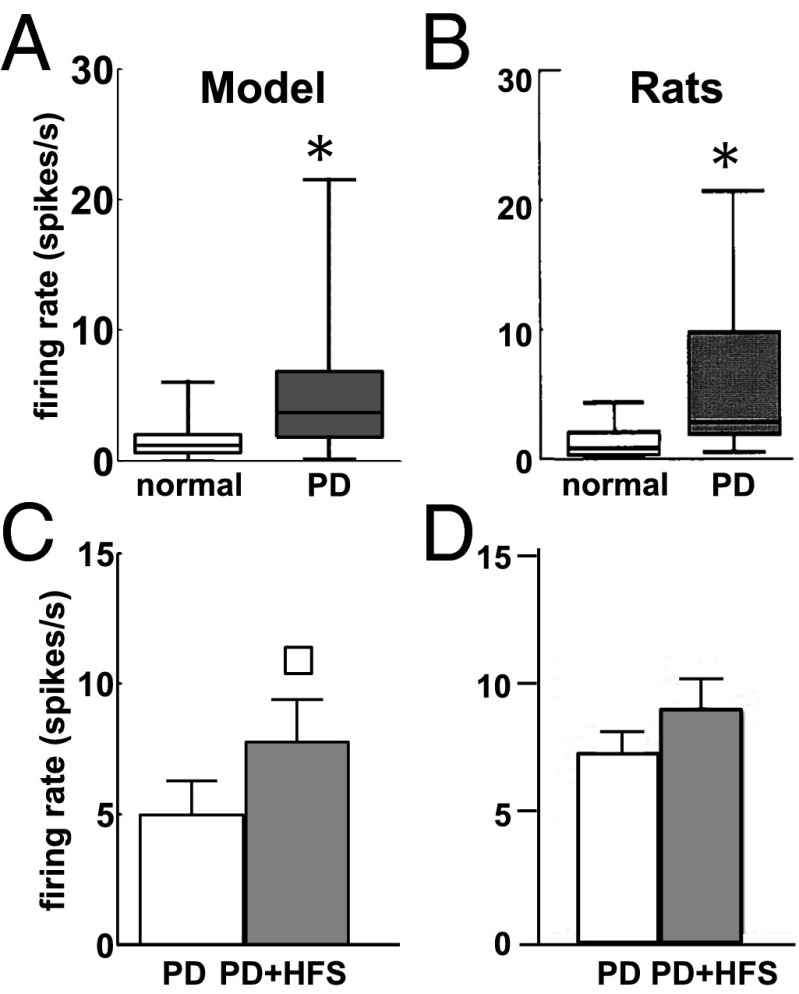
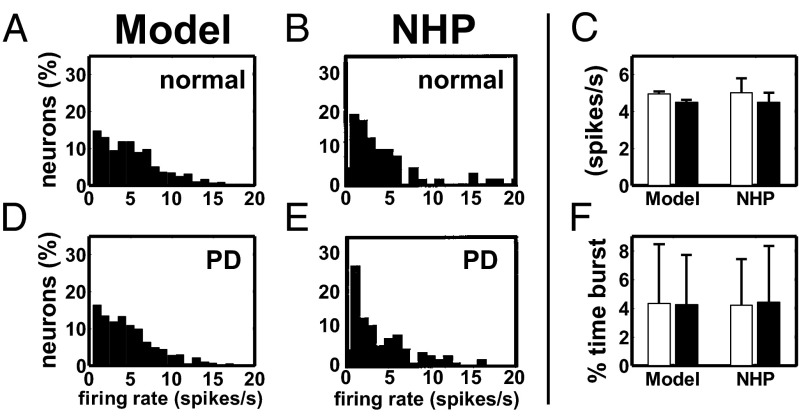
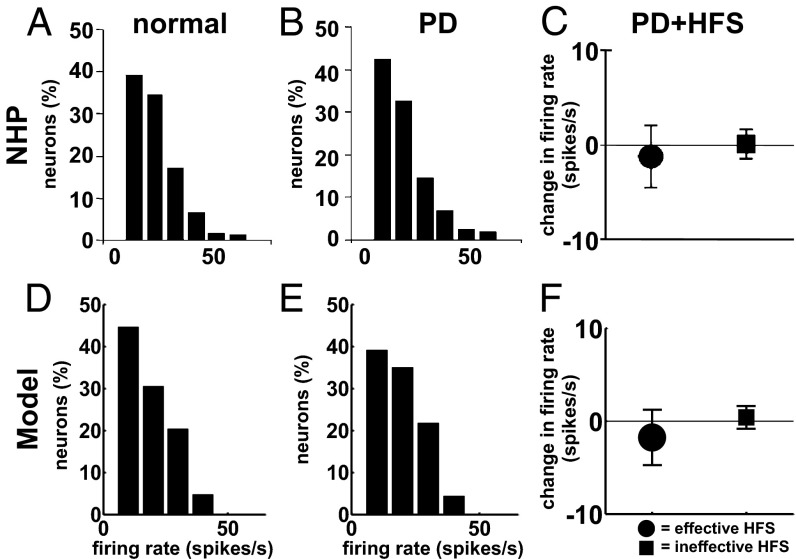
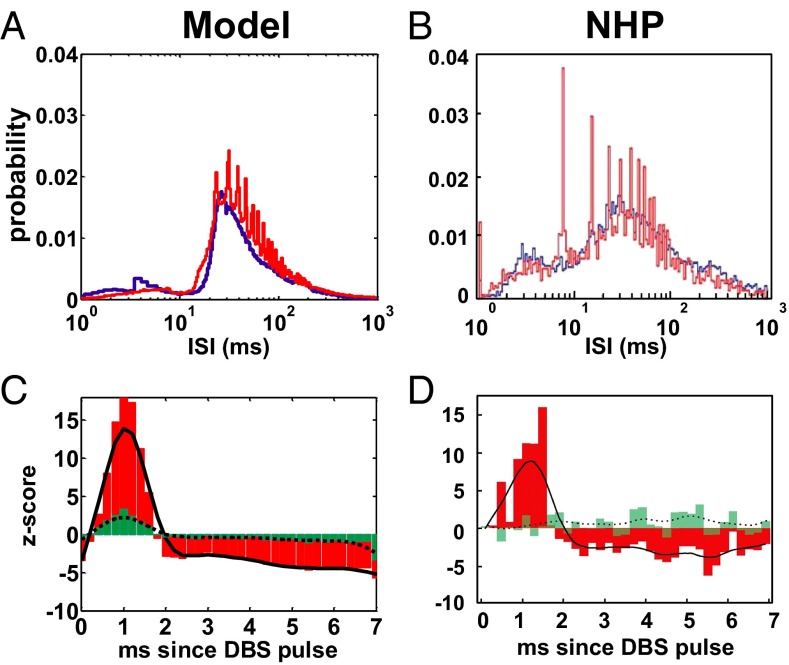
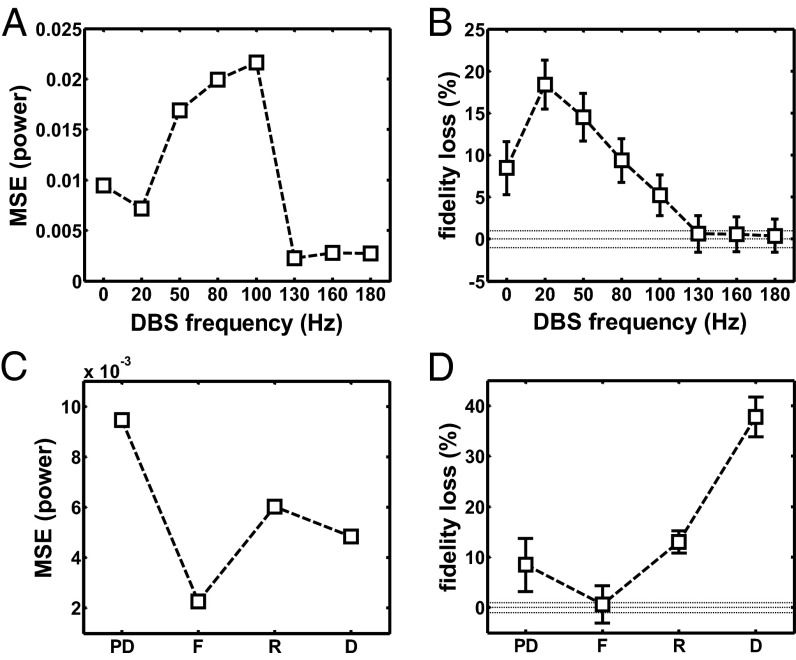
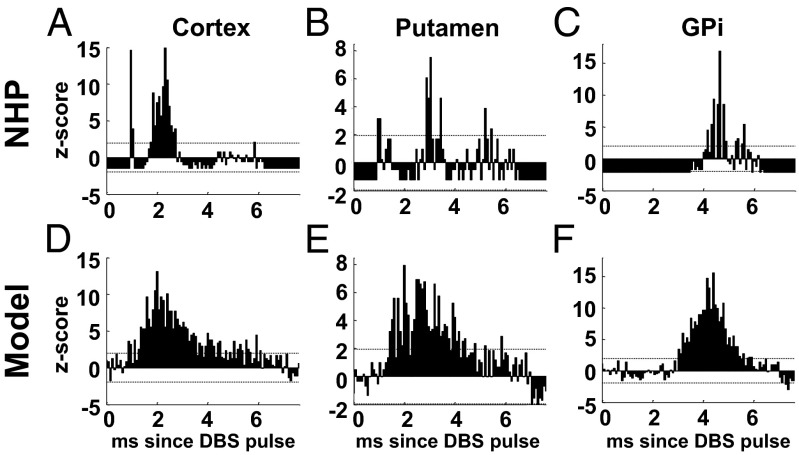
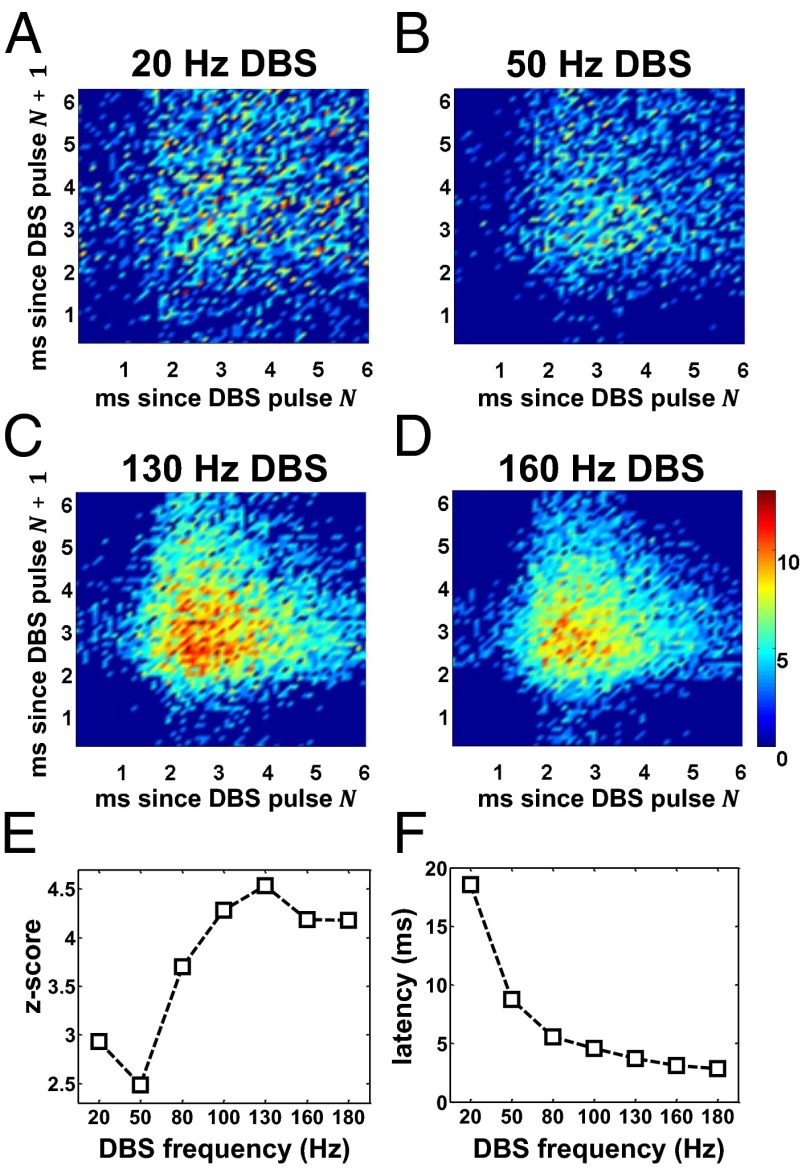
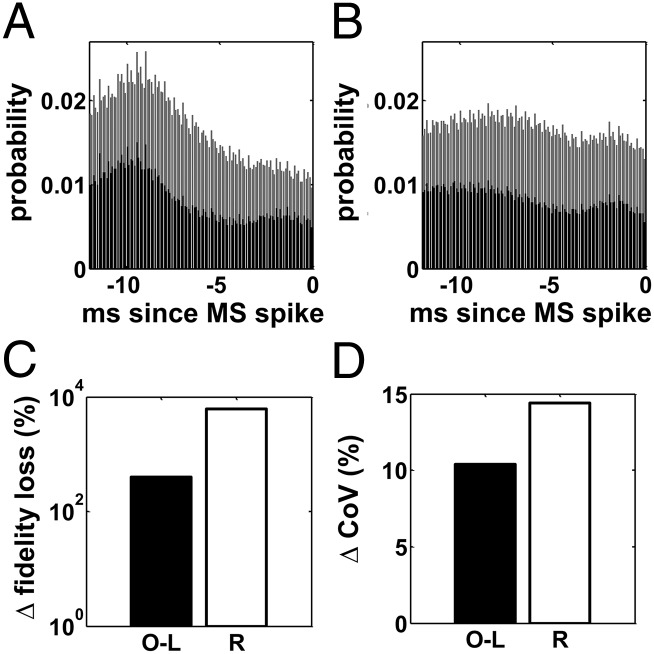
High-frequency deep brain stimulation (HFS) is clinically recognized to treat parkinsonian movement disorders, but its mechanisms remain elusive. Current hypotheses suggest that the therapeutic merit of HFS stems from increasing the regularity of the firing patterns in the basal ganglia (BG). Although this is consistent with experiments in humans and animal models of Parkinsonism, it is unclear how the pattern regularization would originate from HFS. To address this question, we built a computational model of the cortico-BG-thalamo-cortical loop in normal and parkinsonian conditions. We simulated the effects of subthalamic deep brain stimulation both proximally to the stimulation site and distally through orthodromic and antidromic mechanisms for several stimulation frequencies (20-180 Hz) and, correspondingly, we studied the evolution of the firing patterns in the loop. The model closely reproduced experimental evidence for each structure in the loop and showed that neither the proximal effects nor the distal effects individually account for the observed pattern changes, whereas the combined impact of these effects increases with the stimulation frequency and becomes significant for HFS. Perturbations evoked proximally and distally propagate along the loop, rendezvous in the striatum, and, for HFS, positively overlap (reinforcement), thus causing larger poststimulus activation and more regular patterns in striatum. Reinforcement is maximal for the clinically relevant 130-Hz stimulation and restores a more normal activity in the nuclei downstream. These results suggest that reinforcement may be pivotal to achieve pattern regularization and restore the neural activity in the nuclei downstream and may stem from frequency-selective resonant properties of the loop.

Keywords: Parkinson’s disease; basal ganglia; deep brain stimulation; reinforcement; thalamus.


Conflict of interest statement

The authors declare no conflict of interest.

Figures

Fig. 1.
Fig. 1.
(AD) Raster plot of a GPi neuron under PD conditions at rest (A and C) and with STN HFS (B and D). A and B are from an MPTP-treated NHP (modified with permission from ref. 17). C and D are from a pallidal neuron in our model. Red bars in C denote estimated bursts. (E) Population-average firing rate (mean ± SD) of the GPi neurons under normal (white), PD (black), and PD with STN HFS (PD+HFS, gray) conditions in our model and NHPs. (F) Population-average burst rate (mean ± SD) of the GPi neurons under PD (black) and PD+HFS (gray) conditions in our model and NHPs. Population-average burst rate of the GPi under normal condition is 20.9 ± 4.7 bursts per minute (mean ± SD). Rates for NHPs in E and F are reported in refs. and and ref. , respectively. Asterisks (squares) show significant differences normal vs. PD and PD+HFS (PD vs. PD+HFS), one-way ANOVA with Tukey–Kramer post hoc test, P<0.001. HFS is 136 Hz in the NHPs (B, E, and F) and 130 Hz in our model (DF).
Fig. 2.
Fig. 2.
(A and B) Population-average normalized power spectrum density (PSD) of tremor-band-oscillatory (A) and beta-band-oscillatory (B) GPi neurons in our model under normal (black dots), PD (blue line), and PD+HFS (red line) conditions. (C) Population-average normalized PSD of beta-band-oscillatory GPi neurons from a NHP under PD (blue line) and PD+HFS (red line) conditions. HFS is 130 Hz in A and B and 125 Hz in C. C is modified with permission from ref. .
Fig. 3.
Fig. 3.
(A and B) Box plots of the firing rate of MSNs in our model (A) and in Sprague–Dawley rats (B) under normal (white) and PD (gray) conditions. In each box plot, the median value (black line), 25th and 75th percentiles (bar limits), and 10th and 90th percentiles (error bars) are shown. (C and D) Population-average firing rate (mean±SD) of the MSNs in our model (C) and Sprague–Dawley rats (D) under PD conditions (white) and PD with 130-Hz STN DBS (PD+HFS, gray). Asterisks in A and B and square in C denote significant differences (Wilcoxon rank-sum test, P<0.001). B and D are modified with permission from refs. and , respectively.
Fig. 4.
Fig. 4.
Histograms of single unit mean firing rates under normal (A and B) and PD (D and E) conditions for the PYNs in our model (A and D) and in the M1 cortex of a NHP (B and E). (C) Population-average firing rate (mean±SEM) of the PYNs in normal (white) and PD (black) conditions in our model and in the M1 cortex of an NHP. (F) Population-average percentage of time (mean±SD) spent by PYNs in bursts in our model and in the M1 cortex of an NHP. Data for NHPs in C and F are reported in refs. (animal Z) and , respectively. Histograms in B and E are modified with permission from ref. .
Fig. 5.
Fig. 5.
Firing rate of TCNs in the ventrolateral thalamus of NHPs (AC) and in our model (DF) under normal, PD, and PD with STN HFS (PD+HFS) conditions. (A, B, D, and E) Histograms of mean firing rates under normal (A and D) and PD (B and E) conditions at rest. (C and F) Population-average (mean±SD) variation of the firing rate of the TCNs at the transition from PD to PD+HFS conditions when the amplitude of the DBS pulses is therapeutically effective (circles) or ineffective (squares) (SI Note 3). STN HFS is 136 Hz in C and 130 Hz in F. A and B are modified with permission from ref. , and C is modified with permission from ref. .
Fig. 6.
Fig. 6.
(A and B) ISI histogram of the TCNs in our model under PD conditions (A) and in a MPTP-treated NHP (B) at rest (i.e., no DBS applied, blue lines) and under effective STN HFS (red lines). (C and D) Population-averaged PSTH of the TCNs in A (C) and B (D), respectively, for effective STN HFS. HFS is 130 Hz in A and C and 136 Hz in B and D. Red bars and black line in C and D indicate the PSTH (bin: 0.2 ms) and its envelope (i.e., a smoothing running average of the PSTH), respectively, for effective HFS. Green bars and dotted line in C and D indicate the PSTH and its envelope, respectively, for ineffective HFS. Definition of “effective” and “ineffective” HFS is in ref. . B and D are reproduced with permission from ref. .
Fig. 7.
Fig. 7.
(A) MSE in the band [3, 100] Hz between the population-average power spectrum density of the TCNs in normal and PD conditions with regular DBS vs. the DBS frequency. (B) Population-average loss in fidelity (mean±SEM) of the TCNs over the value in normal conditions due to PD and regular STN DBS at several frequencies. In A and B, 0-Hz DBS means no DBS. The definition of loss in fidelity is in SI Note 4. (C and D) MSE in the band [3, 100] Hz (C) and average loss in fidelity (D) (mean ± SEM) of the TCNs over the value for the normal case due to PD conditions and various DBS settings. Dotted lines in B and D indicate the reference value (i.e., no increment) and 99% confidence bounds. Settings: D, PD conditions and regular 130-Hz STN DBS applied (only orthodromic effects on GPi); F, PD conditions and regular 130-Hz STN DBS applied (antidromic and orthodromic effects included); PD, PD conditions and no DBS; R, PD conditions and irregular 130-Hz STN DBS applied.
Fig. 8.
Fig. 8.
PSTH (bin size: 0.08 ms) of a PYN (A and D), an MSN (B and E), and a PAN (C and F) from an MPTP-treated NHP (AC) and in our model (DF) under PD conditions and 130-Hz STN DBS. Dotted lines in AF denote 95% confidence bounds. The single unit recordings used to compute the histograms in AC are from M1 cortex, putamen, and GPi and were part of the dataset analyzed in refs. , , and , respectively.
Fig. 9.
Fig. 9.
(AD) Population-average bi-PSTH (time bin: 0.1 ms) of the MSNs under PD conditions when regular STN DBS at 20 Hz (A), 50 Hz (B), 130 Hz (C), and 160 Hz (D) is applied. (E) Average z-score of the bi-PSTH of the MSNs over all of the pairs of latencies (x,y), with 1<x<5.3 ms and 1<y<5.3 ms, estimated for several DBS frequencies under PD conditions. (F) Population-average latency of the first poststimulus spike of the MSNs under PD conditions and STN DBS at several frequencies. Color scale in D also applies to AC and indicates the z-score for each combination of poststimulus latencies. Only the z-scores above 2.58 (i.e., P<0.01) are plotted.
Fig. 10.
Fig. 10.
(A and B) Population-average time histogram (time bin: 0.1 ms) of the TCNs (black) and PYNs (gray) projecting onto MSNs in the 12 ms preceding a spike of the target MSN (0 ms is when the spike arrives) under PD conditions when regular (A) and irregular (B) 130-Hz STN DBS is applied. (C) Change of average loss in fidelity of the TCNs at the transition from settings F to O-L and R, respectively. (D) Change of population-averaged coefficient of variation (CoV) of the PANs at the transition from settings F to O-L and R, respectively. Settings: F, PD conditions and regular 130-Hz STN DBS applied (as in Fig. 7); O-L, PD conditions and regular 130-Hz STN DBS applied, with the effects of the MSNs on the PANs blocked and replaced by a surrogate input (open-loop simulation); R, PD conditions and irregular 130-Hz STN DBS applied.

References

    1. The Deep-Brain Stimulation for Parkinson’s Disease Study Group Deep-brain stimulation of the subthalamic nucleus or the pars interna of the globus pallidus in Parkinson’s disease. N Engl J Med. 2001;345(13):956–963. - PubMed
    1. Durif F, Lemaire JJ, Debilly B, Dordain G. Long-term follow-up of globus pallidus chronic stimulation in advanced Parkinson’s disease. Mov Disord. 2002;17(4):803–807. - PubMed
    1. Rodriguez-Oroz MC, et al. Bilateral deep brain stimulation in Parkinson’s disease: A multicentre study with 4 years follow-up. Brain. 2005;128(Pt 10):2240–2249. - PubMed
    1. Moro E, et al. Long-term results of a multicenter study on subthalamic and pallidal stimulation in Parkinson’s disease. Mov Disord. 2010;25(5):578–586. - PubMed
    1. Montgomery EB, Jr, Gale JT. Mechanisms of action of deep brain stimulation (DBS) Neurosci Biobehav Rev. 2008;32(3):388–407. - PubMed

Publication types