. 2012 Sep 5;7(25):1947-53.
doi: 10.3969/j.issn.1673-5374.2012.25.004.

Temporal dynamic changes of connexin 43 expression in C6 cells following lipopolysaccharide stimulation

Affiliations

Temporal dynamic changes of connexin 43 expression in C6 cells following lipopolysaccharide stimulation

Ling Liu et al. Neural Regen Res. .

Abstract

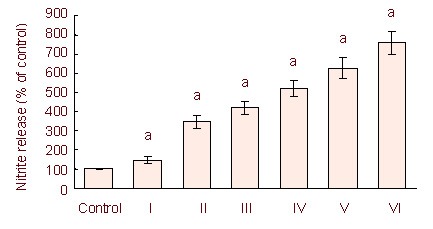
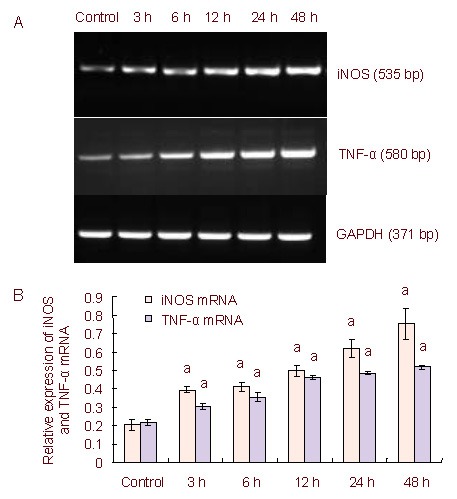
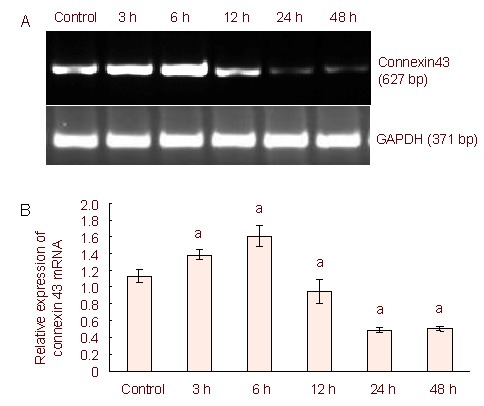
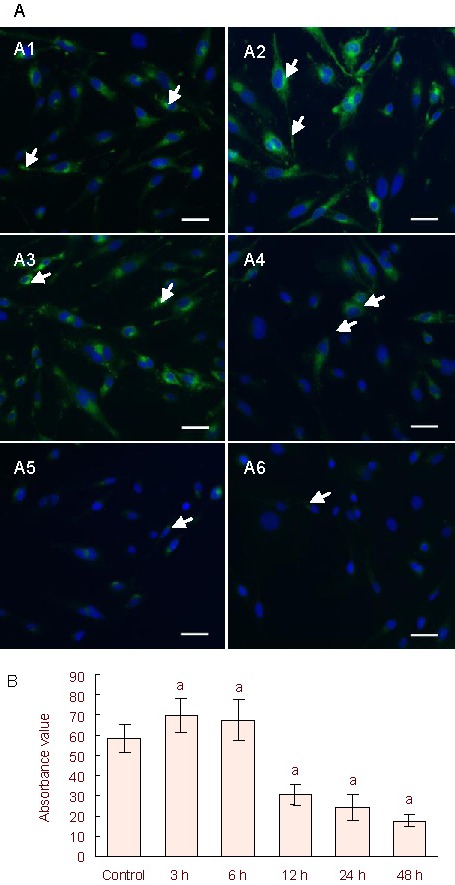
Connexin 43, a gap junction protein, is expressed mainly in glia in the central nervous system. Neuroinflammation plays an important role in central nervous system injury. Changes to glial connexin 43 levels and neuroinflammation may trigger brain injury and neurodegenerative diseases. To illustrate the relationship between connexin 43 and neuroinflammation, this study investigated how connexin 43 expression levels change in lipopolysaccharide-stimulated rat C6 glioma cells. C6 cells were treated with 0.05, 0.25, 0.5, 1, 2.5 and 5 μg/mL lipopolysaccharide for 24 hours. The nitrite estimation-detected nitric oxide release level was elevated substantially after lipopolysaccharide stimulation. To test the transcriptional level changes of inducible nitric oxide synthase, tumor necrosis factor-α and connexin 43 mRNA, C6 cells were treated with 5 μg/mL lipopolysaccharide for 3-48 hours. Reverse transcription-PCR showed that the expression of inducible nitric oxide synthase and tumor necrosis factor-α mRNA increased over time, but connexin 43 mRNA levels increased in lipopolysaccharide-stimulated C6 cells at 3 and 6 hours, and then decreased from 12 to 48 hours. Connexin 43 protein expression was detected by immunofluorescence staining, and the protein levels matched the mRNA expression levels. These results suggest that connexin 43 expression is biphasic in lipopolysaccharide-induced neuroinflammation in C6 cells, which may be correlated with the connexin 43 compensatory mechanism.

Keywords: C6 cells; central nervous system; connexin; inducible nitric oxide synthase; lipopolysaccharide; neural regeneration; neuroinflammation; tumor necrosis factor-α.


Conflict of interest statement

Conflicts of interest: None declared.

Figures

Figure 1
Figure 1
Lipopolysaccharide stimulation for 24 hours induced a dose-dependent release of nitrite in C6 cells. Independent sample t- test and one-way analysis of variance were used to analyze the data. aP < 0.05, vs. control group. Histograms represent the mean ± SD of three independent experiments (n = 3). I–VI: 50, 250, 1 000, 2 500, and 5 000 ng/mL lipopolysaccharide treatment.
Figure 2
Figure 2
Inducible nitric oxide synthase (iNOS) and tumor necrosis factor-α (TNF-α) mRNA expression in lipopolysaccharide-stimulated C6 cells over time. (A) Reverse transcription-PCR iNOS and TNF-α mRNA expression levels in lipopolysaccharide-induced C6 cells. Lane 1: Control; lane 2: 3 hours; lane 3: 6 hours; lane 4: 12 hours; lane 5: 24 hours; lane 6: 48 hours. (B) Quantification of iNOS and TNF-α mRNA expression. The data are expressed as mean ± SD of the band absorbance ratio of the target gene to GAPDH, and analyzed by one-way analysis of variance and the least significant difference method. The experiments were repeated at least three times (n = 3). Independent sample t-tests and one-way analysis of variance were used to analyze the data. aP < 0.05, vs. control group. 3, 6, 12, 24, 48 h: After 3, 6, 12, 24, 48 hours of lipopolysaccharide treatment.
Figure 3
Figure 3
Connexin 43 mRNA expression in lipopolysaccharide-stimulated C6 cells using reverse transcription-PCR. (A) Reverse transcription-PCR connexin 43 mRNA expression levels in lipopolysaccharide-induced C6 cells. Connexin 43 mRNA expression increased at 3 and 6 hours compared with the control group, but then decreased at the 12, 24, and 48 hour time points compared with the control group. (B) Quantification of connexin 43 mRNA expression. The data were expressed as mean ± SD of the band absorbance ratio of the target gene to GAPDH, and analyzed by one-way analysis of variance and the least significant difference method. The experiments were repeated at least three times (n = 3). Independent sample t- tests and one-way analysis of variance were used to analyze the data. aP < 0.05, vs. control group. 3, 6, 12, 24, 48 h: After 3, 6, 12, 24, 48 hours of lipopolysaccharide treatment.
Figure 4
Figure 4
Connexin 43 protein expression in C6 cells. (A) Immunofluorescence staining detected connexin 43 protein expression in lipopolysaccharide-treated C6 cells. The nuclei were stained blue using 4’, 6-diamidino- 2-phenylindole. (A1) Control group: connexin 43 expression (fluorescein isothiocyanate, green) was detected in the cytoplasm and protrusions (arrows). (A2–A6) 5 μg/mL lipopolysaccharide-treated groups (for 3, 6, 12, 24, and 48 hours), with arrows showing connexin 43 protein expression. Scale bars: 25 μm. (B) Semi-quantification of immunofluorescence staining. Six non-overlapping fields were randomly selected and measured for absorbance values using ImageJ for each group. The experiments were repeated three independent times. Independent sample t-tests and one-way analysis of variance were used to analyze the data. aP < 0.05, vs. control group. 3, 6, 12, 24, 48 h: After 3, 6, 12, 24, 48 hours of lipopolysaccharide treatment.

References

    1. Sohl G, Willecke K. An update on connexin genes and their nomenclature in mouse and man. Cell Commun Adhes. 2003;10(4-6):173–180. - PubMed
    1. Yeager M, Harris AL. Gap junction channel structure in the early 21st century: Facts and fantasies. Curr Opin Cell Biol. 2007;19(5):521–528. - PMC - PubMed
    1. Rose CR, Ransom BR. Gap junctions equalize intracellular Na+ concentration in astrocytes. Glia. 1997;20(4):299–307. - PubMed
    1. Harris AL. Connexin channel permeability to cytoplasmic molecules. Prog Biophys Mol Biol. 2007;94(1-2):120–143. - PMC - PubMed
    1. Rouach N, Koulakoff A, Abudara V, et al. Astroglial metabolic networks sustain hippocampal synaptic transmission. Science. 2008;322(5907):1551–1555. - PubMed