

The sweet spot: FDG and other 2-carbon glucose analogs for multi-modal metabolic imaging of tumor metabolism
- PMID: 25625022
- PMCID: PMC4299774
The sweet spot: FDG and other 2-carbon glucose analogs for multi-modal metabolic imaging of tumor metabolism
Abstract
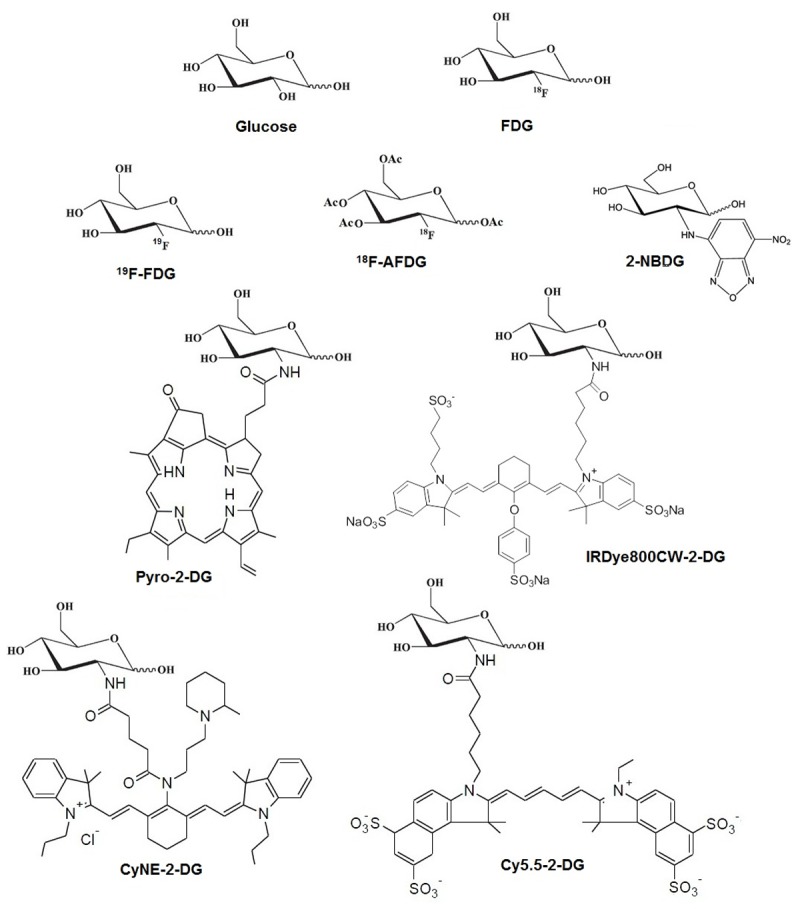
Multi-modal imaging approaches of tumor metabolism that provide improved specificity, physiological relevance and spatial resolution would improve diagnosing of tumors and evaluation of tumor progression. Currently, the molecular probe FDG, glucose fluorinated with (18)F at the 2-carbon, is the primary metabolic approach for clinical diagnostics with PET imaging. However, PET lacks the resolution necessary to yield intratumoral distributions of deoxyglucose, on the cellular level. Multi-modal imaging could elucidate this problem, but requires the development of new glucose analogs that are better suited for other imaging modalities. Several such analogs have been created and are reviewed here. Also reviewed are several multi-modal imaging studies that have been performed that attempt to shed light on the cellular distribution of glucose analogs within tumors. Some of these studies are performed in vitro, while others are performed in vivo, in an animal model. The results from these studies introduce a visualization gap between the in vitro and in vivo studies that, if solved, could enable the early detection of tumors, the high resolution monitoring of tumors during treatment, and the greater accuracy in assessment of different imaging agents.
Keywords: FDG; FDG-PET; Glucose; deoxyglucose; glucose uptake; multi-modal imaging.
Figures


References
-
- Hanahan D, Weinberg RA. Hallmarks of cancer: the next generation. Cell. 2011;144:646–674. - PubMed
-
- Pacák J, Točík Z, Černý M. Synthesis of 2-deoxy-2-fluoro-D-glucose. J Chem Soc D. 1969:77–77.
-
- Metter EJ, Wasterlain CG, Kuhl DE, Hanson WR, Phelps ME. FDG positron emission computed tomography in a study of aphasia. Ann Neurol. 1981;10:173–183. - PubMed
-
- Phelps ME. Positron computed tomography studies of cerebral glucose metabolism in man: theory and application in nuclear medicine. Semin Nucl Med. 1981;11:32–49. - PubMed
-
- Phelps ME, Huang SC, Hoffman EJ, Selin C, Sokoloff L, Kuhl DE. Tomographic measurement of local cerebral glucose metabolic rate in humans with (F-18)2-fluoro-2-deoxy-D-glucose: validation of method. Ann Neurol. 1979;6:371–388. - PubMed
Publication types
LinkOut - more resources
Full Text Sources
Other Literature Sources
Miscellaneous