. 2015 Mar 3;87(5):2988-95.
doi: 10.1021/ac504613b. Epub 2015 Feb 12.

Node-pore sensing enables label-free surface-marker profiling of single cells

Affiliations

Node-pore sensing enables label-free surface-marker profiling of single cells

Karthik R Balakrishnan et al. Anal Chem. .

Abstract

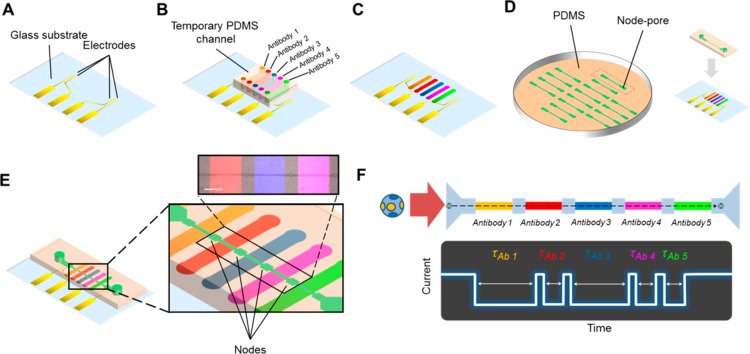
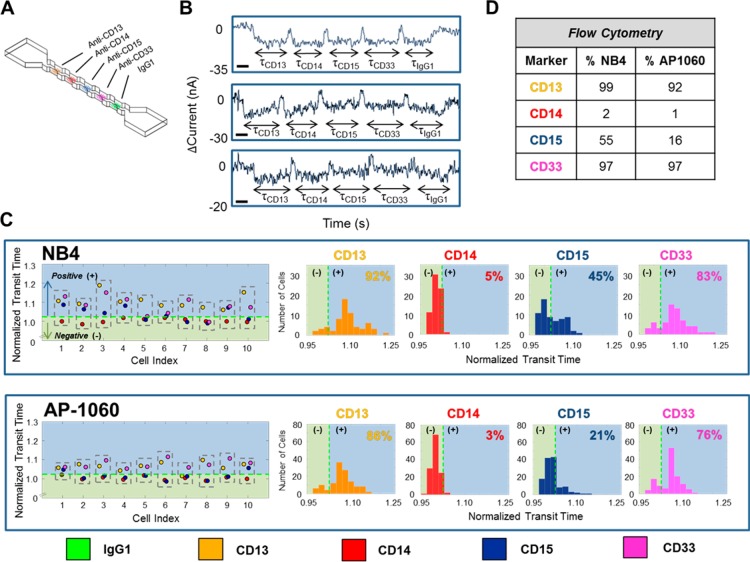
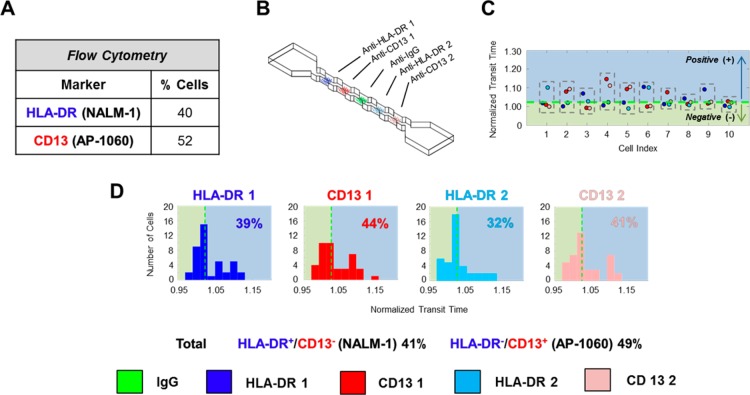
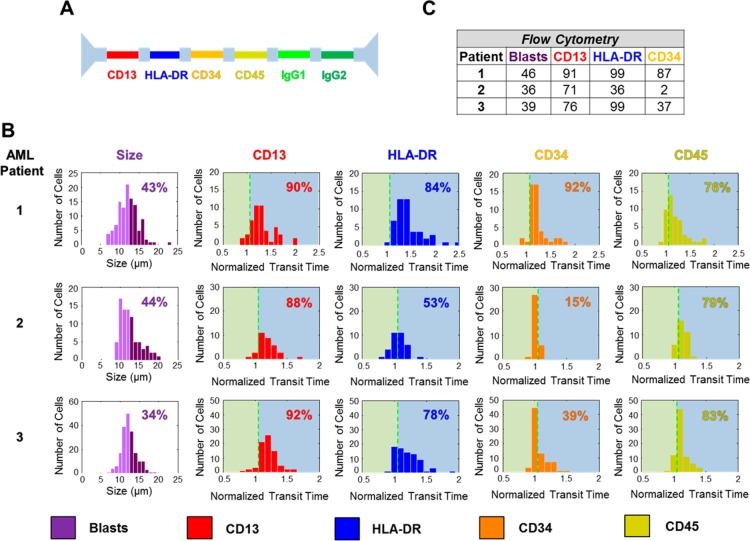
Flow cytometry is a ubiquitous, multiparametric method for characterizing cellular populations. However, this method can grow increasingly complex with the number of proteins that need to be screened simultaneously: spectral emission overlap of fluorophores and the subsequent need for compensation, lengthy sample preparation, and multiple control tests that need to be performed separately must all be considered. These factors lead to increased costs, and consequently, flow cytometry is performed in core facilities with a dedicated technician operating the instrument. Here, we describe a low-cost, label-free microfluidic method that can determine the phenotypic profiles of single cells. Our method employs Node-Pore Sensing to measure the transit times of cells as they interact with a series of different antibodies, each corresponding to a specific cell-surface antigen, that have been functionalized in a single microfluidic channel. We demonstrate the capabilities of our method not only by screening two acute promyelocytic leukemia human cells lines (NB4 and AP-1060) for myeloid antigens, CD13, CD14, CD15, and CD33, simultaneously, but also by distinguishing a mixture of cells of similar size—AP-1060 and NALM-1—based on surface markers CD13 and HLA-DR. Furthermore, we show that our method can screen complex subpopulations in clinical samples: we successfully identified the blast population in primary human bone marrow samples from patients with acute myeloid leukemia and screened these cells for CD13, CD34, and HLA-DR. We show that our label-free method is an affordable, highly sensitive, and user-friendly technology that has the potential to transform cellular screening at the benchside.


Figures

Figure 1
Figure 1
Functionalized node-pore device assembly and measurement. (A) The basic node-pore platform consists of a glass substrate with predefined platinum electrodes and gold contact pads. (B) To functionalize the node-pore device with antibodies, a temporary polydimethylsiloxane (PDMS) mold embedded with N individual microchannels, corresponding to N functionalized segments (five are shown here), is positioned onto the substrate transverse to the direction of the ultimate node-pore channel. APTES, sulfo-EGS, Protein G, and antibodies are injected and incubated into the channels to functionalize and pattern the antibodies onto the substrate (C). (D) A slab of PDMS embedded with the node-pore is aligned directly on top of the functionalized substrate such that the channel is perpendicular to the patterned antibodies. (E) The completed node-pore device has functionalized antibodies in the channel between the nodes. (inset) A pseudocolored (ImageJ) fluorescent image of three different patterned antibodies (PE Mouse IgG1, κ Isotype Control (200 μg/mL), Brilliant Violet 421 Rat IgG1, κ isotype control (50 μg/mL), Alexa Fluor 647 Mouse IgG2b, κ Isotype Control (500 μg/mL), all from Biolegend) in a completed node-pore. Scale bar, 500 μm. (F) As a cell transits a node-pore functionalized with five antibodies (top), the modulated current pulse produced (bottom) reflects the interactions between cell surface markers and the functionalized segments. For the schematic shown, the cell expresses two markers that specifically interact with Antibodies 1 and 3, leading to longer transit-times, τAb1 and τAb3, in these segments as compared to the transit-times, τAb2, τAb4, and τAb5, recorded when the cell traverses through the other segments of the node-pore.
Figure 2
Figure 2
Surface-marker profiling of leukemia cells using NPS. Acute Promyelocytic Leukemia (APL) human cell lines, NB4 and AP-1060, were screened for CD13, CD14, CD15, and CD33, simultaneously. (A) Schematic of the utilized node-pore device, which was functionalized with four specific antibodies (anti-CD13 Ab, anti-CD14 Ab, anti-CD15 Ab, and anti-CD33 Ab, all at a saturating concentration of 1 mg/mL) and an isotype control antibody (IgG1, 1 mg/mL). The device was 18 μm × 18 μm (H × W) with five 1150 μm long segments separated by four nodes, each 58 μm wide and 50 μm long. (B) Representative current pulses caused by NB4 cells (top, middle) and an AP-1060 cell (bottom) transiting the node-pore device. The modulated pulses are due to each cell traveling through each segment of the node-pore. The width of each subpulse, indicated as τCD13, τCD14, τCD15, τCD33, and τIgG1, corresponds to the transit-time of each cell as it traverses each segment. Scale bar, 0.25 s. (C) Representative normalized transit-times (τnorm = τspecificIgG1) of 10 NB4 cells and 10 AP-1060 cells and the resulting distribution for each marker screened. A cell is positive for a particular marker (CD13 = yellow; CD14 = red; CD15 = blue; and CD33 = pink) if τnorm is greater than a threshold cutoff (denoted as a dashed green line and defined as 1+ 2σisotype, where σisotype describes the inherent variability in nonspecific interactions between the cells and the functionalized isotype antibodies (see SI)). Thus, NB4 Cell 1 is CD13+/CD14/CD15+/CD33+, and AP1060 Cell 3 is CD13+/CD14/CD15/CD33+. A summary of cells positive/negative for each marker is shown in the normalized transit-time distribution. A total of 65 NB4 cells and 127 AP-1060 cells were measured. (D) FCM analysis of cells from the same population of NB4 and AP-1060 cells measured with the node-pore device. FCM detailed data can be found in SI, Figures S-2 and S-3. 15 000 NB4 cells and 35 000 AP-1060 cells were screened. A χ2 analysis with a p-value = 0.05 shows that with exception to the AP-1060 CD14 and CD33 results, the two methods are statistically equivalent. See text for details.
Figure 3
Figure 3
Analysis of a 1:1 mixture of AP-1060: NALM-1 cells using a 4-node-pore device (of similar dimension as that in Figure 2) that has repeated regions of antibody functionalization. AP-1060 cells are HLA-DR/CD13+, while NALM-1 cells are HLA-DR+/CD13. (A) FCM analysis of the cell mixture confirmed the nearly 1:1 mixture of cells. FCM details can be found in SI, Figure S-4. (B) Schematic of the 4-node-pore device employed. The repeated patterning of the anti-HLA-DR Ab and anti-CD13 Ab combination on either side of the patterned IgG1 was included to increase the sensitivity of screening. All regions were functionalized with 1 mg/mL of antibodies. HLA-DR 1 (region 1) = blue; CD13 1 (region 2) = red, HLA-DR 2 (region 4) = light blue; and CD13 2 (region 5) = pink). (C) Representative normalized transit-time of 10 cells from the mixed sample. As in Figure 2, a cell is determined to be positive for a surface marker if its normalized transit-time is greater than the IgG1 threshold cutoff, which is indicated as a green dashed line (see SI). Although it is HLA-DR/CD13 in the first half of the device, Cell 1 is HLA-DR+/CD13 in the second half. We consider the cell to be overall HLA-DR+/CD13. (D) Normalized transit-time distribution of each functionalized segment. A total of 41 cells were measured. By considering those cells like Cell 1, whose normalized transit-time is above the threshold cutoff in at least one of the two similarly functionalized segments as positive for a particular surface marker, the sensitivity of the overall device is greatly increased. A χ2 analysis with a p-value = 0.05 shows that there were no statistically significant differences between the results obtained with NPS and FCM (see SI).
Figure 4
Figure 4
FCM and NPS analysis of AML patient bone-marrow samples. (A) The antibody pattern configuration for the five-node-pore used to screen the AML patient bone-marrow samples. Two different isotype-controls, IgG1 and IgG2, were included because of the specific antibodies chosen. (B) NPS cell-size distribution (left) and surface-marker normalized transit-time distributions (right) for each patient sample. Cells greater than 12 μm (dark purple in the cell-size distribution) were considered to be blasts, and the percentage of the blast population is as indicated. (C) FCM analysis of the patient samples. FCM detailed data can be found in SI, Figures S-7–S-9. FCM analyzed ∼4000, 5000, and 9000 cells for Patient 1, 2, and 3, respectively. As with the statistical analysis performed previously (Figures 2 and 3), a χ2 analysis with a p-value = 0.05 shows that, with the exception of Patient 2’s CD34 expression, there are no statistically significant differences between NPS and FCM. See text for a full detailed description.

References

    1. Oliveira J. B.; Notarangelo L. D.; Fleisher T. A. Curr. Opin. Allergy Clin. Immunol. 2008, 8, 499–509. - PubMed
    1. Autissier P.; Soulas C.; Burdo T. H.; Williams K. C. Cytometry, Part A 2010, 77, 410–419. - PMC - PubMed
    1. Bendall S. C.; Simonds E. F.; Qiu P.; Amir el A. D.; Krutzik P. O.; Finck R.; Bruggner R. V.; Melamed R.; Trejo A.; Ornatsky O. I.; Balderas R. S.; Plevritis S. K.; Sachs K.; Pe’er D.; Tanner S. D.; Nolan G. P. Science 2011, 332, 687–696. - PMC - PubMed
    1. Liu A. Y.; True L. D.; LaTray L.; Ellis W. J.; Vessella R. L.; Lange P. H.; Higano C. S.; Hood L.; van den Engh G. Prostate 1999, 40, 192–199. - PubMed
    1. Normolle D. P.; Donnenberg V. S.; Donnenberg A. D. Cytometry, Part A 2013, 83, 150–160. - PMC - PubMed

Publication types

MeSH terms