. 2015 Jan 27;10(1):e0117186.
doi: 10.1371/journal.pone.0117186. eCollection 2015.

Rapid microscopy and use of vital dyes: potential to determine viability of Cryptococcus neoformans in the clinical laboratory

Affiliations

Rapid microscopy and use of vital dyes: potential to determine viability of Cryptococcus neoformans in the clinical laboratory

Brendan J McMullan et al. PLoS One. .

Abstract

Background: Cryptococcus neoformans is the commonest cause of fungal meningitis, with a substantial mortality despite appropriate therapy. Quantitative culture of cryptococci in cerebrospinal fluid (CSF) during antifungal therapy is of prognostic value and has therapeutic implications, but is slow and not practicable in many resource-poor countries.

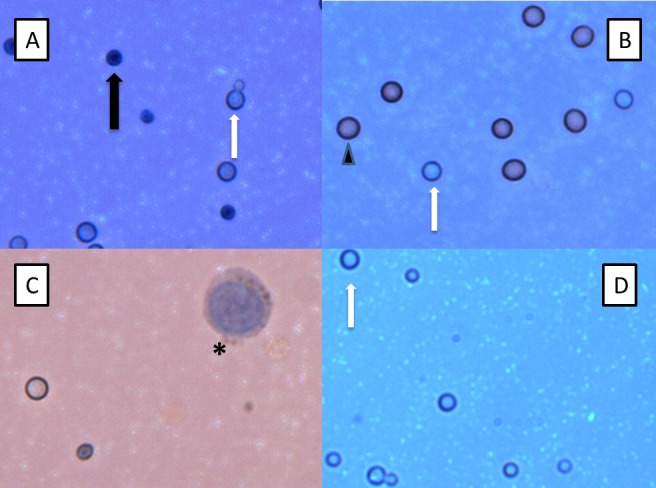
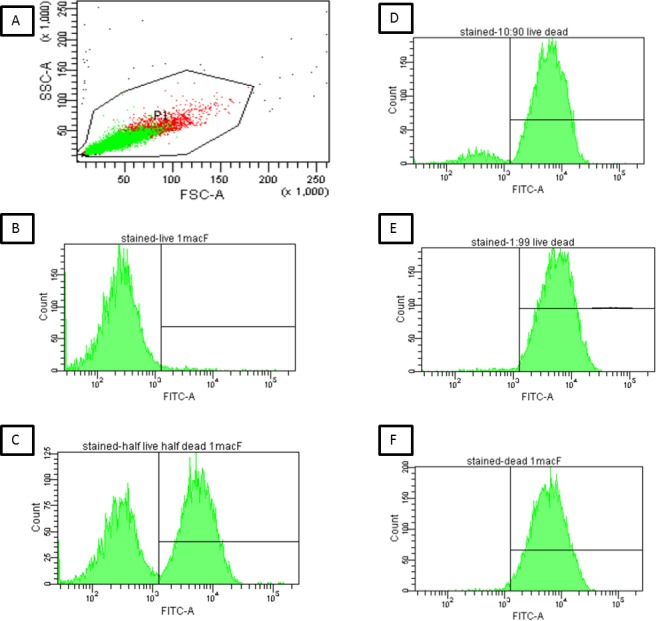
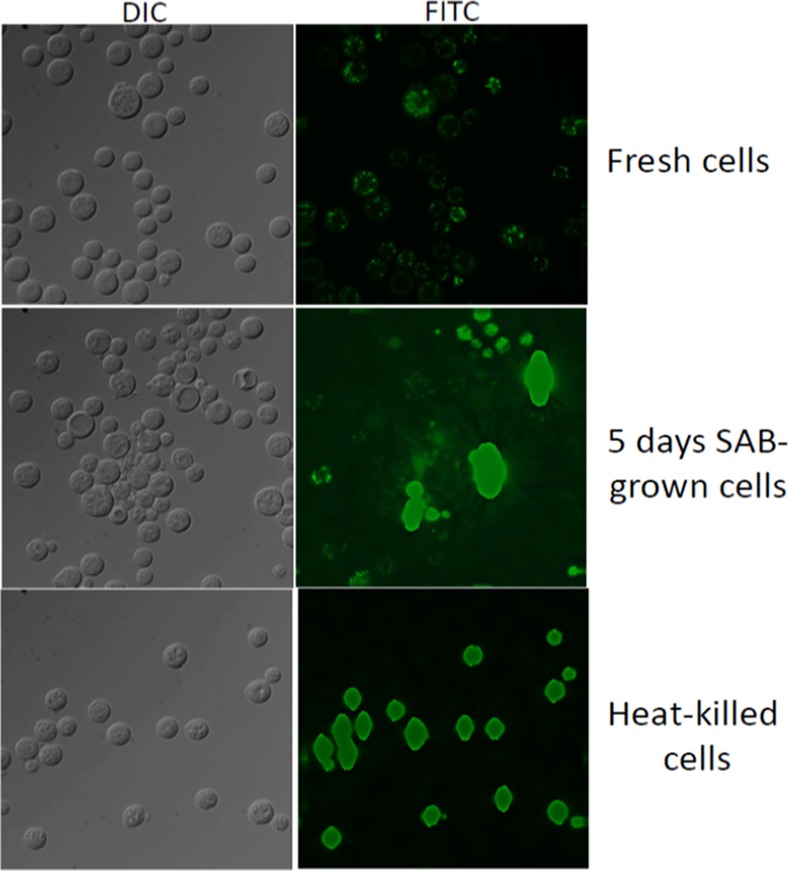
Methods: We piloted two rapid techniques for quantifying viable cryptococci using mixtures of live and heat-killed cryptococci cultured in vitro: (i) quantitative microscopy with exclusion staining using trypan blue dye, and (ii) flow cytometry, using the fluorescent dye 2'-7'-Bis-(2-carboxyethyl)-5-(6)-carboxyfluorescein, acetoxymethyl ester (BCECF-AM). Results were compared with standard quantitative cryptococcal cultures. Quantitative microscopy was also performed on cerebrospinal fluid (CSF) samples.

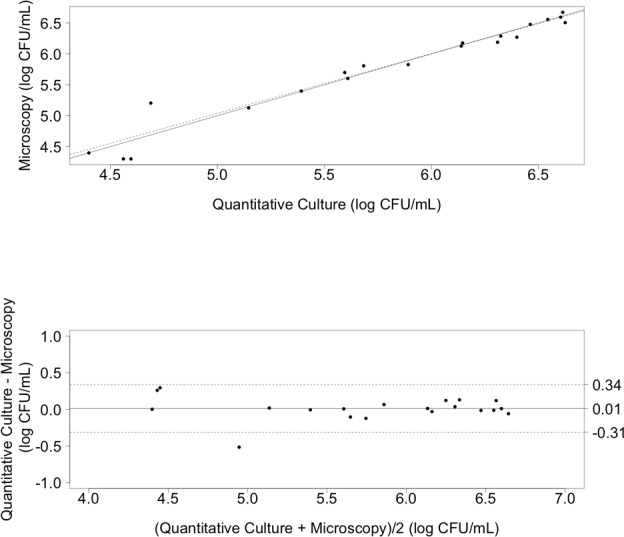
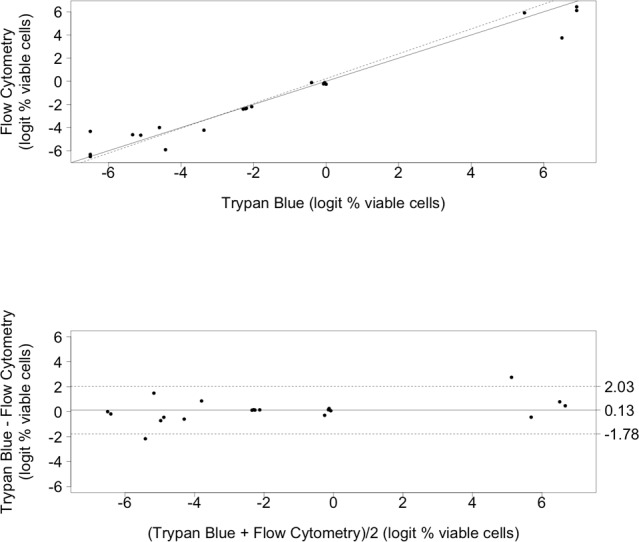
Results: Both microscopy and flow cytometry distinguished between viable and non-viable cryptococci. Cell counting (on log scale) by microscopy and by quantitative culture were significantly linearly associated (p<0.0001) and Bland-Altman analysis showed a high level of agreement. Proportions of viable cells (on logit scale), as detected by flow cytometry were significantly linearly associated with proportions detected by microscopy (p<0.0001) and Bland-Altman analysis showed a high level of agreement.

Conclusions: Direct microscopic examination of trypan blue-stained cryptococci and flow-cytometric assessment of BCECF-AM-stained cryptococci were in good agreement with quantitative cultures. These are promising strategies for rapid determination of the viability of cryptococci, and should be investigated in clinical practice.


Conflict of interest statement

Competing Interests: The authors have declared that no competing interests exist.

Figures

Figure 1
Figure 1. Trypan Blue Microscopy of Cryptococci.
Light microscopic examination of Trypan blue-stained cryptococci at 40x magnification readily distinguishes viable (transparent, white arrow) and dead (dark blue, black arrow) cryptococci in in vitro (A) and CSF (B-D) samples. Note the presence of budding viable cryptococci in (A). Erythrocytes (arrowhead) are also observed in the CSF sample in (B) alongside viable cryptococci. (B), (C) and (D) are CSF samples obtained before and after dilution with water, respectively, which lyses mammalian cells. The large nucleated cell (asterisk) observed before dilution in (C) is a leukocyte. Many viable cryptococci remain in the CSF after lysis of mammalian cells in (D) (white arrow). The different intensity of background colour is due to adjustment of microscopy lighting, focus and contrast. No colour adjustment has been performed post-photography.
Figure 2
Figure 2. Cryptococcal Counts via Microscopy and Quantitative Cultures.
From prepared samples of 100:0, 50:50, 10:90, 1:99, 0:100 live:dead cryptococci. 2A (top). Scatter plot for Quantitative Culture and Microscopy cell counting methods. Solid line indicates the reference line. Dotted line indicates the regression line. Counts are for viable cryptococci. 2B (bottom). Bland-Altman difference plot for Quantitative Culture and Microscopy cell count methods. The bias (mean difference between measurement methods) is shown as a solid horizontal line and the 95% limits of agreement are shown with dashed lines at +/− 1.96 standard deviations.
Figure 3
Figure 3. Flow Cytometric Assessment of Cryptococcal Viability using BCECF.
(3A-F) Heat-killed and viable Cryptococci were mixed to yield the following ratios of live:dead cells (100:0, 50:50, 10:90, 1:99, 0:100) at a dilution of 1 McFarland and stained with BCECF: A representative scattergram for the 50:50 mixture a dilution of 1 McFarland is shown in (3A), with the gate containing both live and dead cells. Green dots are single cells, which were used for analysis of percentage viability, and red dots are potential doublets or clumped cells. All mixtures yielded a similar forward and side scatter plot, indicating that there was no differentiation between live and dead cells. 3B-E: Histogram plots obtained for mixtures of 100:0, 50:50, 10:90, 1:99, and 0:100 live:dead cells. Viable cells (low fluorescence) are indicated in the left panel and non-viable cells (bright fluorescence) in the right panel. FSC: Forward Scatter; SSC: Side Scatter; FITC-A: Fluorescence in the fluorescein isothiocyanate channel.
Figure 4
Figure 4. Percentage Viable Cells by Trypan Blue Staining versus Flow Cytometry.
From prepared samples of 100:0, 50:50, 10:90, 1:99, 0:100 live:dead cryptococci. 4A (top). Scatter plot for Trypan Blue and Flow Cytometry methods of measuring viable cell percentages. Solid line indicates the reference line. Dotted line indicates the regression line. 4B (bottom). Bland-Altman difference plot comparing the Trypan Blue and Flow Cytometry viable cell measurement methods. The bias (mean difference between measurement methods) is shown as a solid horizontal line and the 95% limits of agreement are shown with dashed lines at +/− 1.96 standard deviations.
Figure 5
Figure 5. Fluorescent Microscopic Assessment of Cryptococcal Viability using BCECF.
Phase contrast and fluorescence microscopic analysis of viable (fresh cells), nutrient starved cells, following 5 days growth on Sabouraud’s Dextrose Agar, and heat-killed cryptococci in the upper, middle and lower panels, respectively. DIC: Differential Interference Contrast Microscopy; FITC: Fluorescein isothiocyanate Fluorescent Microscopy. SAB: Sabouraud’s Dextrose Agar.

References

    1. Brouwer AE, Teparrukkul P, Pinpraphaporn S, Larsen RA, Chierakul W, et al. (2005) Baseline Correlation and Comparative Kinetics of Cerebrospinal Fluid Colony-Forming Unit Counts and Antigen Titers in Cryptococcal Meningitis. Journal of Infectious Diseases 192: 681–684. - PubMed
    1. Robinson PA, Bauer M, Leal MAE, Evans SG, Holtom PD, et al. (1999) Early mycological treatment failure in AIDS-associated cryptococcal meningitis. Clin Infect Dis 28: 82–92. - PubMed
    1. Brouwer AE, Rajanuwong A, Chierakul W, Griffin GE, Larsen RA, et al. (2004) Combination antifungal therapies for HIV-associated cryptococcal meningitis: a randomised trial. The Lancet 363: 1764–1767. - PubMed
    1. Bicanic T, Muzoora C, Brouwer AE, Meintjes G, Longley N, et al. (2009) Independent Association between Rate of Clearance of Infection and Clinical Outcome of HIV- Associated Cryptococcal Meningitis: Analysis of a Combined Cohort of 262 Patients. Clinical Infectious Diseases 49: 702–709. 10.1086/604716 - DOI - PMC - PubMed
    1. Jarvis JN, Bicanic T, Loyse A, Namarika D, Jackson A, et al. (2014) Determinants of Mortality in a Combined Cohort of 501 Patients With HIV-Associated Cryptococcal Meningitis: Implications for Improving Outcomes. Clinical Infectious Diseases 58: 736–745. 10.1093/cid/cit794 - DOI - PMC - PubMed

Publication types

Substances

LinkOut - more resources