. 2015 May;1851(5):527-36.
doi: 10.1016/j.bbalip.2015.01.012. Epub 2015 Jan 24.

Lipid abnormalities in alpha/beta2-syntrophin null mice are independent from ABCA1

Affiliations

Lipid abnormalities in alpha/beta2-syntrophin null mice are independent from ABCA1

Tobias Hebel et al. Biochim Biophys Acta. 2015 May.

Abstract

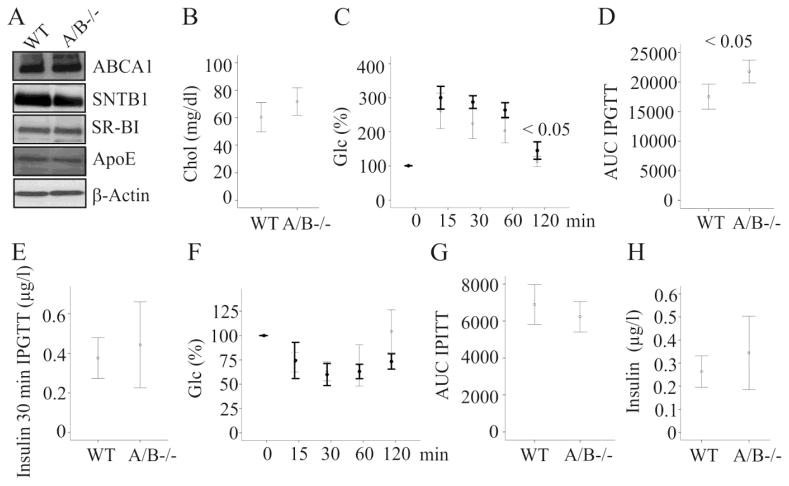
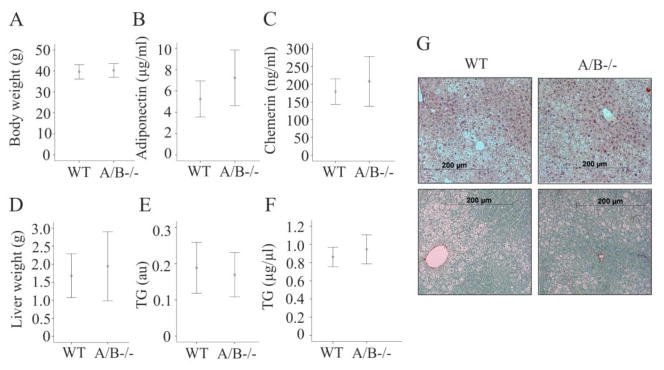
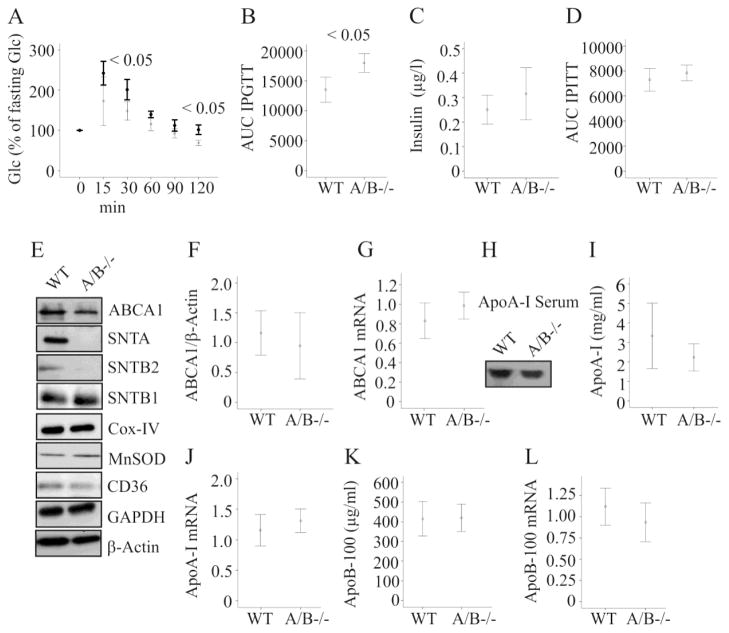
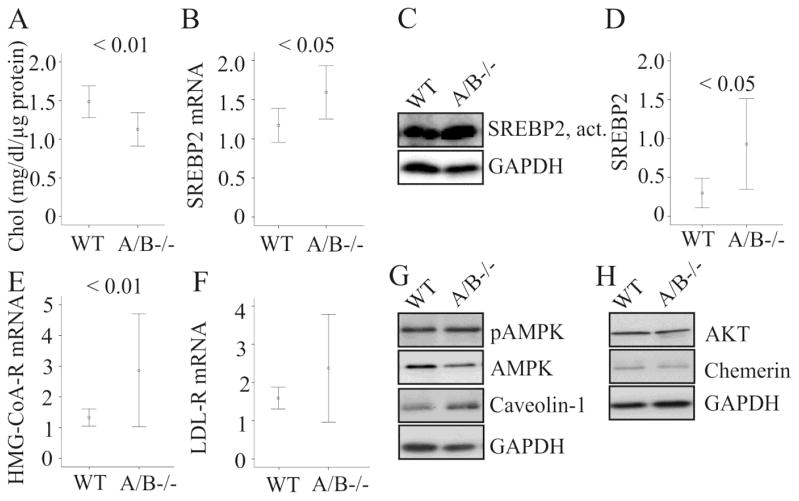
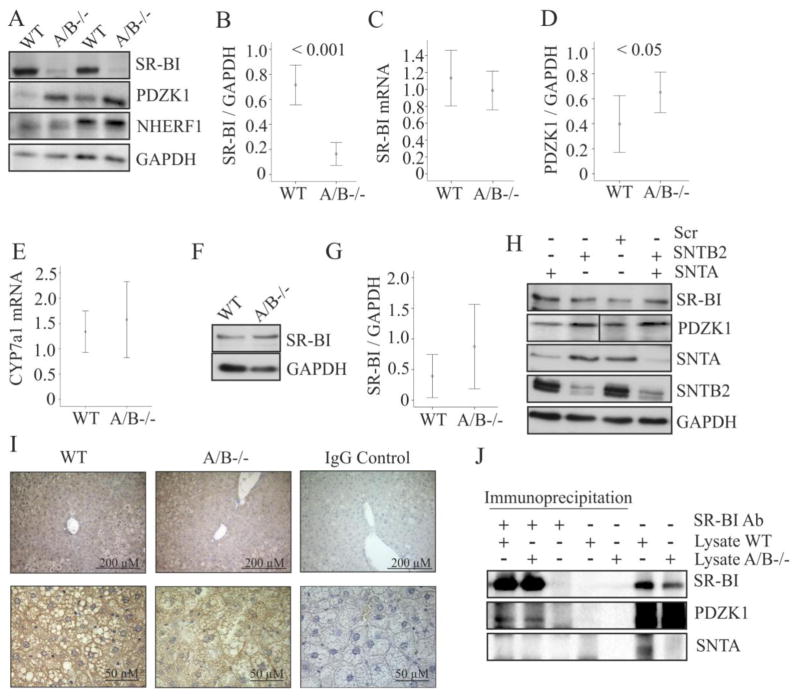
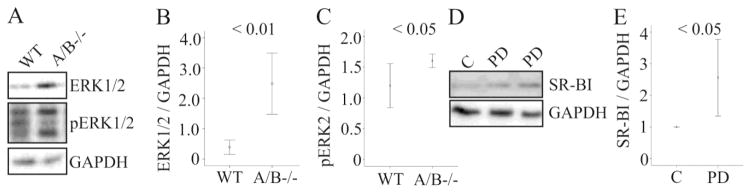
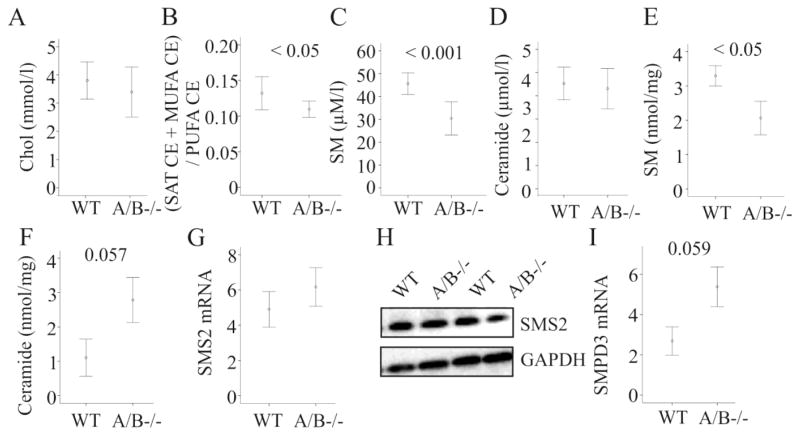
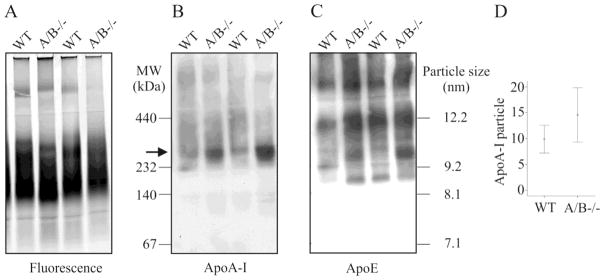
The syntrophins alpha (SNTA) and beta 2 (SNTB2) are molecular adaptor proteins shown to stabilize ABCA1, an essential regulator of HDL cholesterol. Furthermore, SNTB2 is involved in glucose stimulated insulin release. Hyperglycemia and dyslipidemia are characteristic features of the metabolic syndrome, a serious public health problem with rising prevalence. Therefore, it is important to understand the role of the syntrophins herein. Mice deficient for both syntrophins (SNTA/B2-/-) have normal insulin and glucose tolerance, hepatic ABCA1 protein and cholesterol. When challenged with a HFD, wild type and SNTA/B2-/- mice have similar weight gain, adiposity, serum and liver triglycerides. Hepatic ABCA1, serum insulin and insulin sensitivity are normal while glucose tolerance is impaired. Liver cholesterol is reduced, and expression of SREBP2 and HMG-CoA-R is increased in the knockout mice. Scavenger receptor-BI (SR-BI) protein is strongly diminished in the liver of SNTA/B2-/- mice while SR-BI binding protein NHERF1 is not changed and PDZK1 is even induced. Knock-down of SNTA, SNTB2 or both has no effect on hepatocyte SR-BI and PDZK1 proteins. Further, SR-BI levels are not reduced in brown adipose tissue of SNTA/B2-/- mice excluding that syntrophins directly stabilize SR-BI. SR-BI stability is regulated by MAPK and phosphorylated ERK2 is induced in the liver of the knock-out mice. Blockage of ERK activity upregulates hepatocyte SR-BI showing that increased MAPK activity contributes to low SR-BI. Sphingomyelin which is well described to regulate cholesterol metabolism is reduced in the liver and serum of the knock-out mice while the size of serum lipoproteins is not affected. Current data exclude a major function of these syntrophins in ABCA1 activity and insulin release but suggest a role in regulating glucose uptake, ERK and SR-BI levels, and sphingomyelin metabolism in obesity.

Keywords: Glucose tolerance test; Insulin; Liver; Scavenger receptor B-I; Sphingomyelin.


Conflict of interest statement

Declaration of interest

The authors declare that there is no conflict of interest that could be perceived as prejudicing the impartiality of the research reported.

Figures

Figure 1
Figure 1. ABCA1, intraperitoneal glucose and insulin tolerance tests (IPGTT, IPITT) and insulin in SNTA/B2−/− (A/B−/−) mice fed a SD
(A) ABCA1, SNTB1, SR-BI, ApoE and β-actin in the liver of wild type (WT) and SNTA/B2−/− mice. (B) Serum cholesterol in 6 WT and 5 SNTA/B2−/− mice. (C) IPGTT in 6 WT and 3 SNTA/B2−/− mice. Data of the knock-out mice are shown in bold. (D) Area under the curve (AUC) of glucose shown in C. (E) Serum insulin of the animals described in C 30 minutes after glucose injection. (F) IPITT in 6 WT and 3 SNTA/B2−/− mice. Data of the knock-out mice are shown in bold. (G) AUC of IPITT. (H) Fasting insulin measured in serum of 9 WT and 10 SNTA/B2−/− mice.
Figure 2
Figure 2. Body weight, adipokines and triglycerides in SNTA/B2−/− (A/B−/−) mice fed a HFD
(A) Body weight of 8 WT and 8 SNTA/B2−/− mice after 25 weeks HFD feeding. (B) Serum adiponectin of 7 WT and 8 SNTA/B2−/− mice. (C) Serum chemerin of 7 WT and 8 SNTA/B2−/− mice. (D) Liver weight of 8 WT and 8 SNTA/B2−/− mice after 25 weeks HFD feeding. (E) Liver triglycerides of these mice, au arbitrary units. (F) Serum triglycerides of these mice. (G) H&E and Sirius Red stained liver of a WT and a SNTA/B2−/− mouse.
Figure 3
Figure 3. Intraperitoneal glucose tolerance test (IPGTT), insulin, hepatic ABCA1 and serum apolipoproteins in SNTA/B2−/− (A/B−/−) mice fed a HFD
(A) IPGTT in 5 WT and 5 SNTA/B2−/− mice fed a HFD for 16 weeks. Data of the knock-out mice are shown in bold. (B) Area under the curve (AUC) of IPGTT shown in A. (C) Fasting insulin measured in serum of 5 WT and 4 SNTA/B2−/− mice fed a HFD for 25 weeks (D) AUC of IPITT of 5 wild type and 5 SNTA/B−/− mice. (E) ABCA1, SNTA, SNTB2, SNTB1, Cox-IV, MnSOD, CD36, GAPDH and β-actin in the liver of WT and SNTA/B2−/− mice fed a HFD for 25 weeks. (F) ABCA1 protein in the liver of 8 WT and 8 SNTA/B2−/− mice. (G) ABCA1 mRNA in the liver of 8 WT and 7 SNTA/B2−/− mice. (H) Immunoblot of ApoA-I in serum of a WT and a double knock-out mouse. (I) ApoA-I in the serum of 8 WT and 8 SNTA/B2−/− mice. (J) ApoA-I mRNA in the liver of 8 WT and 7 SNTA/B2−/− mice. (K) ApoB-100 in the serum of 6 WT and 5 SNTA/B2−/− mice. (L) ApoB-100 mRNA in the liver of 8 WT and 7 SNTA/B2−/− mice.
Figure 4
Figure 4. Hepatic cholesterol and proteins with a role in cholesterol homeostasis in SNTA/B2−/− (A/B−/−) mice fed a HFD
(A) Liver cholesterol (Chol) measured with a commercial assay and normalized to total protein in 8 WT and 8 SNTA/B2−/− mice fed a HFD for 25 weeks. (B) SREBP2 mRNA in the liver of 8 WT and 7 SNTA/B2−/− mice fed a HFD for 25 weeks. (C) Active SREBP2 protein in the liver (D) Quantification of active SREBP2 protein in the liver of 7 WT and 7 SNTA/B2−/− mice fed a HFD for 25 weeks. (E) HMG-CoA-R mRNA in the liver of 8 WT and 7 SNTA/B2−/− mice fed a HFD for 25 weeks. (F) LDL-R mRNA in the liver of these mice. (G) pAMPK, AMPK and caveolin-1 in the liver of a wild type and a SNTA/B2 null mouse. (H) AKT and chemerin in the liver of a wild type and a SNTA/B2 null mouse.
Figure 5
Figure 5. SR-BI in the liver, brown adipose tissue and siRNA transfected Hepa 1-6 cells
(A) SR-BI, PDZK1 and NHERF1 in the liver of 2 wild type and 2 SNTA/B2 null mice. (B) SR-BI protein in the liver of 8 WT and 8 SNTA/B2−/− mice fed a HFD for 25 weeks. (C) SR-BI mRNA in the liver of 8 WT and 7 SNTA/B2−/− mice fed a HFD for 25 weeks. (D) PDZK1 protein in the liver of 7 WT and 7 SNTA/B2−/− mice fed a HFD for 25 weeks. (E) CYP7a1 mRNA in the liver of 8 WT and 7 SNTA/B2−/− mice. (F) SR-BI in brown adipose tissue of a wild type and a SNTA/B2 null mouse fed a HFD for 25 weeks. (G) SR-BI protein in brown adipose tissue of 8 WT and 8 SNTA/B2−/− mice fed a HFD for 25 weeks. (H) SR-BI, PDZK1, SNTA and SNTB2 in Hepa1-6 cells transfected with scrambled (Scr) siRNA, SNTA siRNA, SNTB2 siRNA or both. (I) PDZK1 in the liver of wild type and SNTA/B−/− mice. Original magnification of the upper panels was 20-fold and of the lower panels 60-fold. The respective IgG isotype controls are shown on the right. (J) SR-BI was immunoprecipitated in liver lysates of WT and SNTA/B2−/− mice. SR-BI, PDZK1 and SNTA were analyzed by immunoblot in the immunoprecipitates, respective control experiments and the liver lysates used.
Figure 6
Figure 6. ERK1/2 in the liver and effect of ERK1/2 inhibitor on hepatocyte SR-BI
(A) ERK1/2 and pERK1/2 in the liver of a wild type and a SNTA/B2 null mice. (B) ERK1/2 protein in the liver of 7 WT and 7 SNTA/B2−/− mice fed a HFD for 25 weeks. (C) pERK2 protein in the liver of 6 WT and 5 SNTA/B2−/− mice. (D) SR-BI in primary hepatocytes incubated with the ERK1/2 inhibitor PD98059 for 24 h. (E) Quantification of the data of three experiments partly shown in D. Controls were set to 1.
Figure 7
Figure 7. Cholesterol, sphingomyelin and ceramide in SNTA/B2−/− (A/B−/−) mice fed a HFD
(A) Serum cholesterol measured in 8 WT and 8 SNTA/B2−/− mice fed a HFD for 25 weeks by ESI-MS/MS. (B) Ratio of saturated (SAT) and monounsaturated (MUFA) to polyunsaturated (PUFA) cholesteryl ester (CE) species in the serum of these mice. (C) Serum sphingomyelin (SM) measured in 8 WT and 8 SNTA/B2−/− mice fed a HFD for 25 weeks. (D) Serum ceramide measured in 8 WT and 8 SNTA/B2−/− mice fed a HFD for 25 weeks. (E) Hepatic sphingomyelin (SM) measured in 4 WT and 4 SNTA/B2−/− mice fed a HFD for 25 weeks. (F) Hepatic ceramide measured in 4 WT and 4 SNTA/B2−/− mice fed a HFD for 25 weeks. (G) SMS2 mRNA in the liver of 8 wild type and 7 SNTA/B2 null mice. (H) SMS2 protein in the liver of two wild type and two SNTA/B2 null mice. (I) SMPD3 mRNA in the liver of 8 wild type and 6 SNTA/B2 null mice.
Figure 8
Figure 8. Distribution of lipoproteins
(A) Plasma samples stained with a lipophilic dialkylaminostyryl fluorophore. (B) Plasma samples were analyzed for distribution of ApoA-I and (C) ApoE. (D) Quantification of the ApoA-I particles marked by an arrow in B in plasma of 6 wild type and 7 SNTA/B2−/− animals.

References

    1. Buechler C, Wanninger J, Neumeier M. Adiponectin, a key adipokine in obesity related liver diseases. World J Gastroenterol. 2011;17:2801–2811. - PMC - PubMed
    1. Haffner SM. Relationship of metabolic risk factors and development of cardiovascular disease and diabetes. Obesity (Silver Spring) 2006;14(Suppl 3):121S–127S. - PubMed
    1. Hjermann I. The metabolic cardiovascular syndrome: syndrome X, Reaven’s syndrome, insulin resistance syndrome, atherothrombogenic syndrome. Journal of cardiovascular pharmacology. 1992;20(Suppl 8):S5–10. - PubMed
    1. Buechler C, Bauer S. ATP binding cassette transporter A1 (ABCA1) associated proteins: potential drug targets in the metabolic syndrome and atherosclerotic disease? Current pharmaceutical biotechnology. 2012;13:319–330. - PubMed
    1. Chung S, Timmins JM, Duong M, Degirolamo C, Rong S, Sawyer JK, Singaraja RR, Hayden MR, Maeda N, Rudel LL, Shelness GS, Parks JS. Targeted deletion of hepatocyte ABCA1 leads to very low density lipoprotein triglyceride overproduction and low density lipoprotein hypercatabolism. J Biol Chem. 2010;285:12197–12209. - PMC - PubMed

Publication types

MeSH terms

Substances