. 2015 Jan 27:6:6044.
doi: 10.1038/ncomms7044.

Multi-omics analysis defines core genomic alterations in pheochromocytomas and paragangliomas

Affiliations

Multi-omics analysis defines core genomic alterations in pheochromocytomas and paragangliomas

Luis Jaime Castro-Vega et al. Nat Commun. .

Abstract

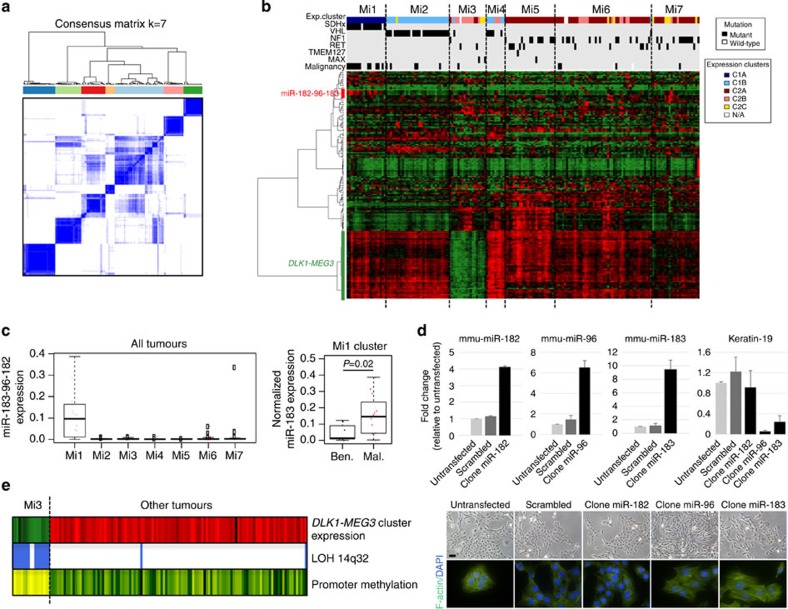
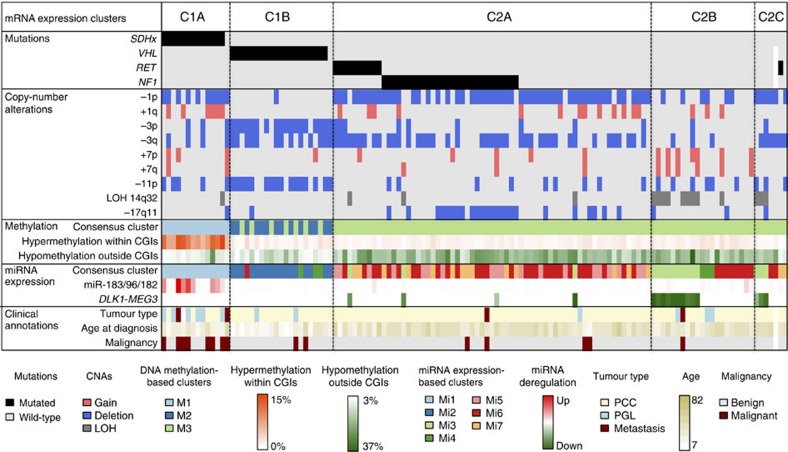
Pheochromocytomas and paragangliomas (PCCs/PGLs) are neural crest-derived tumours with a very strong genetic component. Here we report the first integrated genomic examination of a large collection of PCC/PGL. SNP array analysis reveals distinct copy-number patterns associated with genetic background. Whole-exome sequencing shows a low mutation rate of 0.3 mutations per megabase, with few recurrent somatic mutations in genes not previously associated with PCC/PGL. DNA methylation arrays and miRNA sequencing identify DNA methylation changes and miRNA expression clusters strongly associated with messenger RNA expression profiling. Overexpression of the miRNA cluster 182/96/183 is specific in SDHB-mutated tumours and induces malignant traits, whereas silencing of the imprinted DLK1-MEG3 miRNA cluster appears as a potential driver in a subgroup of sporadic tumours. Altogether, the complete genomic landscape of PCC/PGL is mainly driven by distinct germline and/or somatic mutations in susceptibility genes and reveals different molecular entities, characterized by a set of unique genomic alterations.


Conflict of interest statement

The authors declare no competing financial interests.

Figures

Figure 1
Figure 1. Copy-number alterations in PCC/PGL.
(a) Pan-genomic frequency of gains (in red) and deletions (in blue) among the complete set of 150 PCC/PGL. (b) Overview of the copy-number profiles exported from the Integrative Genomics Viewer. Each line represents the profile of a tumour, with gains in red and deletions in blue. Samples are ordered according to the mRNA expression cluster they belong to, as indicated on the left. (c) Copy-number profile of a tumour presenting chromothripsis on chromosomes 1, 5 and 17. Top: Pan-genomic log R ratio profile. Bottom: log R ratio and B allele frequency profiles of chromosomes 1 and 17. These chromosomes display numerous breakpoints and a copy number oscillating between two values, classical of chromothripsis events. (d) Tumour progression trees reconstructed for four patients with primary tumour and co-occurring tumour/relapse/metastasis data. Tumours of the first patient were also analysed by exome sequencing. APG, abdominal paraganglioma; cnLOH, copy neutral loss of heterozygosity; CP, common precursor; LA, left adrenal; NT, normal tissue; PCC, pheochromocytoma; RA, right adrenal. In red, germline mutations; in blue, somatic mutations.
Figure 2
Figure 2. Whole-exome sequencing analysis of 31 PCC/PGL.
(a) Number of synonymous and non-synonymous somatic mutations in the 31 PCC/PGL samples. (b) Relative proportions of the 6 possible base-pair substitutions on the transcribed and non-transcribed strands among the 616 point mutations identified in the exome sequences of 31 PCC/PGL. Error bars denote the s.d. (c) Number and type of damaging events for 7 genes altered in at least 2 cases, and 14 genes belonging to the Cancer Gene Census and altered in a single tumour.
Figure 3
Figure 3. miRNA profiling of 172 PCC/PGL.
(a) Unsupervised classification of 172 PCC/PGL identifies 7 stable miRNA expression clusters. The consensus matrix represents the similarity between samples. Consensus index values range from 0 (highly dissimilar profiles, white) to 1 (highly similar profiles, dark blue). Samples are ordered on the x and y axes according to consensus clustering, which is depicted above the heat map. (b) Heat map of miRNA expression profiles. The expression levels of the miRNAs with the most variant expression are shown by colour (red for high expression and green for low expression). Samples are ordered by miRNA expression subgroup, with mRNA expression subgroup and mutations in known driver genes depicted above the heatmap. (c) Box-and-whisker plots show the distribution of miR-183-96-182 expression levels relative to each tumour subgroup (left), and of miR-183 relative to malignancy among Mi1 tumours (right). Middle bar, median; box, interquartile range; bars extend to 1.5 times the interquartile range. Ben., benign; Mal., malignant. Error bars denote the s.d. (d) Overexpression of miRNAs 96/183 in mouse chromaffin cells induces an EMT-like phenotype. Histograms show the relative expression of mature miRs and keratin-19 (used as EMT marker) detected by quantitative reverse transcription–PCR in clones obtained after stable transfections with plasmids containing either scrambled or miRNA sequences. Error bars denote the s.e.m. The bottom panel shows the corresponding morphology changes as determined by F-actin immunostaining. Scale bar, 20 μm. (e) Deregulation of the DLK1-MEG3 cluster in PCC/PGL of the Mi3 group. The mean expression levels of miRNAs belonging to the DLK1-MEG3 cluster are indicated, together with the presence of a LOH at the locus (blue, LOH; white, no LOH) and the methylation levels at the promoter CpG island (yellow, fully methylated; green, hemimethylated; dark green, unmethylated).
Figure 4
Figure 4. Integrative genomic characterization of PCC/PGL.
The main genetic, epigenetic and transcriptional changes affecting PCC/PGL are represented for the 128 samples analysed by SNP, DNA methylation, mRNA expression arrays, miRNA sequencing and targeted sequencing of known driver genes. Samples are ordered according to the mRNA cluster they belong to. Clinical features associated with molecular groups are also depicted at the bottom.

References

    1. Dahia P. L. Pheochromocytoma and paraganglioma pathogenesis: learning from genetic heterogeneity. Nat. Rev. Cancer. 14, 108–119 (2014). - PubMed
    1. Gimenez-Roqueplo A. P. et al.. Mutations in the SDHB gene are associated with extra-adrenal and/or malignant phaeochromocytomas. Cancer Res. 63, 5615–5621 (2003). - PubMed
    1. Amar L. et al.. Succinate dehydrogenase B gene mutations predict survival in patients with malignant pheochromocytomas or paragangliomas. J. Clin. Endocrinol. Metab. 92, 3822–3828 (2007). - PubMed
    1. Castro-Vega L. J. et al.. Germline mutations in FH confer predisposition to malignant pheochromocytomas and paragangliomas. Hum. Mol. Genet. 23, 2440–2446 (2014). - PubMed
    1. Burnichon N. et al.. Somatic NF1 inactivation is a frequent event in sporadic pheochromocytoma. Hum. Mol. Genet. 21, 5397–5405 (2012). - PubMed

Publication types

MeSH terms