. 2015 Feb;21(2):209-16.
doi: 10.3201/eid2102.130504.

Quantifying reporting timeliness to improve outbreak control

Quantifying reporting timeliness to improve outbreak control

Axel Bonačić Marinović et al. Emerg Infect Dis. 2015 Feb.

Abstract

The extent to which reporting delays should be reduced to gain substantial improvement in outbreak control is unclear. We developed a model to quantitatively assess reporting timeliness. Using reporting speed data for 6 infectious diseases in the notification system in the Netherlands, we calculated the proportion of infections produced by index and secondary cases until the index case is reported. We assumed interventions that immediately stop transmission. Reporting delays render useful only those interventions that stop transmission from index and secondary cases. We found that current reporting delays are adequate for hepatitis A and B control. However, reporting delays should be reduced by a few days to improve measles and mumps control, by at least 10 days to improve shigellosis control, and by at least 5 weeks to substantially improve pertussis control. Our method provides quantitative insight into the required reporting delay reductions needed to achieve outbreak control and other transmission prevention goals.


Figures

Figure 1
Figure 1
Timeline for chain of disease reporting, the Netherlands. Lab, laboratory; PHA, public health authority.
Figure 2
Figure 2
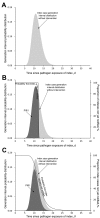
Schematic modification of PIR1. A) Generation interval distribution of an index case as function of time since the index case acquired the pathogen. Without notification and intervention, the proportion of infections expected by the index case is 1, the light gray area under the curve. B) How the generation interval distribution is modified, assuming that all index cases are notified and stopped exactly 13 days after exposure to the pathogen. C) How the average generation interval is modified when index cases are notified and stopped according to a time distribution. Dark gray shading indicates the PIR1 value for each situation. The black line indicates the proportion of index cases not yet notified (right y-axis), equivalent to the probability of an index case not yet being notified in each situation. PIR1, expected proportion of cases caused by index case at notification.
Figure 3
Figure 3
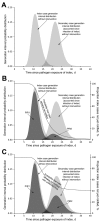
Schematic modification of PIR2. A) Generation interval time distributions of index and secondary cases, from the moment of exposure of the notified index case. PIR2 is represented by the area under the second generation interval distribution, which is 1 in the absence of notification/intervention. B) PIR1 and PIR2 values when index cases are notified and stopped together with their secondary cases, according to a time distribution. C) How PIR values in panel B are modified by 40% underreporting. Dark gray shading indicates PIR1 and PRI2 values. The black line indicates the proportion of index cases not yet notified (right y-axis), equivalent to the probability of an index case not yet being notified in each situation. PIR1, expected proportion of cases caused by index case at notification; PIR2, expected proportion of new infections caused by secondary cases before index case is notified.
Figure 4
Figure 4
Timeliness of current reporting speed in the Netherlands, evaluated considering interventions applied to reported index cases only. The outbreak control condition is R × PIR1<1. Diseases that lie in the outbreak control areas are those for which reporting speed is timely enough to enable outbreak control. PIR1, expected proportion of cases caused by index case at notification; R, reproduction number.
Figure 5
Figure 5
Timeliness of current reporting speed in the Netherlands, evaluated considering interventions applied for reported index cases and their secondary cases. The lower outbreak control condition is R2 × PIR2<1, assuming index cases are reported too late to stop any secondary infection (i.e., PIR1 = 1 always). The upper outbreak control condition R × PIR2<1, which is the most relaxed condition, assumes an extreme situation that index cases have not caused more infections than secondary cases (PIR1 = PIR2). In practice, the outbreak control condition lies in between these 2 conditions. Diseases that lie in the outbreak control areas are those for which reporting speed is timely enough to enable outbreak control. PIR1, expected proportion of cases caused by index case at notification; PIR2, expected proportion of new infections caused by secondary cases before index case is notified; R, reproduction number.
Figure 6
Figure 6
PIR1, depending on reporting delay median for the indicated diseases and assuming standard deviation equal to median value. Thick lines show reporting delay medians for which there is no outbreak control. Thin dashed lines would show reporting delay medians that bring diseases within the outbreak condition (R × PIR1<1), but they are not present because even with extremely short delays it is not possible to fulfill the condition with the studied diseases (except shigellosis). Symbols indicate PIR1 evaluated with current reporting delay data. PIR1, expected proportion of cases caused by index case at notification; R, reproduction number.
Figure 7
Figure 7
Expected proportion of infections caused by secondary cases before reporting of their index case, depending on reporting delay median for the indicated diseases and assuming standard deviation equal to median value. Thick lines show reporting delay medians for which there is no outbreak control. Intermediate-width dashed lines show reporting delay medians that bring diseases within the upper outbreak condition (R × PIR2<1). Thin dashed lines show reporting delay medians bringing diseases under the lower outbreak control condition (R2 × PIR2<1). Symbols indicate PIR2 evaluated with current reporting delay data. HepA, hepatitis A; hepB, hepatitis B; PIR2, expected proportion of new infections caused by secondary cases before index case is notified; R, reproduction number.

References

    1. Jajosky RA, Groseclose S. Evaluation of reporting timeliness of public health surveillance systems for infectious diseases. BMC Public Health. 2004;4:29. 10.1186/1471-2458-4-29 - DOI - PMC - PubMed
    1. Yoo H-S, Park O, Park H-K, Lee E-G, Jeong E-K, Lee J-K, et al. Timeliness of national notifiable diseases surveillance system in Korea: a cross-sectional study. BMC Public Health. 2009;9:93. 10.1186/1471-2458-9-93 - DOI - PMC - PubMed
    1. Reijn E, Swaan CM, Kretzschmar ME, van Steenbergen JE. Analysis of timeliness of infectious disease reporting in the Netherlands. BMC Public Health. 2011;11:409. 10.1186/1471-2458-11-409 - DOI - PMC - PubMed
    1. Bogaards JA, Putter H, Jan Weverling G, ter Meulen J, Goudsmit J. The potential of targeted antibody prophylaxis in SARS outbreak control: a mathematic analysis. Travel Med Infect Dis. 2007;5:70–8. 10.1016/j.tmaid.2006.01.007 - DOI - PMC - PubMed
    1. Yoo HS, Cho SI, Lee JK, Park HK, Lee EG, Kwon JW. A new surveillance indicator identifying optimal timeliness and accuracy: application to the Korean National Notifiable Disease Surveillance System for 2001–2007. Epidemiol Infect. 2013;141:2634–43. 10.1017/S0950268812002956 - DOI - PMC - PubMed

LinkOut - more resources