

Arsenic responsive microRNAs in vivo and their potential involvement in arsenic-induced oxidative stress
- PMID: 25625412
- PMCID: PMC4361368
- DOI: 10.1016/j.taap.2015.01.014
Arsenic responsive microRNAs in vivo and their potential involvement in arsenic-induced oxidative stress
Abstract
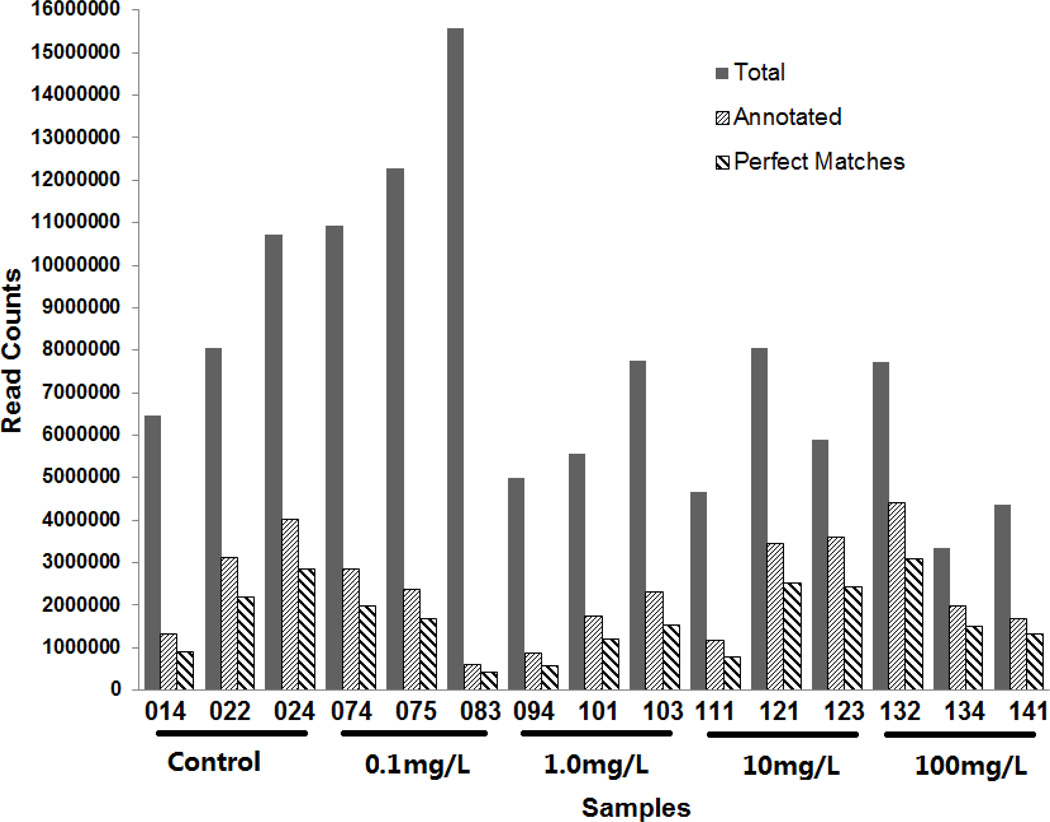
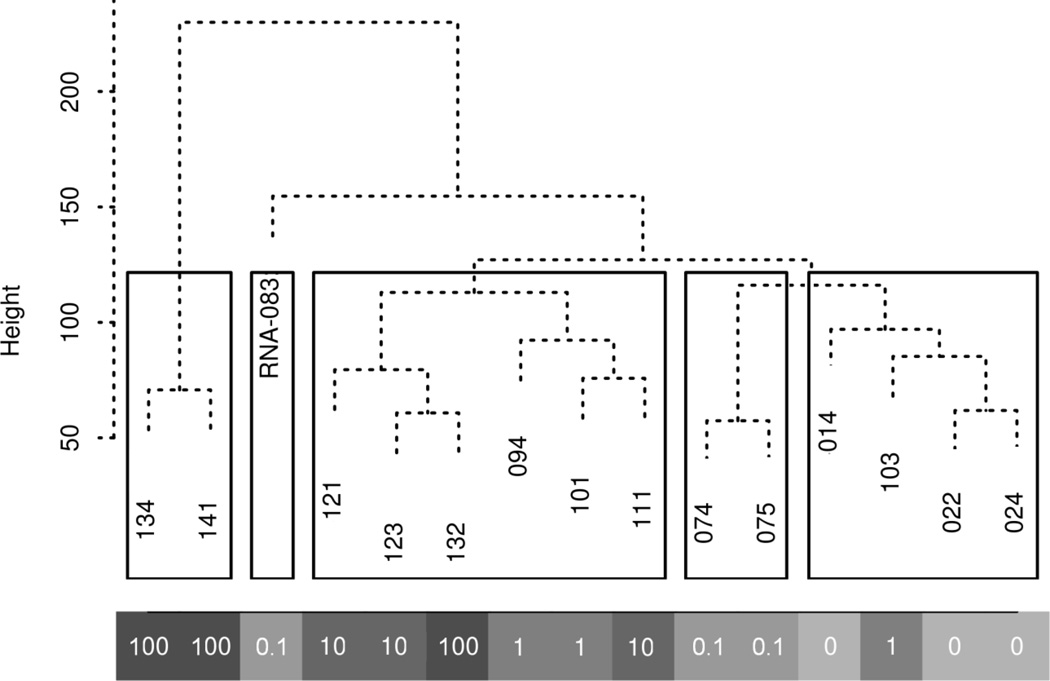
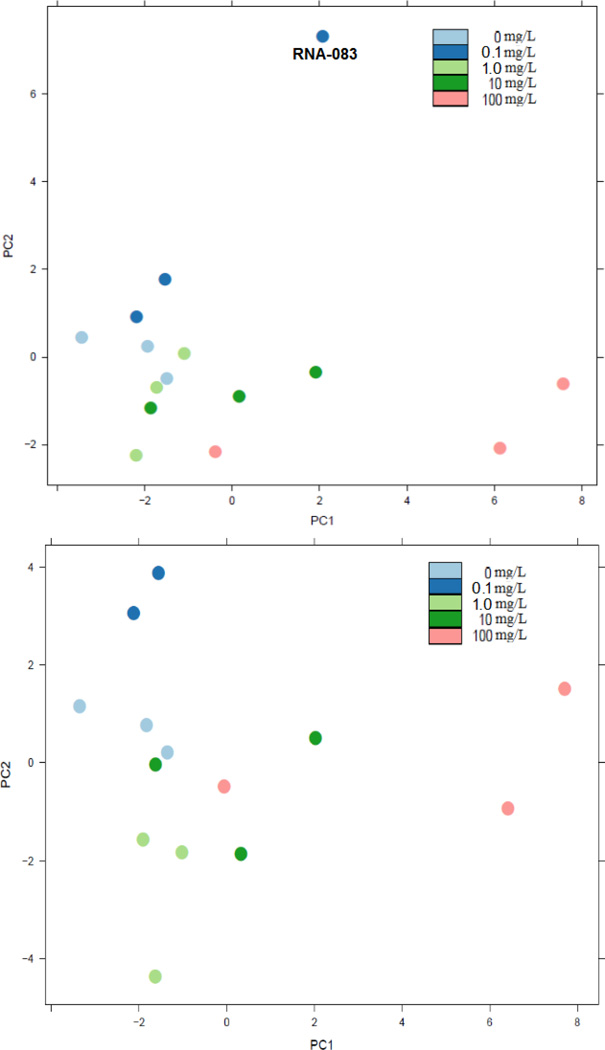
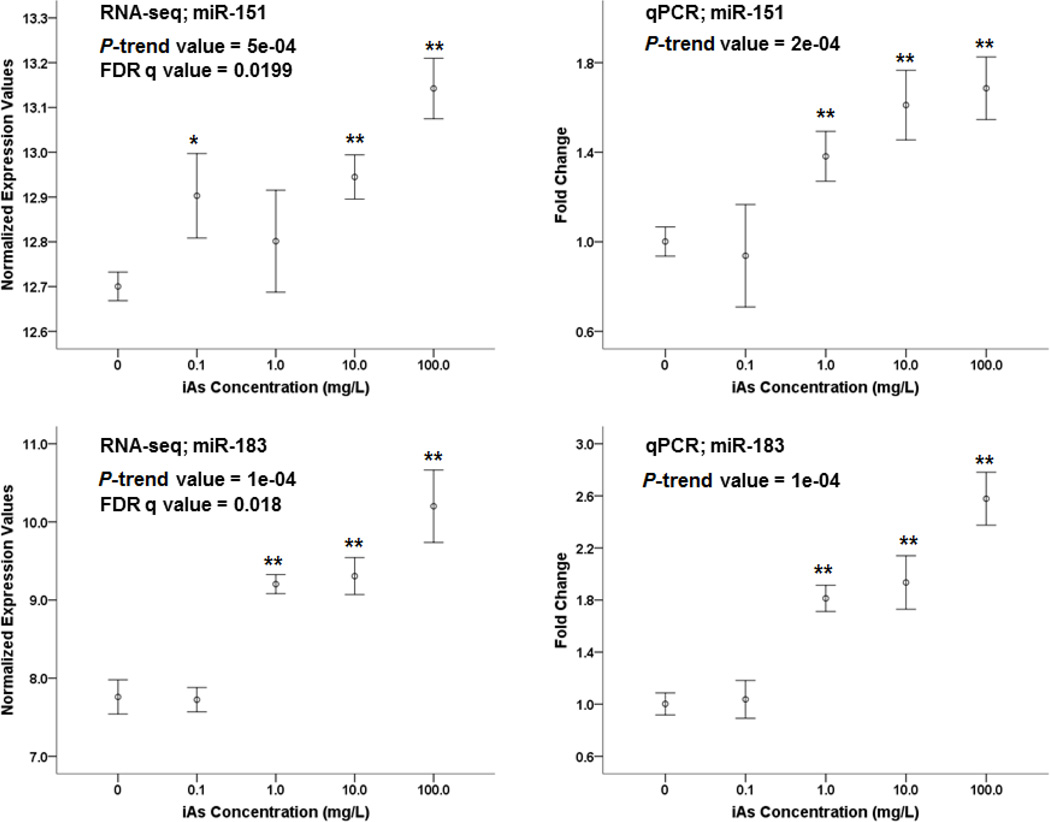
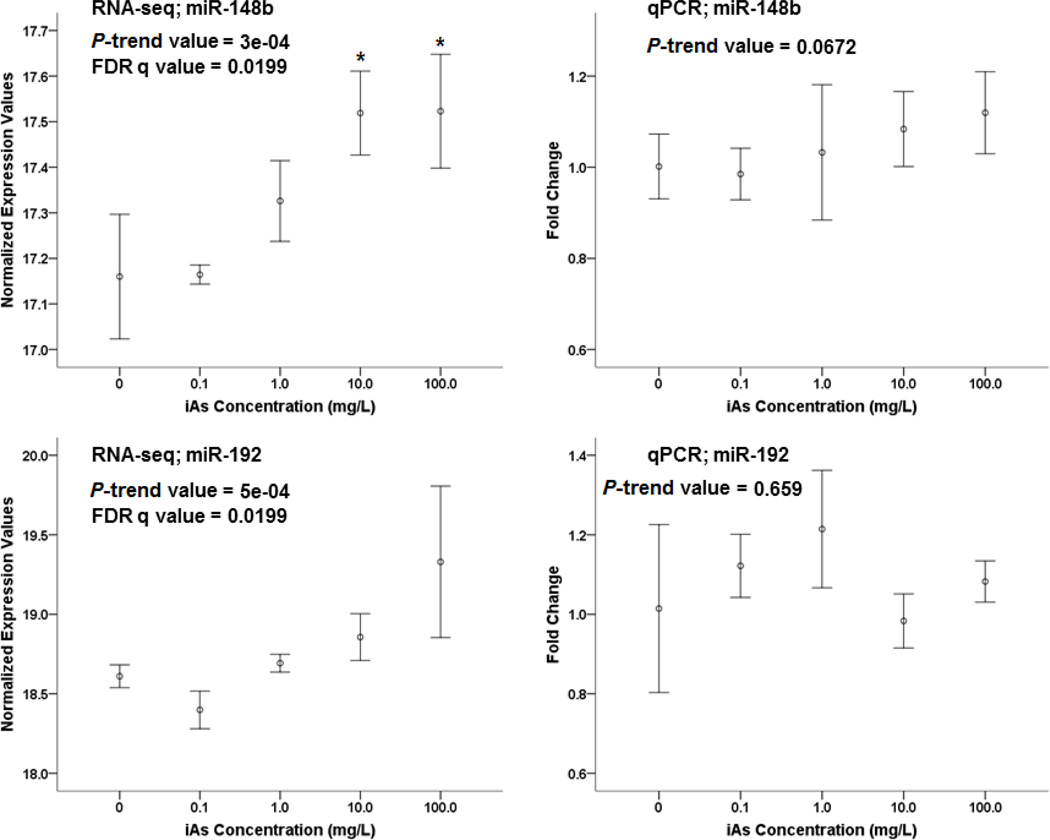
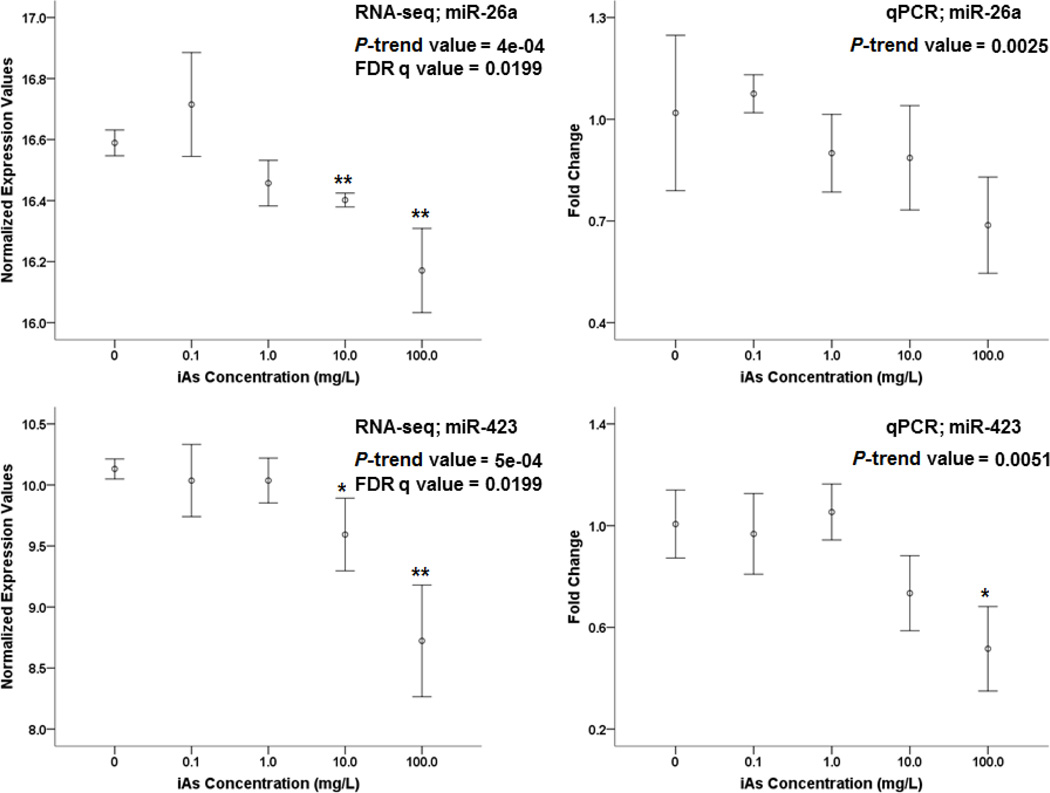
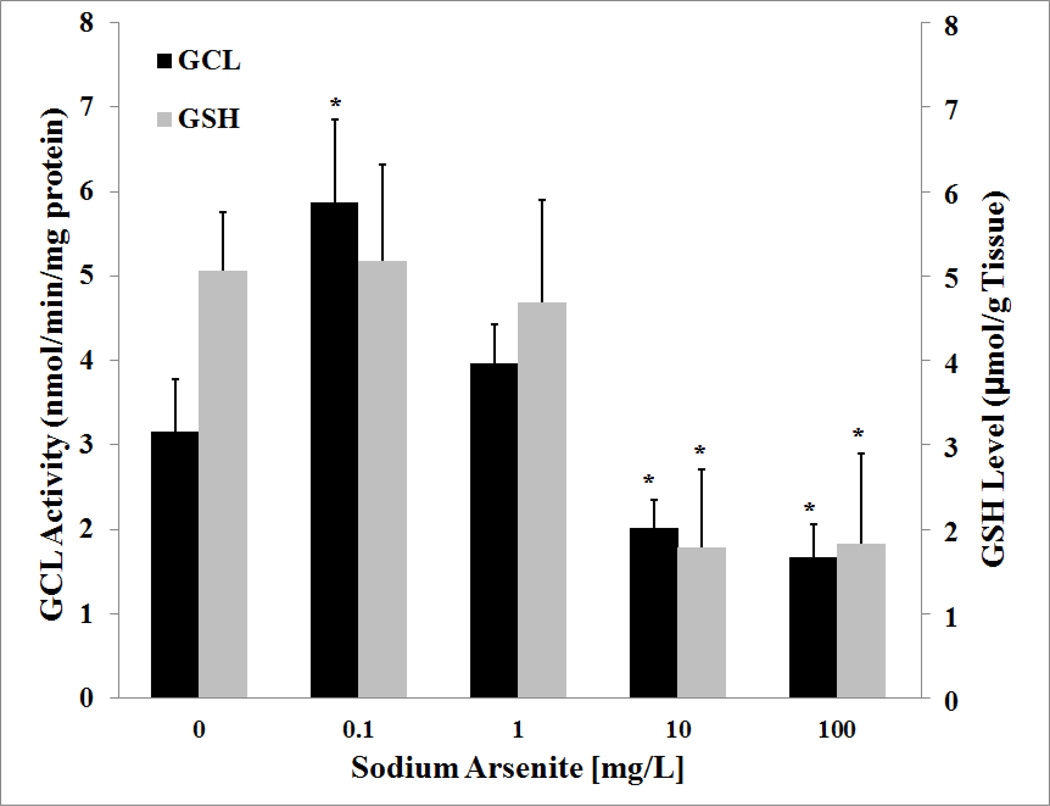
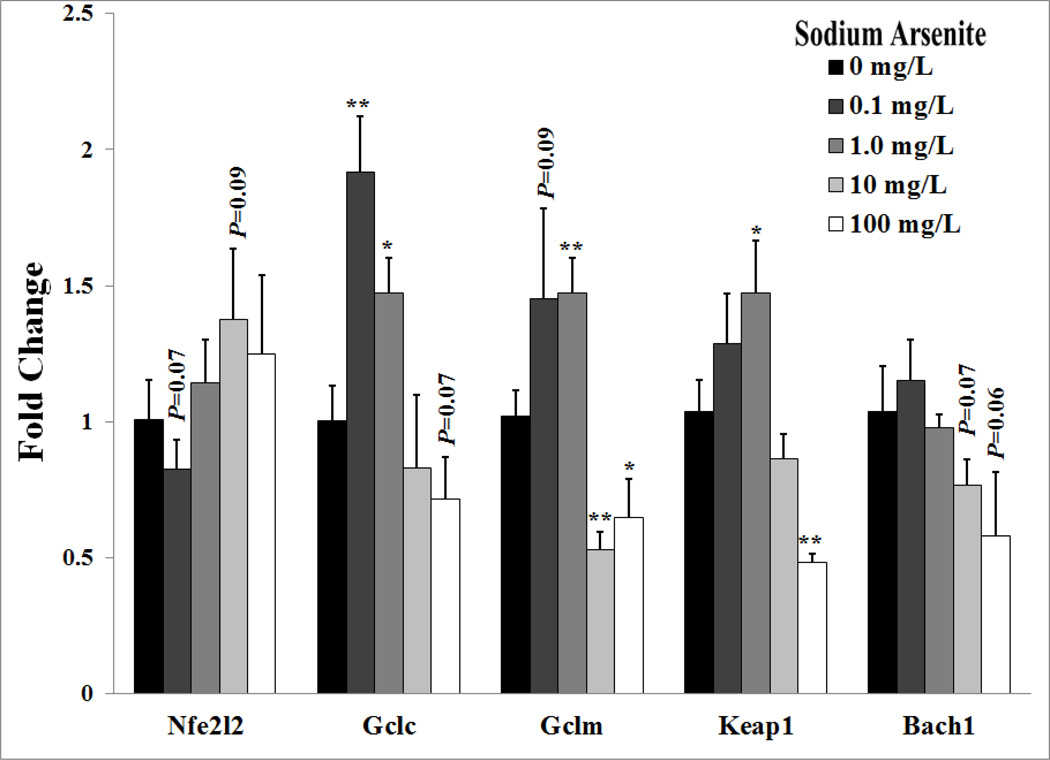
Arsenic exposure is postulated to modify microRNA (miRNA) expression, leading to changes of gene expression and toxicities, but studies relating the responses of miRNAs to arsenic exposure are lacking, especially with respect to in vivo studies. We utilized high-throughput sequencing technology and generated miRNA expression profiles of liver tissues from Sprague Dawley (SD) rats exposed to various concentrations of sodium arsenite (0, 0.1, 1, 10 and 100mg/L) for 60days. Unsupervised hierarchical clustering analysis of the miRNA expression profiles clustered the SD rats into different groups based on the arsenic exposure status, indicating a highly significant association between arsenic exposure and cluster membership (p-value of 0.0012). Multiple miRNA expressions were altered by arsenic in an exposure concentration-dependent manner. Among the identified arsenic-responsive miRNAs, several are predicted to target Nfe2l2-regulated antioxidant genes, including glutamate-cysteine ligase (GCL) catalytic subunit (GCLC) and modifier subunit (GCLM) which are involved in glutathione (GSH) synthesis. Exposure to low concentrations of arsenic increased mRNA expression for Gclc and Gclm, while high concentrations significantly reduced their expression, which were correlated to changes in hepatic GCL activity and GSH level. Moreover, our data suggested that other mechanisms, e.g., miRNAs, rather than Nfe2l2-signaling pathway, could be involved in the regulation of mRNA expression of Gclc and Gclm post-arsenic exposure in vivo. Together, our findings show that arsenic exposure disrupts the genome-wide expression of miRNAs in vivo, which could lead to the biological consequence, such as an altered balance of antioxidant defense and oxidative stress.
Keywords: Arsenic; Glutamate–cysteine ligase; Glutathione; High-throughput sequencing; MicroRNA (miRNA); Oxidative stress.
Copyright © 2015 Elsevier Inc. All rights reserved.
Conflict of interest statement
Figures
Similar articles
-
Protection by chrysin, apigenin, and luteolin against oxidative stress is mediated by the Nrf2-dependent up-regulation of heme oxygenase 1 and glutamate cysteine ligase in rat primary hepatocytes.Arch Toxicol. 2013 Jan;87(1):167-78. doi: 10.1007/s00204-012-0913-4. Epub 2012 Aug 5. Arch Toxicol. 2013. PMID: 22864849
-
Induction of glutathione synthesis in human hepatocytes by acute and chronic arsenic exposure: differential roles of mitogen-activated protein kinases.Toxicology. 2014 Nov 5;325:96-106. doi: 10.1016/j.tox.2014.09.002. Epub 2014 Sep 6. Toxicology. 2014. PMID: 25201354
-
Differential regulation of glutamate-cysteine ligase subunit expression and increased holoenzyme formation in response to cysteine deprivation.Biochem J. 2006 Jan 1;393(Pt 1):181-90. doi: 10.1042/BJ20051111. Biochem J. 2006. PMID: 16137247 Free PMC article.
-
A Systematic Review of the Various Effect of Arsenic on Glutathione Synthesis In Vitro and In Vivo.Biomed Res Int. 2020 Jul 28;2020:9414196. doi: 10.1155/2020/9414196. eCollection 2020. Biomed Res Int. 2020. PMID: 32802886 Free PMC article.
-
Modulating GSH synthesis using glutamate cysteine ligase transgenic and gene-targeted mice.Drug Metab Rev. 2008;40(3):465-77. doi: 10.1080/03602530802186587. Drug Metab Rev. 2008. PMID: 18642143 Review.
Cited by
-
Early-Life Arsenic Exposure, Nutritional Status, and Adult Diabetes Risk.Curr Diab Rep. 2019 Nov 22;19(12):147. doi: 10.1007/s11892-019-1272-9. Curr Diab Rep. 2019. PMID: 31758285 Free PMC article. Review.
-
Modulation of miRNA expression in natural populations of A. thaliana along a wide altitudinal gradient of Indian Himalayas.Sci Rep. 2019 Jan 24;9(1):441. doi: 10.1038/s41598-018-37465-y. Sci Rep. 2019. PMID: 30679759 Free PMC article.
-
Genetic and epigenetic mechanisms underlying arsenic-associated diabetes mellitus: a perspective of the current evidence.Epigenomics. 2017 May;9(5):701-710. doi: 10.2217/epi-2016-0097. Epub 2017 May 4. Epigenomics. 2017. PMID: 28470093 Free PMC article. Review.
-
Arsenic and Human Health: Genotoxicity, Epigenomic Effects, and Cancer Signaling.Biol Trace Elem Res. 2022 Mar;200(3):988-1001. doi: 10.1007/s12011-021-02719-w. Epub 2021 Apr 16. Biol Trace Elem Res. 2022. PMID: 33864199 Review.
-
Arsenic-induced changes in miRNA expression in cancer and other diseases.Toxicol Appl Pharmacol. 2020 Dec 15;409:115306. doi: 10.1016/j.taap.2020.115306. Epub 2020 Oct 28. Toxicol Appl Pharmacol. 2020. PMID: 33127375 Free PMC article. Review.
References
-
- Abernathy CO, Thomas DJ, Calderon RL. Health effects and risk assessment of arsenic. J Nutr. 2003;133:1536S–1538S. - PubMed
-
- Bai Y, Wang L, Sun L, Ye P, Hui R. Circulating microRNA-26a: Potential predictors and therapeutic targets for non-hypertensive intracerebral hemorrhage. Medical Hypotheses. 2011;77:488–490. - PubMed
-
- Bartel DP. MicroRNAs: genomics, biogenesis, mechanism, and function. Cell. 2004;116:281–297. - PubMed
Publication types
MeSH terms
Substances
Grants and funding
LinkOut - more resources
Full Text Sources
Other Literature Sources
Research Materials
Miscellaneous
