. 2015 Jan 27;10(1):e0114050.
doi: 10.1371/journal.pone.0114050. eCollection 2015.

The effects of two polymorphisms on p21cip1 function and their association with Alzheimer's disease in a population of European descent

Affiliations

The effects of two polymorphisms on p21cip1 function and their association with Alzheimer's disease in a population of European descent

Sharon C Yates et al. PLoS One. .

Abstract

With the exception of ApoE4, genome-wide association studies have failed to identify strong genetic risk factors for late-onset Alzheimer's disease, despite strong evidence of heritability, suggesting that many low penetrance genes may be involved. Additionally, the nature of the identified genetic risk factors and their relation to disease pathology is also largely obscure. Previous studies have found that a cancer-associated variant of the cell cycle inhibitor gene p21cip1 is associated with increased risk of Alzheimer's disease. The aim of this study was to confirm this association and to elucidate the effects of the variant on protein function and Alzheimer-type pathology. We examined the association of the p21cip1 variant with Alzheimer's disease and Parkinson's disease with dementia. The genotyping studies were performed on 719 participants of the Oxford Project to Investigate Memory and Ageing, 225 participants of a Parkinson's disease DNA bank, and 477 participants of the Human Random Control collection available from the European Collection of Cell Cultures. The post mortem studies were carried out on 190 participants. In the in-vitro study, human embryonic kidney cells were transfected with either the common or rare p21cip1 variant; and cytometry was used to assess cell cycle kinetics, p21cip1 protein expression and sub-cellular localisation. The variant was associated with an increased risk of Alzheimer's disease, and Parkinson's disease with dementia, relative to age matched controls. Furthermore, the variant was associated with an earlier age of onset of Alzheimer's disease, and a more severe phenotype, with a primary influence on the accumulation of tangle pathology. In the in-vitro study, we found that the SNPs reduced the cell cycle inhibitory and anti-apoptotic activity of p21cip1. The results suggest that the cancer-associated variant of p21cip1 may contribute to the loss of cell cycle control in neurons that may lead to Alzheimer-type neurodegeneration.


Conflict of interest statement

Competing Interests: The authors have read the journal’s policy and the authors of this manuscript have the following competing interests: AD Smith was a scientific consultant to CytOx, Ltd., at the time the study commenced. MM Esiri and Z Nagy are shareholders of CytOx, Ltd., (<1.5% each) and were consultants to the company at the time the study commenced. Z Nagy is the named inventor on the patent applications owned by the University of Oxford and the University of Birmingham. SC Yates, A Zafar, EM Rabai, J Foxall, S Nagy, S Christie, KE Morrison and C Clarke have declared that no competing interests exist. This does not alter the authors’ adherence to PLOS ONE policies on sharing data and materials.

Figures

Figure 1
Figure 1. HEK293 cells transfected with p21cip1. Image of cells acquired from the Acumen cytometer.
The p21cip1 was labelled by immunohistochemistry (green fluorescence). The DNA is labelled red by the PI. Panel A: The cell with the blue edge is an example of what we would accept as cytoplasmic protein expression. Panel B is the green fluorescence intensity histogram (as measured by the cytometer) over the surface of the same cell (with the blue edge in panel A) indicating a relatively uniform protein distribution in the cytoplasm around the nucleus. Panel C is the distribution histogram of the red fluorescence (DNA) from the same cell (with the blue edge in panel A). The distribution of the DNA is characteristic for a single cell. Panel D: The cell with the blue edge is an example of what we would accept as nuclear protein expression. Panel E is the green fluorescence intensity histogram (protein content as measured by the cytometer) over the surface of the same cell (with the blue edge in panel D). Panel F is the red fluorescence (DNA) from the same cell (with the blue edge in panel D). The overlap and identical distribution patterns of the protein (green label) and DNA (red label) is characteristic for nuclear proteins.
Figure 2
Figure 2. Kaplan-Meier probability distribution of disease free survival prior to the age of 75.
The disease in question was dementia associated with AD. The graph shows the disease free survival probability of subjects prior to the age of 75, in subgroups defined by the p21cip1 genotype. Prior to the age of 75, the variant p21cip1 was associated with a significant reduction in the disease free survival compared to the common p21cip1 (hazard ratio: 1.698, p-value: 0.017). The x-axis represents the age in years. The y-axis represents the survival probability expressed as a percentage. The solid black line represents subjects that were homozygous for the common p21cip1. The broken grey line represents subjects that were heterozygous or homozygous for the variant p21cip1.
Figure 3
Figure 3. Kaplan-Meier probability distribution of disease free survival prior to the age of 75.
The disease in question was dementia in Parkinson’s disease. The graph shows the disease free survival probability of subjects prior to the age of 75, in subgroups defined by the p21cip1 genotype. Prior to the age of 75, the variant p21cip1 was significantly associated with a reduction in the disease free survival compared to the common p21cip1 (hazard ratio: 3.239, p-value < 0.001). The x-axis represents the age in years. The y-axis represents the survival probability expressed as a percentage. The solid black line represents subjects that were homozygous for the common p21cip1. The broken grey line represents subjects that were heterozygous or homozygous for the variant p21cip1.
Figure 4
Figure 4. The effect of the p21cip1 genotype on the age of onset of AD.
Of the subjects with advanced AD at post-mortem, the subjects with the variant p21cip1 had a significantly lower age of onset than subjects with the common p21cip1 (p-value: 0.016). The x-axis represents the p21cip1 genotype, with com and var representing subjects with the common and variant p21cip1 respectively. The y-axis represents the age at onset of AD in years. The top of the bars represent the mean. The error bars represent the standard error of the mean (SEM). Statistical test: one-way ANOVA.
Figure 5
Figure 5. The effect of the p21cip1 genotype on the expression of tau pathology in the brain.
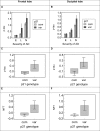
Panel A and B: The graphs shows the mean p-tau levels in the brain of subjects in subgroups defined by the severity of AD and the p21cip1 genotype (Panel A: frontal lobe, Panel B: occipital lobe). The x-axis represents the severity of AD as defined by Braak: E = entorhinal stage, L = limbic stage, N = neocortical stage. The y-axis represents the amount of p-tau detected in the relevant lobe by ELISA with a marker for AT8 (arbitrary units). Light grey bars: subjects with common p21cip1; dark grey bars: subjects with variant p21cip1. Statistical test: Kruskal Wallis. Panel C, D, E and F: Z-scores were calculated for the amount of p-tau and NFT detected in the temporal, frontal and occipital lobe of each subject, taking into account the severity of AD as defined by Braak. This eliminated the need for subgroups defined by the disease severity. The graphs show the mean z-scores in subgroups defined by the p21cip1 genotype. Panel C: p-tau in the frontal lobe. Panel D: p-tau in the occipital lobe. Panel E: NFT in the frontal lobe. Panel F: NFT in the occipital lobe. The x-axes represent the p21cip1 genotype, with com and var representing subjects with common and variant p21cip1 respectively. The y-axes represents the p-tau or NFT content of the relevant brain region as determined by ELISA with markers for AT8 and DC11 respectively (arbitrary units). Statistical test: one-way ANOVA. The top/bottom of the bars represent the mean. The error bars represent the SEM.
Figure 6
Figure 6. The effect of the p21cip1 genotype on the spread of p-tau pathology in the brain.
Panel A and B. The spread of p-tau pathology was defined as the ratio of the amount of p-tau in the region less severely affected by AD (Panel A: frontal lobe; Panel B: occipital lobe) over that in the more severely affected region (temporal lobe). Z-scores were calculated for the spread of p-tau taking into account the disease severity as defined by Braak, which eliminated the need for subgroups defined by the disease severity. The graphs show the mean z-scores of p-tau spread in subgroups defined by the p21cip1 genotype. The x-axis represents the p21cip1 genotype, with com and var representing subjects with the common and variant p21cip1 respectively. The y-axis represents the spread of p-tau calculated from data determined by ELISA with a marker for AT8 (arbitrary units). The error bars represent the SEM. Statistical test: one-way ANOVA of z-scores.
Figure 7
Figure 7. The association of the disease stage with p21cip1 expression in the temporal lobe.
Subjects with more severe AD had a significantly greater amount of p21cip1 protein in the temporal lobe than subjects in an earlier stage of the disease (p-value: 0.007). The x-axis represents the severity of AD as defined by Braak: E = entorhinal stage, L = limbic stage, N = neocortical stage. The y-axis represents the p21cip1 protein content of the temporal lobe as determined by ELISA (arbitrary units). The top of the bars represent the mean and the error bars the SEM. Statistical test: Kruskal Wallis.
Figure 8
Figure 8. DNA distribution histograms from HEK293 cells transfected with p21cip1.
Representative DNA distribution histograms of single cells from the Acumen cytometer (black bars). The debris and multiple cells (white bars) were excluded from the analysis. Panel A: Typical DNA content histogram of single cells following the transfection with the empty vector (EV NC). Panel B: Typical DNA content histogram of single cells following transfection with the common variant of p21cip1. Panel C: Typical DNA content histogram of single cells following transfection with the rare variant of p21cip1.
Figure 9
Figure 9. The effect of the p21cip1 genotype on the expression of p21cip1.
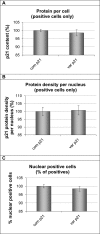
The graphs plot the amount of p21cip1 protein expressed per cell (Panel A); the p21cip1 protein density per nucleus (Panel B) and the percentage of nuclear positive cells (Panel C) of cells transfected with either the common or variant p21cip1. Only cells that were positive for p21cip1 protein, as determined by Acumen Cytometry, were included in the analysis. To allow comparison of the cells transfected with the different variants of p21cip1, the expression of p21cip1 in each transfected population was normalised to that in the common p21cip1 transfected population. All results concerning p21cip1 expression in the common population are therefore displayed as 100%. On the x-axis: com p21 represents cells transfected with common p21cip1; var p21 represents cells transfected with variant p21cip1. The y-axis represents the p21cip1 protein expression per cell (Panel A), the p21cip1 density per nucleus (Panel B), and the percentage of nuclear positive cells (Panel C) expressed as a percentage of that in the population transfected with common p21cip1. The top of the bars represent the mean. The error bars represent the SEM. Analysis was carried out from 8 technical replicates of more than 5000 cells each.
Figure 10
Figure 10. The effect of the p21cip1 genotype on the cell cycle and apoptotic activity.
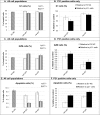
Panel A: The fraction of cells in the G1 phase of the cell cycle (from the euploid population) in the different cell populations. EV NC: empty vector negative control; com p21: the common p21cip1; var p21: variant p21cip1. For the cells transfected with p21cip1: the light grey bars represent the non-transfected cells (cells negative for p21cip1, p21-) and the dark grey bars represent the transfected cells (cells that were positive for p21cip1, p21+). The top of the bars represent the mean. The error bars represent the SEM. Panel B: p21 positive cells only. The fraction of cells in the G1 phase of the cell cycle normalised to control. EV NC: empty vector negative control. P21-: non-transfected cell population within the same wells. White bars: p21 positive population as a percentage of the EV NC (100% represents G1 fraction identical to that seen in EV NC cultures). Black bars: p21 positive population as percentage of the p21- population (100% represents G1 fraction identical to that seen in p21- cells). X-axis: com p21: the common p21cip1; var p21: variant p21cip1. The top of the bars represent the mean. The error bars represent the SEM. Panel C: The fraction of cells in the G2 phase of the cell cycle (from the euploid population) in the different cell populations. EV NC: empty vector negative control; com p21: the common p21cip1; var p21: variant p21cip1. For the cells transfected with p21cip1: the light grey bars represent the non-transfected cells (cells negative for p21cip1, p21-) and the dark grey bars represent the transfected cells (cells that were positive for p21cip1, p21+). The top of the bars represent the mean. The error bars represent the SEM. Panel D: p21 positive cells only. The fraction of cells in the G2 phase of the cell cycle normalised to control. EV NC: empty vector negative control. P21-: non-transfected cell population within the same wells. White bars: p21 positive population as a percentage of the EV NC (100% represents G2 fraction identical to that seen in EV NC cultures). Black bars: p21 positive population as percentage of the p21- population (100% represents G2 fraction identical to that seen in p21- cells). X-axis: com p21: the common p21cip1; var p21: variant p21cip1. The top of the bars represent the mean. The error bars represent the SEM. Panel E: The fraction of apoptotic cells (from single cell population) in the different cell populations. EV NC: empty vector negative control; com p21: the common p21cip1; var p21: variant p21cip1. For the cells transfected with p21cip1: the light grey bars represent the non-transfected cells (cells negative for p21cip1, p21-) and the dark grey bars represent the transfected cells (cells that were positive for p21cip1, p21+). The top of the bars represent the mean. The error bars represent the SEM. Panel F: p21 positive cells only. The fraction of apoptotic cells normalised to control. EV NC: empty vector negative control. P21-: non-transfected cell population within the same wells. White bars: p21 positive population as a percentage of the EV NC (100% represents apoptotic fraction identical to that seen in EV NC cultures). Black bars: p21 positive population as percentage of the p21- population (100% represents apoptotic fraction identical to that seen in p21- cells). X-axis: com p21: the common p21cip1; var p21: variant p21cip1. The top of the bars represent the mean. The error bars represent the SEM. Analysis was carried out from 8 technical replicates of more than 5000 cells each.
Figure 11
Figure 11. The effect of the p21cip1 genotype on beta-actin expression.
The graph shows the amount of beta-actin detected per cell expressed as a percentage change relative to the empty vector negative control. Beta-actin expression was determined by Acumen Cytometry with beta-actin immunostaining: with the total amount of beta-actin detected divided by the total number of cells in the sample. The cells were not double stained for p21cip1 protein, so we were unable to differentiate the p21cip1 positive population (transfected cells) from the p21cip1 negative population (non-transfected cells). X-axis: EV NC: Empty vector negative control; com p21: cells transfected with common p21cip1; var p21: cells transfected with variant p21cip1. The y-axis represents the percentage change in beta-actin expression per cell relative to the EV NC. The top of the bars represent the mean. The error bars represent the SEM.

Similar articles

Cited by

References

    1. Ballard C, Gauthier S, Corbett A, Brayne C, Aarsland D, et al. (2011) Alzheimer’s disease. Lancet 377: 1019–1031. - PubMed
    1. Gatz M, Reynolds CA, Fratiglioni L, Johansson B, Mortimer JA, et al. (2006) Role of genes and environments for explaining Alzheimer disease. Arch Gen Psychiatry 63: 168–174. - PubMed
    1. Abraham R, Moskvina V, Sims R, Hollingworth P, Morgan A, et al. (2008) A genome-wide association study for late-onset Alzheimer’s disease using DNA pooling. BMC Med Genomics 1: 44 10.1186/1755-8794-1-44 - DOI - PMC - PubMed
    1. Beecham GW, Martin ER, Li YJ, Slifer MA, Gilbert JR, et al. (2009) Genome-wide association study implicates a chromosome 12 risk locus for late-onset Alzheimer disease. Am J Hum Genet 84: 35–43. 10.1016/j.ajhg.2008.12.008 - DOI - PMC - PubMed
    1. Bertram L, Lange C, Mullin K, Parkinson M, Hsiao M, et al. (2008) Genome-wide association analysis reveals putative Alzheimer’s disease susceptibility loci in addition to APOE. Am J Hum Genet 83: 623–632. 10.1016/j.ajhg.2008.10.008 - DOI - PMC - PubMed

Publication types

Substances