. 2015 Jan 27;13(1):e1002041.
doi: 10.1371/journal.pbio.1002041. eCollection 2015 Jan.

Natural variation in preparation for nutrient depletion reveals a cost-benefit tradeoff

Affiliations

Natural variation in preparation for nutrient depletion reveals a cost-benefit tradeoff

Jue Wang et al. PLoS Biol. .

Abstract

Maximizing growth and survival in the face of a complex, time-varying environment is a common problem for single-celled organisms in the wild. When offered two different sugars as carbon sources, microorganisms first consume the preferred sugar, then undergo a transient growth delay, the "diauxic lag," while inducing genes to metabolize the less preferred sugar. This delay is commonly assumed to be an inevitable consequence of selection to maximize use of the preferred sugar. Contrary to this view, we found that many natural isolates of Saccharomyces cerevisiae display short or nonexistent diauxic lags when grown in mixtures of glucose (preferred) and galactose. These strains induce galactose utilization (GAL) genes hours before glucose exhaustion, thereby "preparing" for the transition from glucose to galactose metabolism. The extent of preparation varies across strains, and seems to be determined by the steady-state response of GAL genes to mixtures of glucose and galactose rather than by induction kinetics. Although early GAL gene induction gives strains a competitive advantage once glucose runs out, it comes at a cost while glucose is still present. Costs and benefits correlate with the degree of preparation: strains with higher expression of GAL genes prior to glucose exhaustion experience a larger upfront growth cost but also a shorter diauxic lag. Our results show that classical diauxic growth is only one extreme on a continuum of growth strategies constrained by a cost-benefit tradeoff. This type of continuum is likely to be common in nature, as similar tradeoffs can arise whenever cells evolve to use mixtures of nutrients.


Conflict of interest statement

The authors have declared that no competing interests exist.

Figures

Figure 1
Figure 1. Natural yeast strains vary in length of diauxic lag.
(A) Schematic of growth curve experiment in “diauxic growth conditions,” defined as batch culture in synthetic minimal medium with 0.25% glucose and 0.25% galactose. (B) Growth curves (OD600 versus time relative to diauxic shift) plotted top-to-bottom in order of increasing diauxic lag. A single replicate growth curve is shown for each of 11 strains with similar growth rates in galactose-only medium. (Growth curves for both replicates of all 43 strains assayed are shown in S1 Fig.) Strains BC187 and YJM978 are highlighted in blue and red, respectively. (C) Smoothed growth rate versus time relative to diauxic shift for the same strains as in (B). Example plots of raw OD600 differentials (light blue and light red lines) used to obtain the smoothed growth rate are shown for BC187 and YJM978. Diauxic lag time metric is denoted by horizontal black line with circles (see also S2 Fig.). (D) Histogram of diauxic lag time across all natural isolates assayed. Data used for histogram are the mean of two replicates (Materials and Methods).
Figure 2
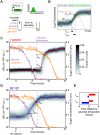
Figure 2. A short-lag strain induces GAL genes hours before the diauxic shift.
(A) Top: Schematic of GAL1pr-YFP transcriptional reporter and cartoon of fluorescence distribution as measured by flow cytometry. Bottom: Schematic of diauxic growth GAL gene induction experiment. (B) Definitions of induction metrics, t low and t high, when reporter expression is at low but above-basal or near-maximal levels, respectively. Diauxic growth for strains (C) YJM978 and (D) BC187, with GAL reporter expression distributions (gray shading), GAL reporter median (red line), glucose concentration (purple circles), and galactose concentration (orange circles). Time is defined relative to the moment when the culture achieves a density of 106 cells/ml (S4 Fig.). Purple and orange lines are smoothing-spline fits to glucose and galactose measurements. Dotted purple line indicates time of glucose exhaustion, calculated using a local linear fit (Materials and Methods). Data shown in (B) and (C) represent two replicate experiments. GAL reporter expression distribution is shown for only one of the two replicates. (E) Comparison of induction start time, t low, and near-maximal induction time, t high, for YJM978 (red bars) and BC187 (blue bars) cultures. Bars and error bars represent the mean and range, respectively, of two replicates.
Figure 3
Figure 3. Diauxic lag time is correlated with the start time of GAL gene induction.
(A) Schematic of co-culture GAL gene induction experiment. Each of 15 query strains (gray) are co-cultured with reference strain YJM978 expressing constitutive mCherry marker (red), and sampled for flow cytometry every 15 min from mid-exponential phase until saturation. (B) Illustration of how preparation time and execution time metrics are defined. (C) Median GAL1pr-YFP expression versus time for query (gray) and reference (red) strain in three co-cultures selected to illustrate a range of preparation times. Strain I14 had above-basal reporter expression at the start of sampling, so its execution time was computed by linear extrapolation. (D) Scatterplot of diauxic lag time (from Fig. 1) versus preparation time. (E) Scatterplot of diauxic lag time versus execution time. Inset: Scatterplot of preparation time versus execution time. Dotted gray lines in (D) and (E) indicate least-squares linear fits used to calculate coefficients of determination (R 2) and p-values. Data for diauxic lag time are the mean and range of two replicates, and for preparation time and execution time are the mean and SEM of three replicates.
Figure 4
Figure 4. Diauxic lag time correlates poorly with GAL gene induction kinetics but strongly with steady-state GAL gene expression in a glucose–galactose mixture.
(A) Median GAL1pr-YFP expression versus time for BC187 (blue line), YJM978 (red line), and 13 other strains (gray lines) after transfer from 2% glucose into 2% galactose. (B) Scatterplot of preparation time (from Fig. 3) versus induction delay after glucose-to-galactose shift, defined as the time until median GAL gene expression reaches 2-fold above basal expression. Black triangle indicates strain YJM981, which did not induce above background during the entire 18-h experiment; this strain was omitted from the R 2 calculation. (C) Scatterplot of diauxic lag time (from Fig. 1) versus induction delay after glucose-to-galactose shift. (D) Top: Schematic of how sugar concentrations for steady-state measurements were chosen from the diauxic growth experiment. Bottom: Measured steady-state GAL1pr-YFP expression distributions for BC187, YJM978, and 13 other strains in 0.0625% glucose + 0.25% galactose. (E) Scatterplot of preparation time versus mean steady-state GAL1pr-YFP expression from (D). (F) Scatterplot of diauxic lag time versus mean steady-state GAL1pr-YFP expression from (D). Dotted gray lines in (B), (C), (E), and (F) indicate least-squares linear fits used to calculate coefficients of determination (R 2) and p-values. Diauxic lag time data are the mean and SEM of two replicates; preparation time and steady-state GAL1pr-YFP expression are the mean and SEM of three replicates. Induction delay after medium shift is plotted as one replicate.
Figure 5
Figure 5. Preparation for glucose exhaustion has upfront cost and delayed benefit.
(A) Log2-ratio of BC187 cell number versus YJM978 cell number versus time during diauxic growth in two replicate co-cultures. A positive value on the vertical axis at any given moment indicates that BC187 has divided more times than YJM978 since time = 0, and therefore has a net fitness advantage. Raw data (black circles) and smoothing splines (gray curves) are shown for two replicates. (B) Median GAL1pr-YFP expression of BC187 (blue lines) and YJM978 (red lines), glucose concentration (purple circles and lines), and galactose concentration (orange circles and lines) from (A). Vertical dotted gray lines in (A) and (B) demarcate four phases of relative fitness and GAL1pr-YFP expression during the experiment (see Results). (C) Comparison of growth rate differences during diauxic growth versus steady-state sugar conditions. Data points on shaded backgrounds and labeled “diauxic growth” represent the slope of the data in (A) during Phase II (pink background) and Phase III (blue background). Positive values indicate that BC187 grows faster than YJM978. Data are the mean and SEM of n = 6 (Phase II) or n = 14 (Phase III) discrete derivatives in the shaded regions from (A). Points on a white background and labeled “steady-state” are computed from the same data as in S12C Fig., and represent the mean and SEM of 3–6 replicates. p-Values are computed by two-sample t-test.
Figure 6
Figure 6. Synthetic induction of GAL genes is costly in glucose but beneficial during transition to galactose.
(A) Strains S288C (WT) and S288C-GEV, a congenic strain expressing the GEV protein, were used. Both WT and GEV strains induce GAL genes in response to galactose; strain GEV also induces GAL genes in response to β-estradiol. For technical reasons, two variants of the WT strain were used; each strain is haploid and its HO locus has been replaced with either a GAL1pr-YFP reporter (SLYA39) or a constitutive mCherry segmentation marker (SLYA32). (B) GAL1pr-YFP expression histograms of strains WT (SLYA39) (black) and GEV (green) at steady state in 2% glucose, 2% glucose + 30 nM β-estradiol, or 2% galactose. The same concentrations were used in the following experiments. (C) Top: log2 ratio of GEV to WT (SLYA32) cell counts during steady-state co-culture in glucose (purple) or glucose + β-estradiol (black). Bottom: median GAL1pr-YFP expression of strain WT during this experiment. (D) Top: log2 ratio of GEV to WT (SLYA32) cell counts upon sudden shift to galactose, after pre-growth in glucose (purple) or glucose + β-estradiol (black). Bottom: median GAL1pr-YFP expression of strain GEV during this experiment. (E) Top: log2 ratio of cell counts of WT strain SLYA39 and SLYA32 after pre-growth in different conditions and shift to galactose medium. Before the medium shift, the strains were either both preconditioned in glucose (purple), or the query strain (SLYA39; numerator of log ratio) was preconditioned in galactose while the reference strain (SLYA32; denominator of log ratio) was preconditioned in glucose (black). The black line from (D) is reproduced in gray in (E) to compare synthetic and “natural” pre-induction of GAL genes. Bottom: median GAL1pr-YFP expression of the query strain (SLYA39) during this experiment. Data in (C–E) are mean and SEM of three replicates. *p = 0.008, **p = 0.01 for change in log2 strain ratio by two-sample t-test. n.s., not significant (p > 0.05).
Figure 7
Figure 7. Tradeoff between costs and benefits of preparation underlies natural variation in GAL pathway expression.
(A) Illustration of how galactose cost (top) and the minimum mid-diauxic growth rate (bottom) are defined (see also S2 and S14 Figs., and Materials and Methods). Glucose and glucose + galactose conditions indicate 0.03125% glucose and 0.3125% glucose + 0.25% galactose media, respectively. (B) Scatterplot of galactose cost versus mean GAL1pr-YFP expression at steady state in glucose + galactose. Data points are mean and SEM of n = 3 replicates. (C) Scatterplot of galactose cost versus minimum mid-diauxic growth rate. The latter is computed from the growth curves shown in Figs. 1 and S1. Data points are the mean and SEM of n = 3 replicates (galactose cost) or mean and range of n = 2 replicates (minimum rate).

References

    1. Dekel E, Alon U (2005) Optimality and evolutionary tuning of the expression level of a protein. Nature 436: 588–592. 10.1038/nature03842 - DOI - PubMed
    1. Poelwijk FJ, de Vos MGJ, Tans SJ (2011) Tradeoffs and optimality in the evolution of gene regulation. Cell 146: 462–470. 10.1016/j.cell.2011.06.035 - DOI - PubMed
    1. Lang GI, Murray AW, Botstein D (2009) The cost of gene expression underlies a fitness trade-off in yeast. Proc Natl Acad Sci U S A 106: 5755–5760. 10.1073/pnas.0901620106 - DOI - PMC - PubMed
    1. Scott M, Mateescu EM, Zhang Z, Hwa T, Gunderson CW (2010) Interdependence of cell growth and gene expression: origins and consequences. Science 330: 1099–1102. 10.1126/science.1192588 - DOI - PubMed
    1. Perkins TJ, Swain PS (2009) Strategies for cellular decision-making. Mol Syst Biol 5: 326 10.1038/msb.2009.83 - DOI - PMC - PubMed

Publication types

MeSH terms