. 2015 Jan 27;6(1):e02456-14.
doi: 10.1128/mBio.02456-14.

A hierarchical cascade of second messengers regulates Pseudomonas aeruginosa surface behaviors

Affiliations

A hierarchical cascade of second messengers regulates Pseudomonas aeruginosa surface behaviors

Yun Luo et al. mBio. .

Abstract

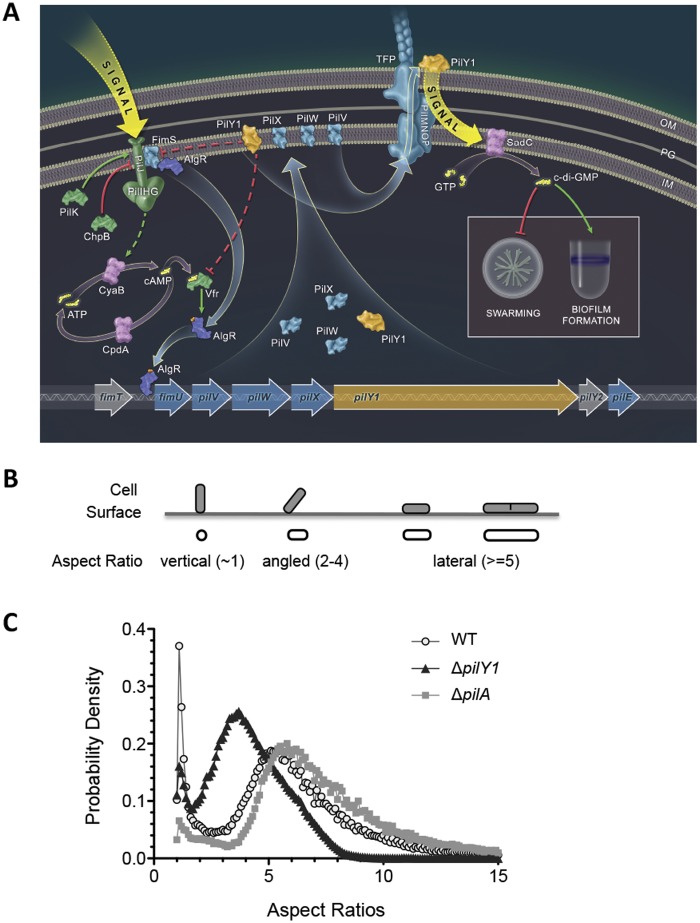
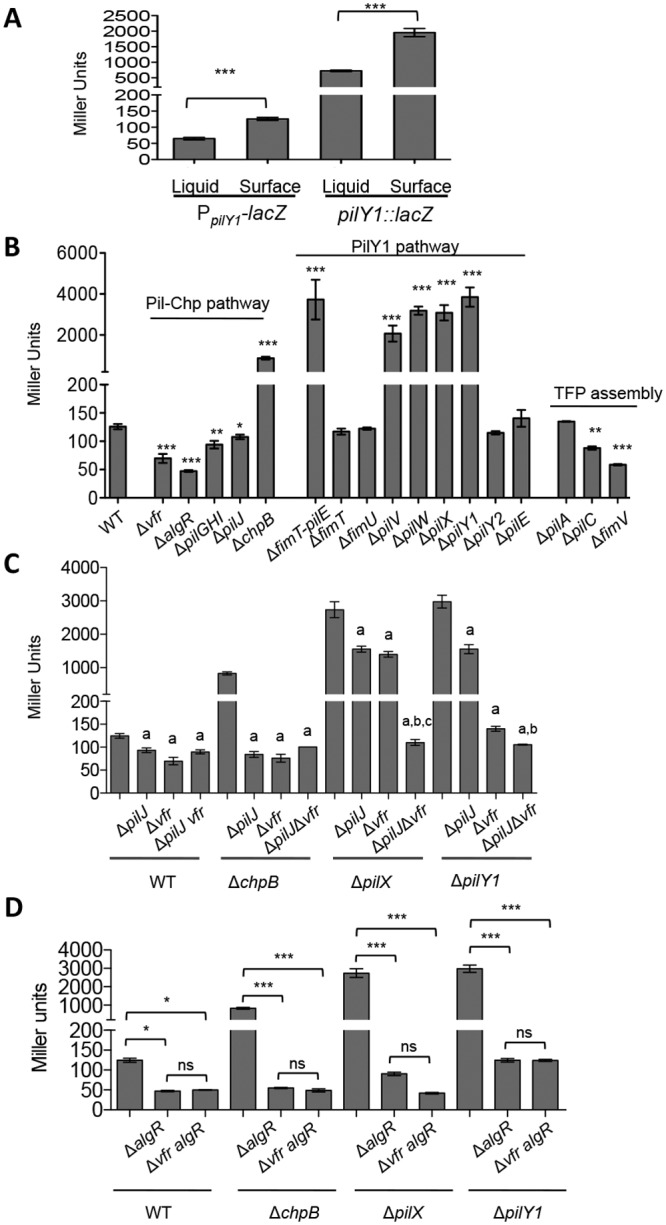
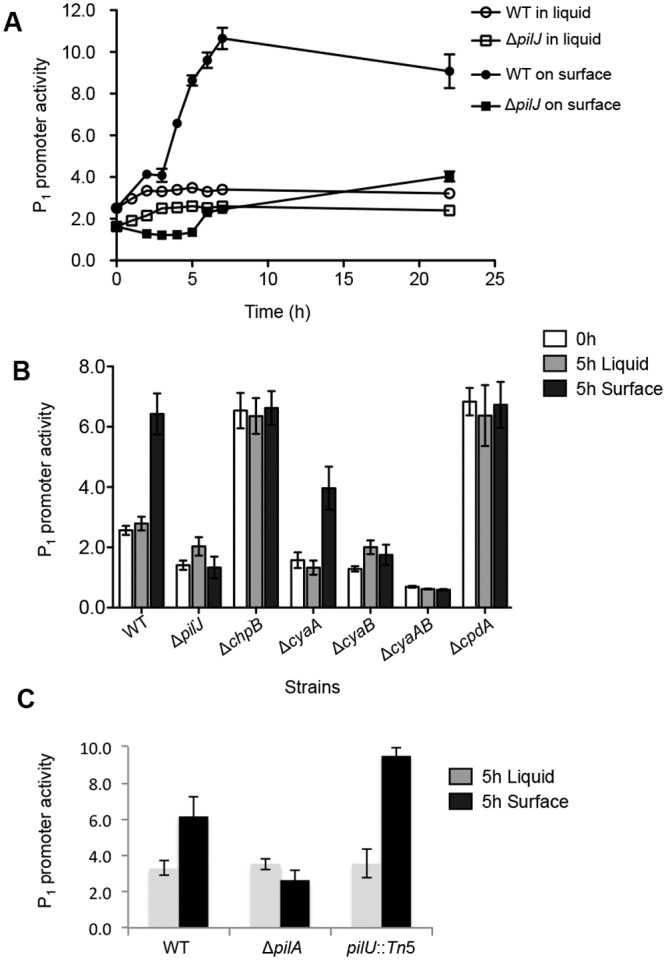
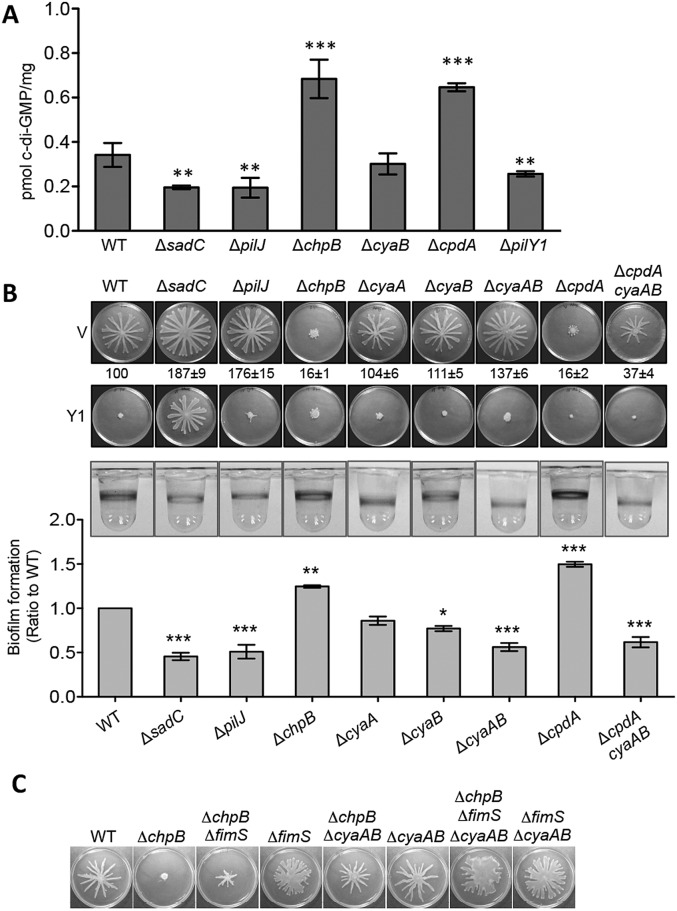
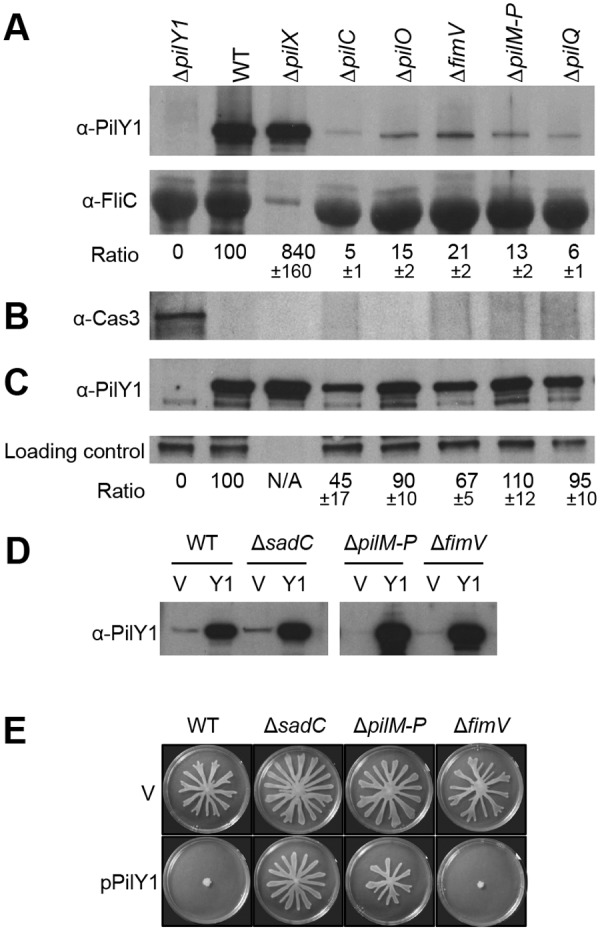
Biofilms are surface-attached multicellular communities. Using single-cell tracking microscopy, we showed that a pilY1 mutant of Pseudomonas aeruginosa is defective in early biofilm formation. We leveraged the observation that PilY1 protein levels increase on a surface to perform a genetic screen to identify mutants altered in surface-grown expression of this protein. Based on our genetic studies, we found that soon after initiating surface growth, cyclic AMP (cAMP) levels increase, dependent on PilJ, a chemoreceptor-like protein of the Pil-Chp complex, and the type IV pilus (TFP). cAMP and its receptor protein Vfr, together with the FimS-AlgR two-component system (TCS), upregulate the expression of PilY1 upon surface growth. FimS and PilJ interact, suggesting a mechanism by which Pil-Chp can regulate FimS function. The subsequent secretion of PilY1 is dependent on the TFP assembly system; thus, PilY1 is not deployed until the pilus is assembled, allowing an ordered signaling cascade. Cell surface-associated PilY1 in turn signals through the TFP alignment complex PilMNOP and the diguanylate cyclase SadC to activate downstream cyclic di-GMP (c-di-GMP) production, thereby repressing swarming motility. Overall, our data support a model whereby P. aeruginosa senses the surface through the Pil-Chp chemotaxis-like complex, TFP, and PilY1 to regulate cAMP and c-di-GMP production, thereby employing a hierarchical regulatory cascade of second messengers to coordinate its program of surface behaviors.

Importance: Biofilms are surface-attached multicellular communities. Here, we show that a stepwise regulatory circuit, involving ordered signaling via two different second messengers, is required for Pseudomonas aeruginosa to control early events in cell-surface interactions. We propose that our studies have uncovered a multilayered "surface-sensing" system that allows P. aeruginosa to effectively coordinate its surface-associated behaviors. Understanding how cells transition into the biofilm state on a surface may provide new approaches to prevent formation of these communities.


Figures

FIG 1
FIG 1
A role for PilY1 in regulation of surface behaviors. (A) Model for surface behavior regulation in P. aeruginosa. From left to right, a surface-associated signal activates the Pil-Chp complex and induces the production of cAMP through CyaB. CyaB, a putative membrane-associated protein, was illustrated as a cytoplasmic protein due to space restriction. cAMP, together with its receptor Vfr, regulates transcription at the fimS-algR locus. AlgR-P (the phosphate indicated by the red dot) directly binds the pilY1 operon promoter region and activates its transcription. FimS and PilJ physically interact, and we propose that PilJ may act via the FimS-AlgR two-component system, along with cAMP-Vfr, to stimulate production of and autoregulate pilY1 gene expression. PilY1 and minor pilins PilVWX are localized to the inner membrane (IM), where they feedback inhibit their own expression via PilJ, Vfr, and AlgR-FimS. PilY1 is also secreted to the cell surface through the TFP apparatus and remains associated with the outer membrane (OM). The external PilY1 can signal through components of TFP alignment complex PilMNOP and induce SadC activity. SadC synthesizes c-di-GMP, leading to promotion of biofilm formation and repression of swarming motility. Straight arrows indicate activation, and T arrows are inhibition. Solid arrows indicate direct regulation, and dashed arrows indicate indirect regulation. Illustration courtesy of William Scavone, Kestrel Studio, reprinted with permission. (B) Schematic illustration of the aspect ratio. The aspect ratio is calculated as cell length (as it is projected on the surface) divided by the projected cell width. The cell orientation and relative aspect ratios were defined based on the measurements with WT cells. Since cells were visualized with a camera that was oriented 90° to the attachment surface, cells show “stadium-shaped” contour (aspect ratio of ≥5, as in the WT) when they are perfectly horizontal and irreversibly attached and circular contour (aspect ratio of ~1) when they are perfectly vertical and reversibly attached. There are a large number of cells that exhibit behavior between these two limiting cases and have different tilt angles (between 0 and 90°) with respect to the surface; therefore, intermediate aspect ratios are observed. Besides cell attachment angles, the aspect ratio can also be affected by cell growth. For example, a dividing cell has longer cell length than a nondividing cell and hence a larger aspect ratio. (C) Shown are the aspect ratio histograms plotted as probability density versus aspect ratio of the indicated strain. Bin size = 0.1.
FIG 2
FIG 2
β-Galactosidase activities of PpilY1-lacZ transcriptional reporter in various strain backgrounds. All strains were grown overnight on an M8 agar plate (1% agar); M8 medium is the standard swarm medium used and thus was used throughout our studies. The data represent a minimum of three independent experiments with two biological replicates each, and values are reported as means ± standard errors of the mean (SEM). (A) β-Galactosidase activities of the transcriptional reporter PpilY1-lacZ and the translational reporter pilY1::lacZ. Cells were grown in liquid M8 minimal medium or on the surface of M8 minimal medium supplemented with 1% agar. The data represent a minimal of three independent experiments with two biological replicates each, and values are reported as means ± SEM. Significance was determined by one-way analysis of variance (ANOVA) followed by a Tukey posttest comparison. ***, P < 0.001. (B) Pathways involved in pilY1 expression. Expression of the pilY1-lacZ fusion is presented as Miller units, for mutants in the Pil-Chp and PilY1 pathways and TFP assembly. Significance was determined by one-way ANOVA followed by a Dunnett posttest comparison for the difference between WT and individual mutants. *, P < 0.05; ***, P < 0.001. (C) Epistasis analysis with the vfr mutant. Expression of the pilY1-lacZ fusion is presented as Miller units for the mutants indicated. Statistical analyses were performed using one-way ANOVA followed by a Tukey posttest comparison, P < 0.05. a, significant difference between the ΔpilJ, Δvfr, or ΔpilJ vfr mutant and the parental strain; b, significant difference between the ΔpilJ and ΔpilJ vfr mutants in the same strain background; c, significant difference between the Δvfr and ΔpilJ vfr mutants in the same strain background. (D) Epistasis analysis with the algR mutant. Expression of the pilY1-lacZ fusion is presented as Miller units for the mutants indicated. Statistical analyses were performed by one-way ANOVA followed by a Tukey posttest comparison. *, P < 0.05; ***, P < 0.001; ns, no significant difference.
FIG 3
FIG 3
The cellular cAMP levels in cells grown in liquid broth and on agar surface. (A) Representative time lapse plot of cAMP levels in cells grown in liquid broth or on an agar surface with the same base medium (M8). The cellular cAMP level is expressed as P1-lacZ activity divided by the vector control. The means ± SEM from three biological replicates were shown. (B) cAMP levels in the WT and mutant strains grown in M8 liquid broth or on agar surface. Each strain was grown to early log phase in M8 broth. At time = 0 h, the cultures were split and either continued to be incubated in M8 broth or spread on M8 plate (1% agar) for an additional 5 h. The data represent a minimum of three independent experiments with two biological replicates each, and values are reported as means ± SEM. (C) cAMP levels in the WT and mutant strains grown in M8 liquid broth or on agar surface, performed as outlined in panel B.
FIG 4
FIG 4
cAMP functions upstream of c-di-GMP in surface behavior regulation. (A) Quantification of cellular c-di-GMP levels by liquid chromatography-mass spectrometry (LC-MS) for the indicated strains grown on swarm plates. Data are expressed as picomoles of c-di-GMP per milligram (dry weight) of the cell pellets from which the nucleotides were extracted. The data represent six independent experiments, and values are reported as means ± SEM. Significance was determined by one-way ANOVA followed by a Dunnett posttest comparison for the difference between WT and individual mutants. **, P < 0.01; ***, P < 0.001. (B) Surface behaviors of mutants in the cAMP-Vfr pathway. Top and middle panels are representative swarm plates of strains carrying either empty vector (V) or PilY1-expressing plasmid (Y1). Plates contained 0.2% arabinose. The ratio numbers below the top panel indicate the percentage (means ± SEM, from 20 plates) of the plate surface coverage of the mutant strains (harboring empty vectors) relative to that of the WT strain (set at 100%). The bottom panel shows representative wells of a 96-well biofilm assay for each strain. The biofilm ratios (mutant/WT) were calculated using the WT and mutant strains grown in the same 96-well plate. The means and SEM from three independent experiments are reported. Significance was determined by one-way ANOVA followed by a Dunnett posttest comparison for the difference between WT and individual mutants. *, P < 0.05; **, P < 0.01; ***, P < 0.001. (C) Swarms of the indicated strains grown on M8 agar plate containing 0.5% agar.
FIG 5
FIG 5
The TFP complex is involved in PilY1 secretion and signaling. (A) Detection of PilY1 in cell surface (CS) fractions. The CS protein samples were concentrated using TCA precipitation before loading. Western blots were probed with anti-PilY1 antibody (top) or anti-FliC antibody (middle). Strains tested in all blots are indicated at the top of panel A. FliC (flagellin) served as a cell surface protein marker and a protein loading control. The intensity of the PilY1 protein band is normalized to FliC. The ratio numbers below each band represent the percentage (means ± standard deviations [SD], from three experiments) of the normalized PilY1 in mutants relative to that in the WT strain (lane 2). (B) Western blot probed with anti-Cas3 antibody (bottom) was included as a cytoplasmic protein control. Lane 1, whole-cell lysate from WT cells; lanes 2 to 8, the same cell surface fraction samples used in lanes 2 to 8 in the top and middle panels. (C) Detection of PilY1 in whole-cell lysate. An unknown protein cross-reacting with anti-PilY1 antibody served as a protein-loading control. The strains analyzed here are indicated at the top of panel A. The experiment was repeated three times, and one representative gel was shown. The ratio is calculated as the percentage of normalized PilY1 intensity relative to that in the WT strain and is reported as means ± SD from three experiments. Note: in panels A and C, the protein extracts from the ΔpilX strain (lane 3) were diluted 10-fold before loading. (D) Assessment of PilY1 protein levels in the unconcentrated CS fraction. Strains carrying either empty vector (V) or the pilY1-expressing plasmid pPilY1 (Y1) were grown on an M8 agar plate containing 1% agar and 0.2% arabinose. (E) Swarms of the indicated strains grown on an M8 agar plate containing 0.5% agar and 0.2% arabinose.

References

    1. Monds RD, O’Toole GA. 2009. The developmental model of microbial biofilms: ten years of a paradigm up for review. Trends Microbiol 17:73–87. doi:10.1016/j.tim.2008.11.001. - DOI - PubMed
    1. Conrad JC, Gibiansky ML, Jin F, Gordon VD, Motto DA, Mathewson MA, Stopka WG, Zelasko DC, Shrout JD, Wong GC. 2011. Flagella and pili-mediated near-surface single-cell motility mechanisms in P. aeruginosa. Biophys J 100:1608–1616. doi:10.1016/j.bpj.2011.02.020. - DOI - PMC - PubMed
    1. Gibiansky ML, Conrad JC, Jin F, Gordon VD, Motto DA, Mathewson MA, Stopka WG, Zelasko DC, Shrout JD, Wong GC. 2010. Bacteria use type IV pili to walk upright and detach from surfaces. Science 330:197. doi:10.1126/science.1194238. - DOI - PubMed
    1. Merritt JH, Ha DG, Cowles KN, Lu W, Morales DK, Rabinowitz J, Gitai Z, O’Toole GA. 2010. Specific control of Pseudomonas aeruginosa surface-associated behaviors by two c-di-GMP diguanylate cyclases. mBio 1(4):e00183-10. doi:10.1128/mBio.00183-10. - DOI - PMC - PubMed
    1. Römling U, Galperin MY, Gomelsky M. 2013. Cyclic di-GMP: the first 25 years of a universal bacterial second messenger. Microbiol Mol Biol Rev 77:1–52. doi:10.1128/MMBR.00043-12. - DOI - PMC - PubMed

Publication types

MeSH terms

LinkOut - more resources