Comparative Study
. 2015 Jan 28;10(1):1.
doi: 10.1186/s13064-014-0028-0.

Quantitative differences in developmental profiles of spontaneous activity in cortical and hippocampal cultures

Affiliations
Comparative Study

Quantitative differences in developmental profiles of spontaneous activity in cortical and hippocampal cultures

Paul Charlesworth et al. Neural Dev. .

Abstract

Background: Neural circuits can spontaneously generate complex spatiotemporal firing patterns during development. This spontaneous activity is thought to help guide development of the nervous system. In this study, we had two aims. First, to characterise the changes in spontaneous activity in cultures of developing networks of either hippocampal or cortical neurons dissociated from mouse. Second, to assess whether there are any functional differences in the patterns of activity in hippocampal and cortical networks.

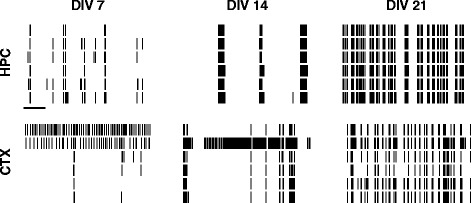
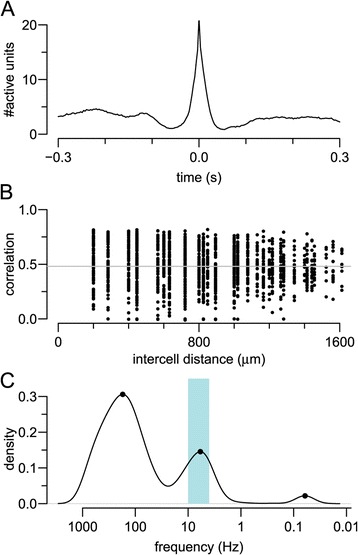
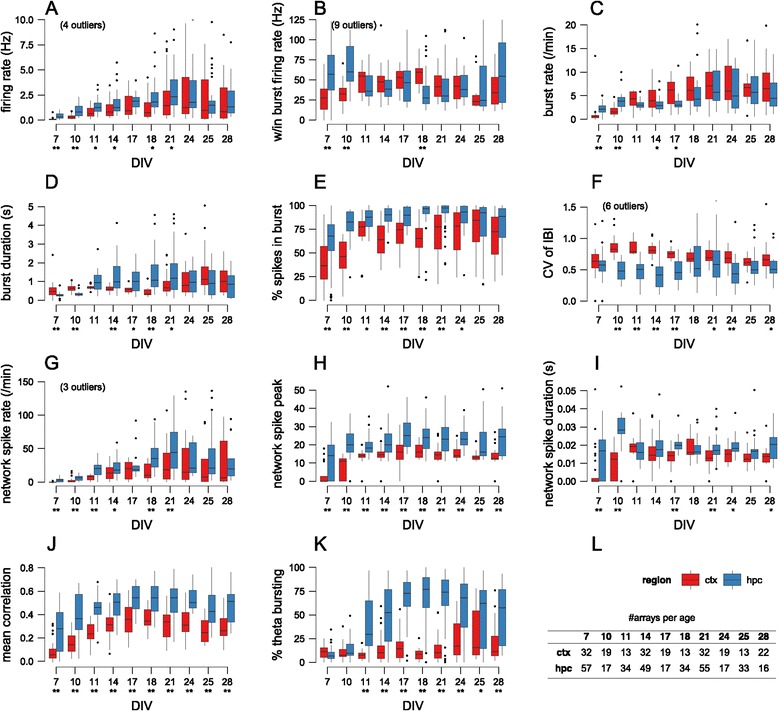
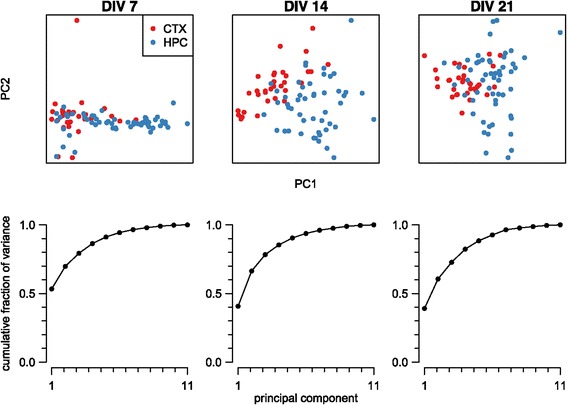
Results: We used multielectrode arrays to record the development of spontaneous activity in cultured networks of either hippocampal or cortical neurons every 2 or 3 days for the first month after plating. Within a few days of culturing, networks exhibited spontaneous activity. This activity strengthened and then stabilised typically around 21 days in vitro. We quantified the activity patterns in hippocampal and cortical networks using 11 features. Three out of 11 features showed striking differences in activity between hippocampal and cortical networks: (1) interburst intervals are less variable in spike trains from hippocampal cultures; (2) hippocampal networks have higher correlations and (3) hippocampal networks generate more robust theta-bursting patterns. Machine-learning techniques confirmed that these differences in patterning are sufficient to classify recordings reliably at any given age as either hippocampal or cortical networks.

Conclusions: Although cultured networks of hippocampal and cortical networks both generate spontaneous activity that changes over time, at any given time we can reliably detect differences in the activity patterns. We anticipate that this quantitative framework could have applications in many areas, including neurotoxicity testing and for characterising the phenotype of different mutant mice. All code and data relating to this report are freely available for others to use.


Figures

Figure 1
Figure 1
Examples of spontaneous activity in developing cultures. Top row: Hippocampal (HPC) cultures. Bottom row: Cortical (CTX) cultures. Each column represents one day in vitro (DIV). Within each raster plot, one row represents the spike train from one electrode; six (out of typically 59) electrodes are shown. Scale bar for all rasters is 10 s. CTX, cortex; DIV, days in vitro; HPC, hippocampus.
Figure 2
Figure 2
Examples of features calculated for each recording. The hippocampal recording from 14 DIV in Figure 1 was used as an example for this figure. (A) Mean network spike. (B) Pairwise correlation calculated using the spike time tiling coefficient. As there is weak dependence on distance, we take the mean (grey solid line). (C) Detection of theta bursting on an electrode with a firing rate close to the median activity on the array. DIV, days in vitro.
Figure 3
Figure 3
Characterisation of spontaneous activity in hippocampal and cortical networks. (A–K) Values of one feature (named on the y-axis) as a function of age. Box plots show the median and interquartile range, with whiskers extending out to the most extreme values within 1.5 times the interquartile range. Individual points outside this range are regarded as outliers and drawn as points; in a few cases these outliers are not drawn to keep the y-axis within a meaningful range. Underneath each age, stars denote significant difference of median values for cortical and hippocampal networks at either 0.05 (*) or 0.01 (**) level (Mann–Whitney test, with P values corrected for multiple comparisons with false discovery rate method). (L) Number of arrays analysed at each age. CTX, cortex; CV, coefficient of variation; DIV, days in vitro; HPC, hippocampus; IBI, interburst interval; w/in, within.
Figure 4
Figure 4
Principal component analysis of hippocampal and cortical feature vectors. Each column represents a principal component analysis of the 11-dimensional feature vectors of all recordings at a given age (days in vitro). In the scatter plot, each point represents one recording projected down into the two dimensions that account for maximal variance and is coloured according to its cell type. Each graph shows the cumulative fraction of variance accounted for by the principal components. CTX, cortex; DIV, days in vitro; HPC, hippocampus; PC, principal component.

References

    1. Blankenship AG, Feller MB. Mechanisms underlying spontaneous patterned activity in developing neural circuits. Nat Rev Neurosci. 2010;11:18–29. doi: 10.1038/nrn2759. - DOI - PMC - PubMed
    1. Leinekugel X, Khazipov R, Cannon R, Hirase H, Ben-Ari Y, Buzsáki G. Correlated bursts of activity in the neonatal hippocampus in vivo. Science. 2002;296:2049–52. doi: 10.1126/science.1071111. - DOI - PubMed
    1. Khazipov R, Sirota A, Leinekugel X, Holmes GL, Ben-Ari Y, Buzsáki G. Early motor activity drives spindle bursts in the developing somatosensory cortex. Nature. 2004;432:758–61. doi: 10.1038/nature03132. - DOI - PubMed
    1. Hanganu IL, Ben-Ari Y, Khazipov R. Retinal waves trigger spindle bursts in the neonatal rat visual cortex. J Neurosci. 2006;26:6728–36. doi: 10.1523/JNEUROSCI.0752-06.2006. - DOI - PMC - PubMed
    1. Seelke AMH, Blumberg MS. Developmental appearance and disappearance of cortical events and oscillations in infant rats. Brain Res. 2010;1324:34–42. doi: 10.1016/j.brainres.2010.01.088. - DOI - PMC - PubMed

Publication types

LinkOut - more resources