Review
. 2016 Apr 15;594(8):2207-22.
doi: 10.1113/jphysiol.2014.284513. Epub 2015 Feb 24.

Increased muscle blood supply and transendothelial nutrient and insulin transport induced by food intake and exercise: effect of obesity and ageing

Affiliations
Review

Increased muscle blood supply and transendothelial nutrient and insulin transport induced by food intake and exercise: effect of obesity and ageing

Anton J M Wagenmakers et al. J Physiol. .

Abstract

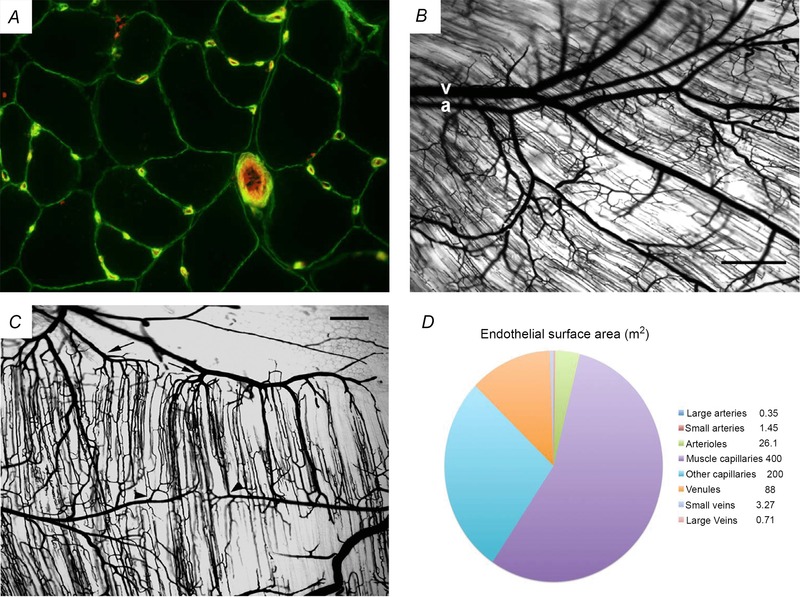
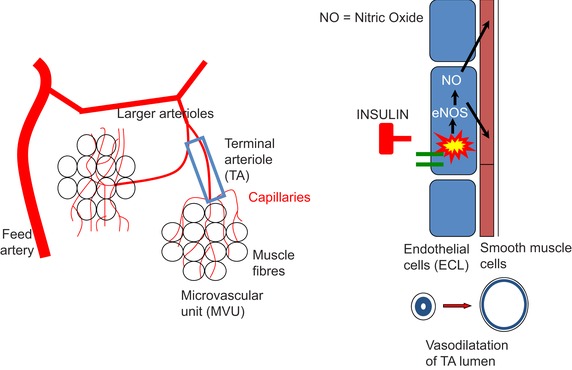
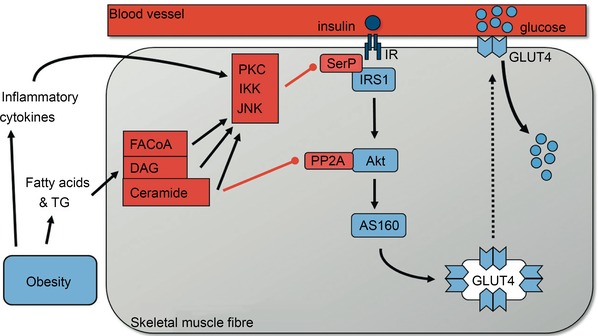
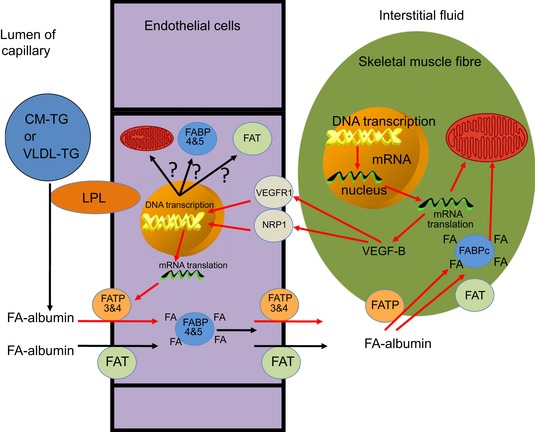
This review concludes that a sedentary lifestyle, obesity and ageing impair the vasodilator response of the muscle microvasculature to insulin, exercise and VEGF-A and reduce microvascular density. Both impairments contribute to the development of insulin resistance, obesity and chronic age-related diseases. A physically active lifestyle keeps both the vasodilator response and microvascular density high. Intravital microscopy has shown that microvascular units (MVUs) are the smallest functional elements to adjust blood flow in response to physiological signals and metabolic demands on muscle fibres. The luminal diameter of a common terminal arteriole (TA) controls blood flow through up to 20 capillaries belonging to a single MVU. Increases in plasma insulin and exercise/muscle contraction lead to recruitment of additional MVUs. Insulin also increases arteriolar vasomotion. Both mechanisms increase the endothelial surface area and therefore transendothelial transport of glucose, fatty acids (FAs) and insulin by specific transporters, present in high concentrations in the capillary endothelium. Future studies should quantify transporter concentration differences between healthy and at risk populations as they may limit nutrient supply and oxidation in muscle and impair glucose and lipid homeostasis. An important recent discovery is that VEGF-B produced by skeletal muscle controls the expression of FA transporter proteins in the capillary endothelium and thus links endothelial FA uptake to the oxidative capacity of skeletal muscle, potentially preventing lipotoxic FA accumulation, the dominant cause of insulin resistance in muscle fibres.


Figures

Figure 1
Figure 1. Structure and anatomy of skeletal muscle microvasculature
A, cross‐sectional image of muscle fibres and their microvasculature. It historically and today still is common practice to use cross‐sectional images of skeletal muscle to visualise and quantify the capillarisation of skeletal muscle fibres. This image shows in green the plasma membrane of the skeletal muscle fibres and the membrane surrounding the ECL of capillaries (visualised with an antibody stain against collagen IV, which is a main component of the basement membrane). The glycocalyx of the capillaries and of the larger 4th order arteriole (approximately 40 μm in diameter) was stained in red with a fluorescent lectin (Ulex europaeus). This unpublished image comes from the collection of Dr Chris Shaw and was obtained by Chris during his PhD with Anton Wagenmakers at the University of Birmingham, UK. B and C show microvascular casts in mouse gluteus maximus muscle. In these whole‐mount preparations, the vasculature was cast using Microfil and muscle fibres were cleared in glycerine to enhance the visibility of microvessels. B shows that the arteriolar and venular networks are paired in skeletal muscle. A 3rd order arteriole (a) and its paired venule (v) both enter at left. Note the proximity of arteriolar–venular segments through the 4th order branches, which then branch into the TAs that supply red blood cells to the capillaries. The ‘shadows’ of parallel muscle fibres and surrounding capillaries are oriented obliquely across the figure. C shows that capillaries are organised into microvascular units (MVUs). TAs (arrowheads indicate 2 of the several that are present) branch off vertically from 4th order arterioles. Each TA gives rise to a group of approximately 20 capillaries. The capillaries in the MVU run half and half in both directions parallel to muscle fibres and have a length of approximately 1 mm. The capillaries converge on collecting venules (arrows indicate 2 of the several that are present). Muscle fibres are transparent in this image. Scale bar in panels B and C = 250 μm. Panels B and C are reproduced with permission of the author and the publisher from Segal (2005), Microcirculation, © John Wiley and Sons. D is a visual representation of the relative size of the endothelial surface area, in square metres, present in arteries, the microvasculature and veins. Every blood vessel in the human vasculature is covered on the luminal side with a continuous monolayer of ECs. About 400 m2 ECL surface is present in skeletal muscle capillaries to generate the transport capacity for oxygen, fuels and hormones that is required to meet the high metabolic demands of skeletal muscle during aerobic exercise via recruitment of additional MVUs (compared to rest) and rhythmic increases in the dilatation of TAs and capillary blood flow in the recruited MVUs (compared to rest).
Figure 2
Figure 2. Insulin‐induced vasodilatation of TAs leads to increased perfusion of muscle capillaries
Meal‐induced increases in the plasma insulin concentration activate an insulin signalling cascade (insulin receptor/IRS1/PI3K/PDK1/Akt/eNOS) that is present in the ECL of the TAs. The end result is an increase in nitric oxide (NO) production. NO is a potent vasodilator acting upon the smooth muscle cell layer in TAs. The simple version of the underlying mechanism is that insulin‐induced increases in vasodilatation of TAs lead to recruitment of additional MVUs and capillaries that were not perfused before ingestion of the meal and therefore explain the observed increase in microvascular perfusion of skeletal muscle. The real mechanism probably is more complex as several studies have shown that the microvascular blood flow in skeletal muscle undergoes rhythmic oscillations attributable to spontaneous changes in the diameter of the TA lumen (Lund et al. 1987; Newman et al. 2009). This phenomenon is called ‘arteriolar vasomotion’. Newman et al. (2009) using laser Doppler flowmetry recently observed that a hyperinsulinaemic euglycaemic clamp in rats increased the arteriolar oscillations. The interpretation of this observation by the authors is that the insulin‐induced increase in microvascular perfusion of skeletal muscle is at least in part due to an increase in the intensity of the vasomotion that occurs in TAs of skeletal muscle. This Figure has been drawn by the authors using data from more than 20 cited references in the paragraphs explaining the anatomy of MVU's and mechanisms in control of blood flow in MVUs to include an earlier anatomical interpretation in Cohen et al. (2000).
Figure 3
Figure 3. Activation of the insulin‐signalling cascade in skeletal muscle
In healthy trained individuals increases in the insulin concentration in the interstitial fluid surrounding muscle fibres leads to increased activation of the insulin signalling cascade and translocation of GLUT4 (main glucose transporter in muscle) to the plasma membrane. As muscle is the main tissue responsible for glucose uptake in the period after meal ingestion this will keep the rise in blood glucose concentration following ingestion of a meal relatively modest. As such healthy trained individuals have firm control on their blood glucose levels, both in the fasted period and after food intake. In sedentary, obese or elderly individuals, and those with metabolic syndrome and type 2 diabetes, high blood levels of fatty acids and triglycerides contribute to an excessive accumulation of lipid metabolites such as long chain fatty acyl‐CoA (FACoA), diacylglycerol (DAG) and ceramide in skeletal muscle. This together with increased plasma levels of inflammatory cytokines in obese individuals (Berg & Scherer, 2005) and local inflammation of the microvasculature in skeletal muscle activates the serine kinases protein kinase C (PKC), IκB kinase (IKK) and Jun amino‐terminal kinase (JNK) (Wagenmakers et al. 2006). These phosphorylate insulin receptor substrate 1 (IRS1) on serine residues SerP leading to inactivation of IRS1 and downstream inactivation of the insulin signalling cascade. Ceramide accumulation also activates the phosphatase PP2A which dephosphorylates and inactivates Akt. These mechanisms collectively prevent activation of the insulin signalling cascade in skeletal muscle and therefore reduce insulin‐mediated activation of Akt substrate of 160 kDa (AS160) and GLUT4 translocation and skeletal muscle glucose uptake. Reproduced with permission from Shaw & Wagenmakers (2012), The Biochemist, © the Biochemical Society.
Figure 4
Figure 4. Schematic illustration of the role of VEGF‐B in matching transendothelial FA transport to skeletal muscle FA oxidation capacity
Hagberg et al. (2010) made the observation that VEGF‐B in mouse skeletal muscle was co‐expressed in a large number of different physiological conditions with a large cluster of nuclear genes encoding for mitochondrial proteins. They subsequently generated strong supportive evidence for the existence of a novel mechanism that couples uptake and transendothelial transport of FA to the capacity of mitochondrial β‐oxidation in skeletal muscle. VEGF‐B produced by skeletal muscle fibres was assumed to be released to the interstitium and then diffuses to the abluminal membrane of ECs in skeletal muscle capillaries, similar to the VEGF‐A release by skeletal muscle during exercise (Hoier & Hellsten, 2014). Here, VEGF‐B binds to its receptors (VEGF receptor 1 (VGRF1) and neuropilin 1 (NRP1)) which are both expressed by the ECs. Signalling of VEGF‐B then leads to the abundant expression of FATP3 and FATP4 in the ECs and incorporation into the luminal and abluminal membrane and is therefore assumed to lead to increased TET of FAs into the muscle interstitium where FAs are bound again to albumin to diffuse to the muscle plasma membrane and to be taken up, transported by the cytosolic fatty acid binding protein (FABPc) and oxidised in the skeletal muscle mitochondria as described by Glatz et al. (2010). The red arrows in this figure indicate the sequential steps in this novel mechanism as proposed by Hagberg et al. (2010). Other studies have shown that FAT/CD36 (Vistisen et al. 2004) and FABP4 and FABP5 (Iso et al. 2013) are also expressed abundantly in ECs and contribute to the high capacity for TET of FAs, but Hagberg et al. 2010 failed to generate evidence that the expression of their genes was under the control of VEGF‐B. It is also tempting to speculate that VEGF‐B controls the expression of the 1500 nuclear‐encoded mitochondrial genes in the ECs as the metabolic rate and protein turnover rate of ECs is potentially high because of repeated exposure to reactive oxygen species (ROS). It also cannot be excluded that some of the TET systems that help to increase endothelial permeability in the postprandial state and during exercise are energy (ATP) dependent (e.g. the insulin transport system which concentrates insulin in the ECs against a concentration gradient). This implies that ECs in trained inviduals should also have a high mitochondrial density to optimally support a high metabolic rate and the various transport functions. LPL, lipoprotein lipase.

Comment in

References

    1. Abdul‐Ghani MA & DeFronzo RA (2009). Plasma glucose concentration and prediction of future of type 2 diabetes. Diabetes Care 32, S194–S196. - PMC - PubMed
    1. Andersen P & Saltin B (1985). Maximal perfusion of skeletal muscle in man. J Physiol 366, 233–249. - PMC - PubMed
    1. Bansal S, Buring JE, Rifai N, Mora S, Sacks FM & Ridker PM (2007). Fasting compared with nonfasting triglycerides and risk of cardiovascular events in women. JAMA 298, 309–316. - PubMed
    1. Barrett EJ, Eggleston EM, Inyard AC, Wang H, Li G, Chai W & Liu Z. (2009). The vascular actions of insulin control its delivery to muscle and regulate the rate‐limiting step in skeletal muscle insulin action. Diabetologia 52, 752–764. - PMC - PubMed
    1. Barrett EJ, Wang H, Upchurch CT & Liu Z (2011). Insulin regulates its own delivery to skeletal muscle by feed‐forward actions on the vasculature. Am J Physiol Endocrinol Metab 301, E252–E263. - PMC - PubMed

Publication types