

Apoptosis signal-regulating kinase 1 promotes Ochratoxin A-induced renal cytotoxicity
- PMID: 25627963
- PMCID: PMC5389036
- DOI: 10.1038/srep08078
Apoptosis signal-regulating kinase 1 promotes Ochratoxin A-induced renal cytotoxicity
Abstract
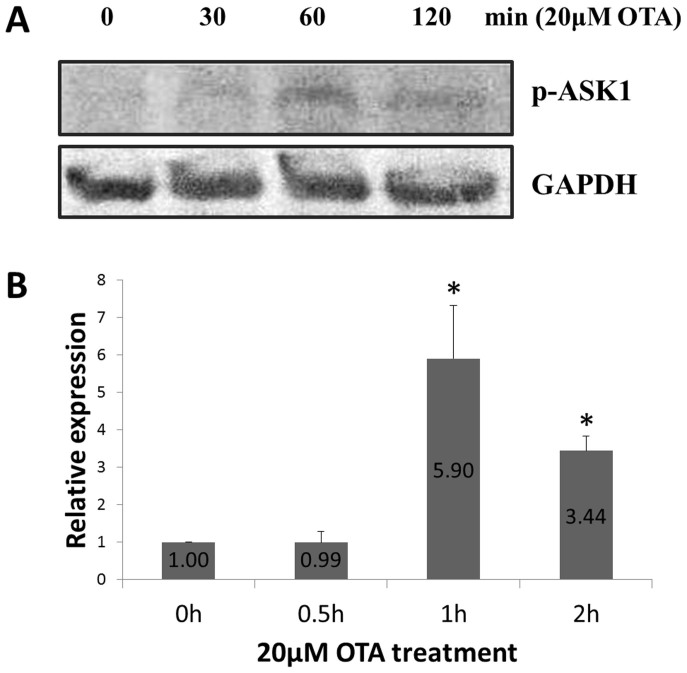
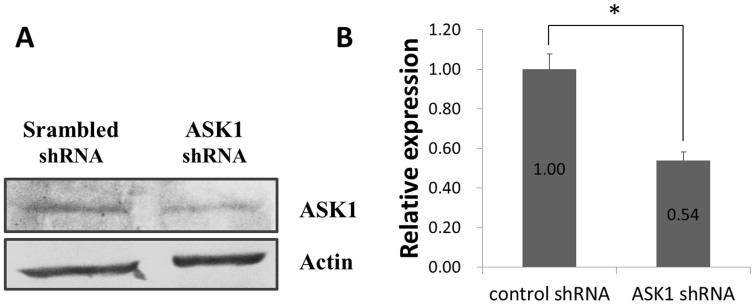
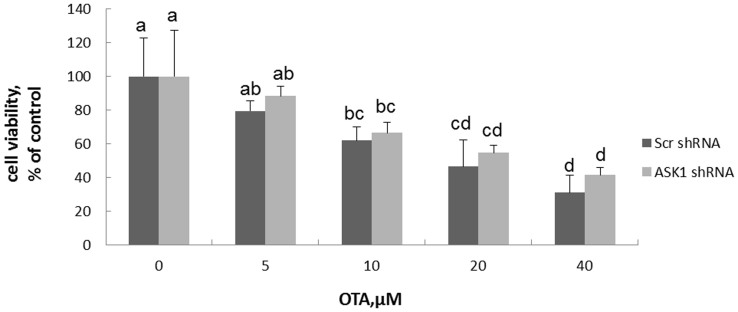
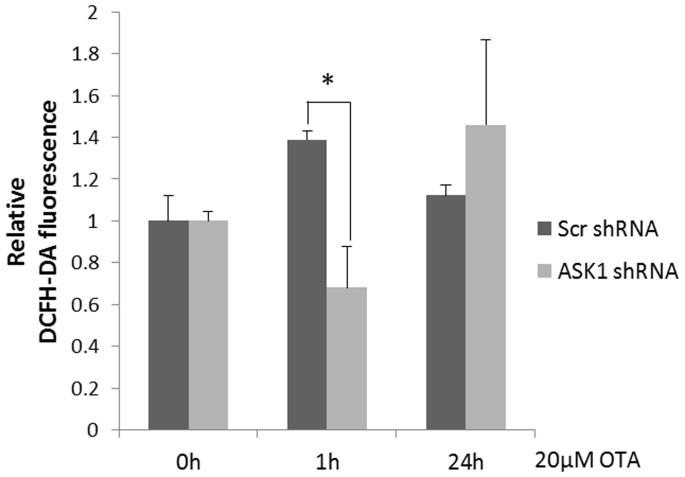
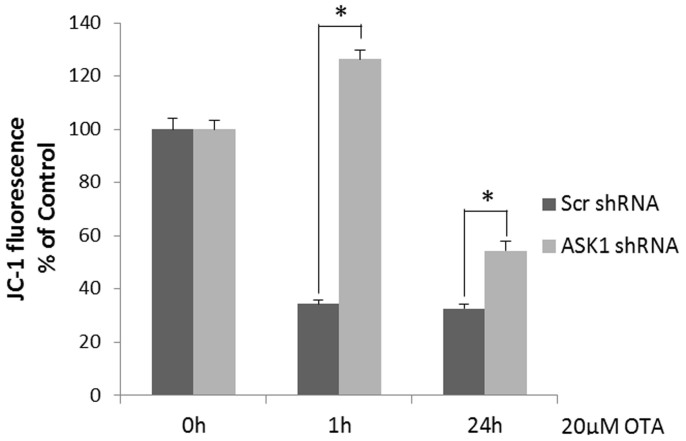
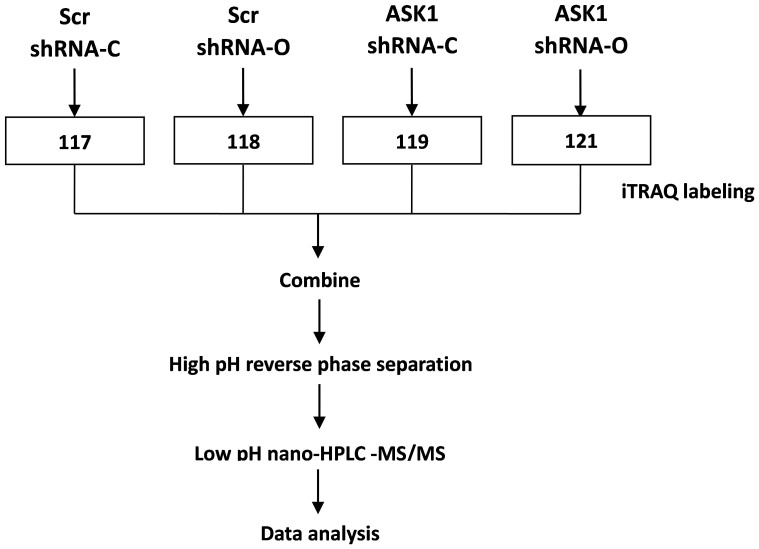
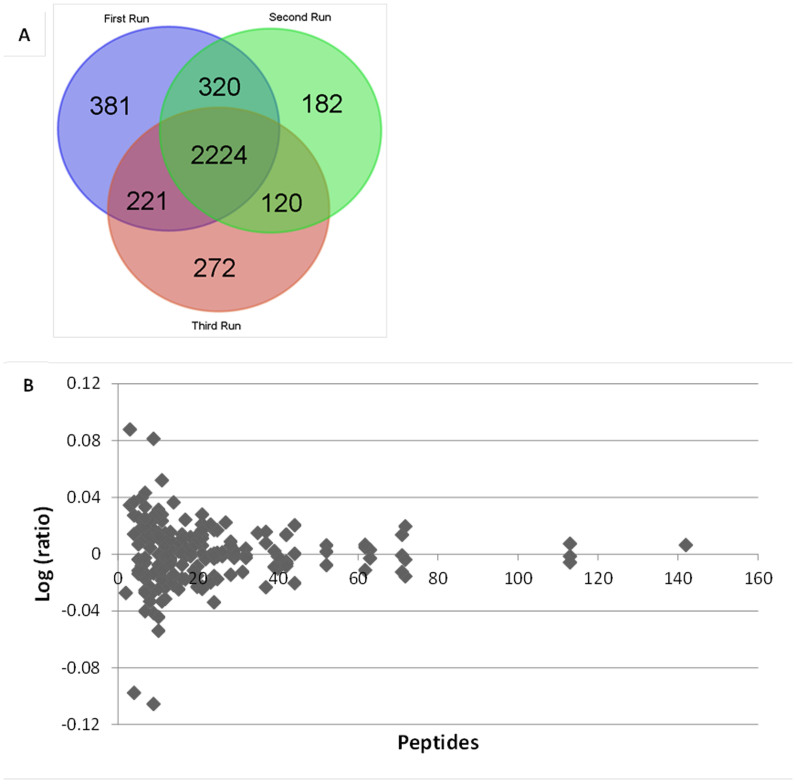
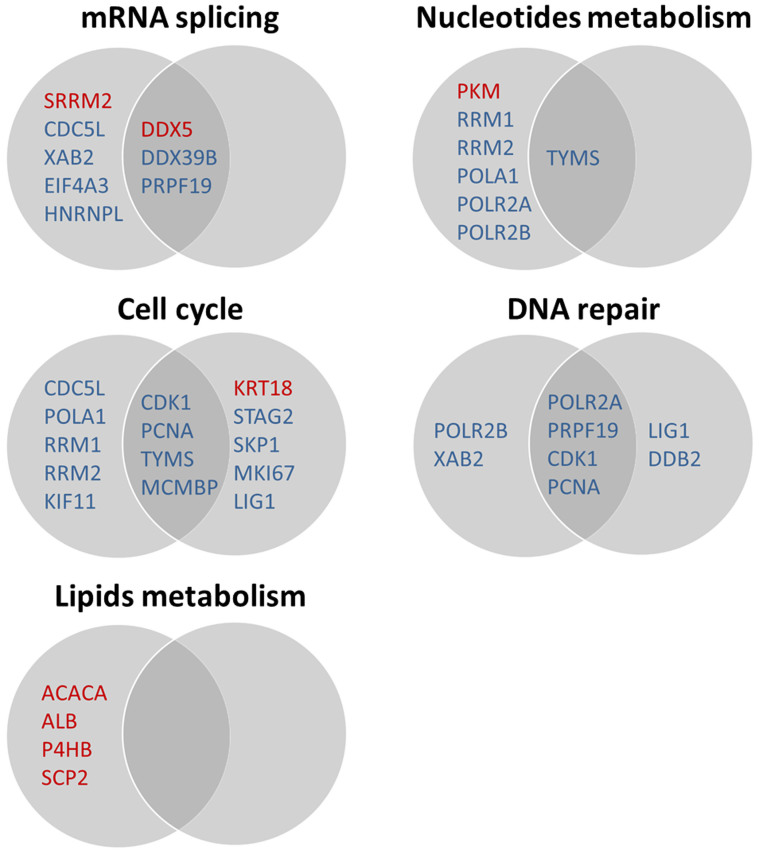
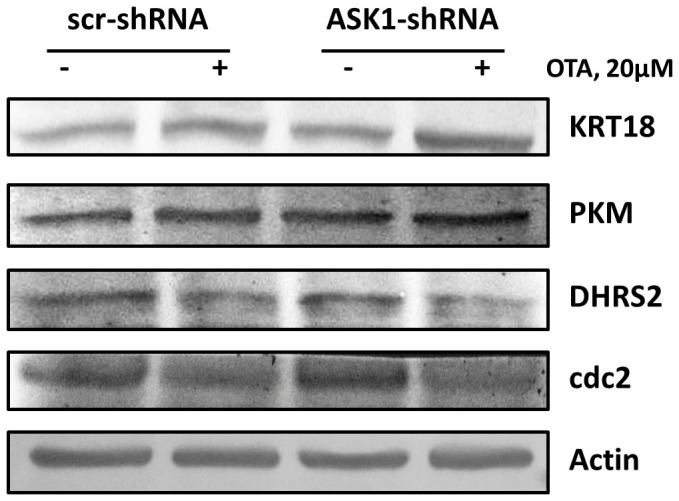
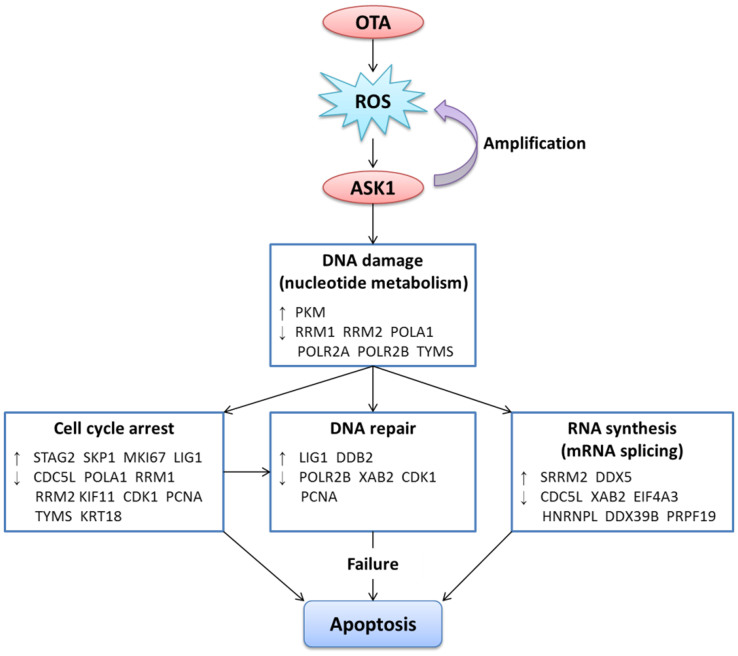
Oxidative stress and apoptosis are involved in Ochratoxin A (OTA)-induced renal cytotoxicity. Apoptosis signal-regulating kinase 1 (ASK1) is a Mitogen-Activated Protein Kinase Kinase Kinase (MAPKKK, MAP3K) family member that plays an important role in oxidative stress-induced cell apoptosis. In this study, we performed RNA interference of ASK1 in HEK293 cells and employed an iTRAQ-based quantitative proteomics approach to globally investigate the regulatory mechanism of ASK1 in OTA-induced renal cytotoxicity. Our results showed that ASK1 knockdown alleviated OTA-induced ROS generation and Δψm loss and thus desensitized the cells to OTA-induced apoptosis. We identified 33 and 24 differentially expressed proteins upon OTA treatment in scrambled and ASK1 knockdown cells, respectively. Pathway classification and analysis revealed that ASK1 participated in OTA-induced inhibition of mRNA splicing, nucleotide metabolism, the cell cycle, DNA repair, and the activation of lipid metabolism. We concluded that ASK1 plays an essential role in promoting OTA-induced renal cytotoxicity.
Conflict of interest statement
The authors declare no competing financial interests.
Figures
Similar articles
-
Isoobtusilactone A induces cell cycle arrest and apoptosis through reactive oxygen species/apoptosis signal-regulating kinase 1 signaling pathway in human breast cancer cells.Cancer Res. 2007 Aug 1;67(15):7406-20. doi: 10.1158/0008-5472.CAN-07-1089. Cancer Res. 2007. PMID: 17671211
-
Overexpression and Low Expression of Selenoprotein S Impact Ochratoxin A-Induced Porcine Cytotoxicity and Apoptosis in Vitro.J Agric Food Chem. 2017 Aug 16;65(32):6972-6981. doi: 10.1021/acs.jafc.7b02115. Epub 2017 Aug 7. J Agric Food Chem. 2017. PMID: 28650663
-
Protective role of the mitochondrial Lon protease 1 in ochratoxin A-induced cytotoxicity in HEK293 cells.J Proteomics. 2014 Apr 14;101:154-68. doi: 10.1016/j.jprot.2014.02.017. Epub 2014 Feb 22. J Proteomics. 2014. PMID: 24565693
-
Physiological roles of ASK1-mediated signal transduction in oxidative stress- and endoplasmic reticulum stress-induced apoptosis: advanced findings from ASK1 knockout mice.Antioxid Redox Signal. 2002 Jun;4(3):415-25. doi: 10.1089/15230860260196218. Antioxid Redox Signal. 2002. PMID: 12215209 Review.
-
Activation mechanisms of ASK1 in response to various stresses and its significance in intracellular signaling.Adv Biol Regul. 2013 Jan;53(1):135-44. doi: 10.1016/j.jbior.2012.09.006. Epub 2012 Sep 13. Adv Biol Regul. 2013. PMID: 23031789 Review.
Cited by
-
Porous Silicon Optical Devices: Recent Advances in Biosensing Applications.Sensors (Basel). 2021 Feb 13;21(4):1336. doi: 10.3390/s21041336. Sensors (Basel). 2021. PMID: 33668616 Free PMC article. Review.
-
Experimental ochratoxicosis A in Nile tilapia and its amelioration by some feed additives.Int J Vet Sci Med. 2018 Oct 5;6(2):149-158. doi: 10.1016/j.ijvsm.2018.09.004. eCollection 2018 Dec. Int J Vet Sci Med. 2018. PMID: 30564589 Free PMC article.
-
Ochratoxin A: Molecular Interactions, Mechanisms of Toxicity and Prevention at the Molecular Level.Toxins (Basel). 2016 Apr 15;8(4):111. doi: 10.3390/toxins8040111. Toxins (Basel). 2016. PMID: 27092524 Free PMC article. Review.
-
Protective and detoxifying effects conferred by selenium against mycotoxins and livestock viruses: A review.Front Vet Sci. 2022 Aug 2;9:956814. doi: 10.3389/fvets.2022.956814. eCollection 2022. Front Vet Sci. 2022. PMID: 35982930 Free PMC article. Review.
-
Alimentary Risk of Mycotoxins for Humans and Animals.Toxins (Basel). 2021 Nov 21;13(11):822. doi: 10.3390/toxins13110822. Toxins (Basel). 2021. PMID: 34822606 Free PMC article. Review.
References
-
- van der Merwe K. J., Steyn P. S., Fourie L., Scott D. B. & Theron J. J. Ochratoxin A, a toxic metabolite produced by Aspergillus ochraceus Wilh. Nature 205, 1112–1113 (1965). - PubMed
-
- Pfohl-Leszkowicz A. & Manderville R. A. Ochratoxin A: An overview on toxicity and carcinogenicity in animals and humans. Mol Nutr Food Res 51, 61–99 (2007). - PubMed
-
- Gekle M. et al. Ochratoxin A induces JNK activation and apoptosis in MDCK-C7 cells at nanomolar concentrations. J Pharmacol Exp Ther 293, 837–844 (2000). - PubMed
-
- Simon P., Godin M. & Fillastre J. P. Ochratoxin a: a new environmental factor which is toxic for the kidney? Nephrol Dial Transplant 11, 2389–2391 (1996). - PubMed
Publication types
MeSH terms
Substances
LinkOut - more resources
Full Text Sources
Other Literature Sources
Miscellaneous
