. 2015 Apr 15;593(8):1945-63.
doi: 10.1113/jphysiol.2014.287599. Epub 2015 Feb 23.

Temporal sequence of activation of cells involved in purinergic neurotransmission in the colon

Affiliations

Temporal sequence of activation of cells involved in purinergic neurotransmission in the colon

Salah A Baker et al. J Physiol. .

Abstract

Key points: Platelet derived growth factor receptor α (PDGFRα(+) ) cells in colonic muscles are innervated by enteric inhibitory motor neurons. PDGFRα(+) cells generate Ca(2+) transients in response to exogenous purines and these responses were blocked by MRS-2500. Stimulation of enteric neurons, with cholinergic and nitrergic components blocked, evoked Ca(2+) transients in PDGFRα(+) and smooth muscle cells (SMCs). Responses to nerve stimulation were abolished by MRS-2500 and not observed in muscles with genetic deactivation of P2Y1 receptors. Ca(2+) transients evoked by nerve stimulation in PDGFRα(+) cells showed the same temporal characteristics as electrophysiological responses. PDGFRα(+) cells express gap junction genes, and drugs that inhibit gap junctions blocked neural responses in SMCs, but not in nerve processes or PDGFRα(+) cells. PDGFRα(+) cells are directly innervated by inhibitory motor neurons and purinergic responses are conducted to SMCs via gap junctions.

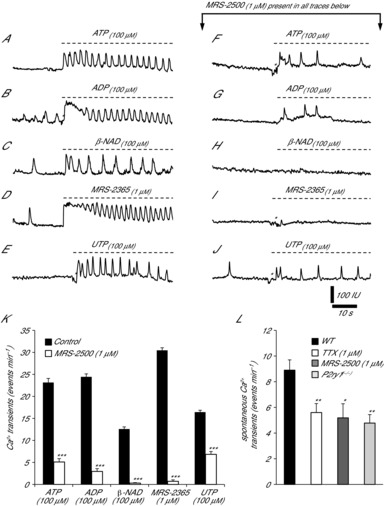
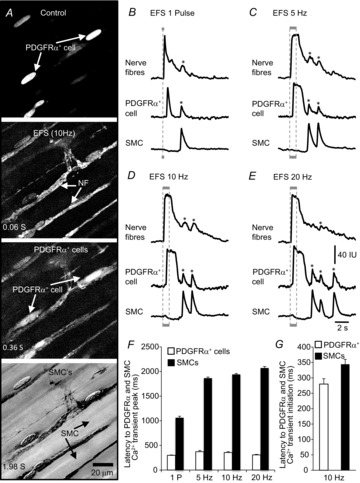
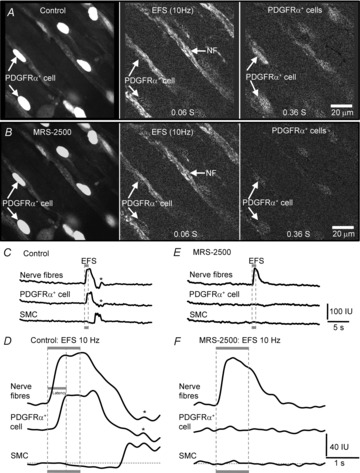
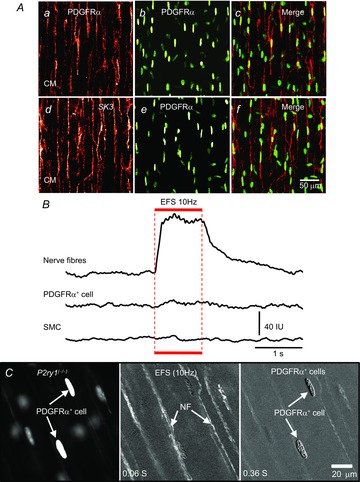
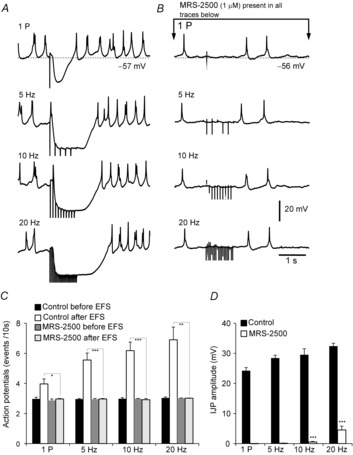
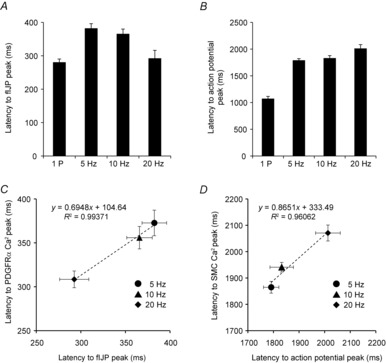
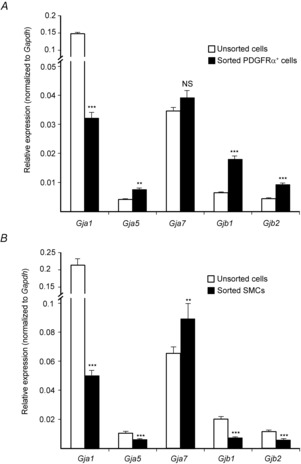
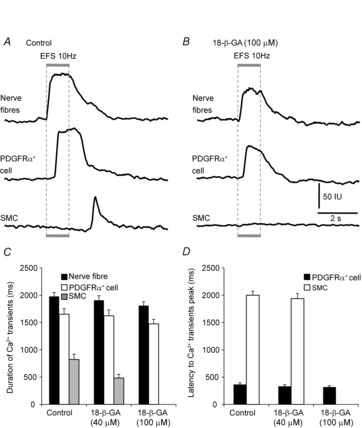
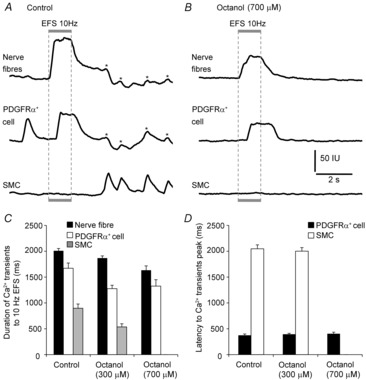
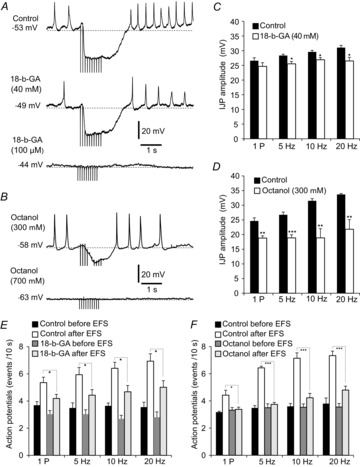
Abstract: Interstitial cells, known as platelet derived growth factor receptor α (PDGFRα(+) ) cells, are closely associated with varicosities of enteric motor neurons and suggested to mediate purinergic hyperpolarization responses in smooth muscles of the gastrointestinal tract (GI), but this concept has not been demonstrated directly in intact muscles. We used confocal microscopy to monitor Ca(2+) transients in neurons and post-junctional cells of the murine colon evoked by exogenous purines or electrical field stimulation (EFS) of enteric neurons. EFS (1-20 Hz) caused Ca(2+) transients in enteric motor nerve processes and then in PDGFRα(+) cells shortly after the onset of stimulation (latency from EFS was 280 ms at 10 Hz). Responses in smooth muscle cells (SMCs) were typically a small decrease in Ca(2+) fluorescence just after the initiation of Ca(2+) transients in PDGFRα(+) cells. Upon cessation of EFS, several fast Ca(2+) transients were noted in SMCs (rebound excitation). Strong correlation was noted in the temporal characteristics of Ca(2+) transients evoked in PDGFRα(+) cells by EFS and inhibitory junction potentials (IJPs) recorded with intracellular microelectrodes. Ca(2+) transients and IJPs elicited by EFS were blocked by MRS-2500, a P2Y1 antagonist, and absent in P2ry1((-/-)) mice. PDGFRα(+) cells expressed gap junction genes, and gap junction uncouplers, 18β-glycyrrhetinic acid (18β-GA) and octanol blocked Ca(2+) transients in SMCs but not in neurons or PDGFRα(+) cells. IJPs recorded from SMCs were also blocked. These findings demonstrate direct innervation of PDGFRα(+) cells by motor neurons. PDGFRα(+) cells are primary targets for purinergic neurotransmitter(s) in enteric inhibitory neurotransmission. Hyperpolarization responses are conducted to SMCs via gap junctions.


Figures

Figure 1
Figure 1. Ca2+ transients in PDGFRα+ cells in response to exogenous purines
Ca2+ transients occurred spontaneously in PDGFRα+ cells but were enhanced by ATP (A, 100 μm), ADP (B, 100 μm) and β-NAD (C, 100 μm) (n = 10 for each purine, P = 0.001). D and E, Ca2+ transients were also stimulated by the P2Y1 agonist MRS-2365 (D, 1 μm) and UTP (E, 100 μm) (n = 10 and n = 8, respectively; P = 0.001). F–J, Ca2+ responses of PDGFRα+ cells to purines after pre-treatment with the P2Y1 receptor antagonist, MRS-2500 (1 μm). Responses to ATP (100 μm), ADP (100 μm) and UTP (100 μm) were reduced in the presence of MRS-2500, but not blocked (F, G and J, respectively; n = 6 each, P = 0.001). MRS-2500 abolished Ca2+ transient responses to β-NAD (H) and MRS-2365 (J). K, summary of changes in Ca2+ transients evoked by purines under control conditions and after addition of MRS-2500. l-NNA (100 μm) and atropine (1 μm) were present in all experiments. L, summary graph of the effects of TTX (P = 0.008) and MRS-2500 (P = 0.02) on the spontaneous Ca2+ transients in PDGFRα+ cells in wild-type (WT) muscles. Spontaneous Ca2+ transients were also reduced in PDGFRα+ cells of P2ry1(−/−) muscles (n = 5, P = 0.01; raw data traces not shown). Asterisks denote motion/focus artifacts in all panels.
Figure 2
Figure 2. Ca2+ responses of PDGFRα+ cells to nerve stimulation
A, images showing Ca2+ responses at different time points during EFS. Arrows show locations of PDGFRα+ cells, nerve fibres (NF) and SMCs. Scale bar in final panel is 20 μm and pertains to all images. Representative traces of Ca2+ transients in nerve fibres (NF), PDGFRα+ cells and SMCs evoked by EFS at different frequencies: responses to single pulse (1 P) (B), 5 Hz (C), 10 Hz (D) and 20 Hz (E) are shown. Stimulus trains were delivered for 1 s (denoted by grey bars below each set of traces and by dotted lines through the traces). Asterisks denote bleedthrough artifacts that usually came from SMCs signals because these cells lay beneath all other cells. In A, Control shows PDGFRα+ cells clearly distinguishable by eGFP expression in nuclei, EFS (10 Hz) activated nerve bundles (NF) immediately after the onset of EFS (background prior to simulation was subtracted), Ca2+ responses in PDGFRα+-IM were activated soon after responses in neurons (i.e. 0.28 s after onset of EFS (D, G); background and activated nerve bundle images were subtracted). Ca2+ responses occurred in SMCs subsequent to PDGFRα+-IM (B–E). Typically a small decrease in Ca2+ fluorescence was noted during EFS (i.e. 0.34 s after onset of EFS; D, G) and then an increase in Ca2+ fluorescence was noted after cessation of EFS (B–F), or in this case about 2 s after initiation of EFS (background and activated nerve bundle images were subtracted). A summary of the latencies (ms) from the start of EFS to the peaks of Ca2+ transients in PDGFRα+ cells and SMCs is shown in F (n = 16). A comparison between latencies (ms) from the start of EFS to the initiation of Ca2+ transients in PDGFRα+ cells and SMCs at 10 Hz is shown in G (n = 16).
Figure 3
Figure 3. Ca2+ transients in PDGFRα+ cells are mediated predominantly by P2Y1 receptors
Ca2+ transients in PDGFRα+ cells evoked by EFS (10 Hz) were inhibited by MRS-2500 (1 μm). White arrows indicate PDGFRα+ cells or nerve fibres (NF), as indicated. Time sequence images emphasizing sequence of Ca2+ transients in nerve fibres and PDGFRα+ cells (identified by eGFP in nuclei) in response to EFS (10 Hz) before (A) and with MRS-2500 (1 μm; B). l-NNA (100 μm) and atropine (1 μm) were present during all recordings. EFS failed to evoke Ca2+ transients in PDGFRα+ cells in the presence of MRS-2500, but similar amplitude and duration responses were sustained in nerve fibres (n = 8). Scale bar in A and B is 20 μm and pertains to all panels. C and E, representative plots of Ca2+ transients in nerve fibres, PDGFRα+ cells and SMCs in response to EFS (10 Hz) before (C) and with MRS-2500 (1 μm; E), respectively. Magnified traces show the Ca2+ transients in nerve fibres, PDGFRα+ cells and SMCs without (D) and with MRS-2500 (1 μm; F), respectively. A small decrease in basal Ca2+ was often noted in the smooth muscle records during EFS (region below dotted line in D). Responses to EFS in PDGFRα+ cells and SMCs were blocked by MRS-2500 (F). In all experiments, EFS was delivered in 1 s trains (denoted by the grey box and the dotted lines through the traces).
Figure 4
Figure 4. Ca2+ responses in PDGFRα+ cells and SMCs evoked by EFS were absent in P2ry1(/) mice
A, immunolabeling of whole mounts of colon from P2ry1(−/−) mice with PDGFRα (red, Aa) and SK3 (red, Ad) antibodies showed double labelling of PDGFRα+ cells (green eGFP nuclei, Ab, Ae: merged images are in Ac and Af). Scale bar in Af is 50 μm and pertains to all panels in A. Ca2+ transients evoked by EFS were absent in PDGFRα+ cells and SMCs in muscles of P2ry1(−/−) mice (B). The stimulus train (1 s) is denoted by the red bar and dotted line through the traces. Time sequence images demonstrate the absence of Ca2+ transients in PDGFRα+ cells and SMCs in muscles of P2ry1(−/−) mice (C). White arrowheads indicate PDGFRα+ cells or nerve fibres. Scale bar in C (right panel) is 20 μm and pertains to all panels in C.
Figure 5
Figure 5. Electrical responses (IJPs) to EFS
A, electrical activity recorded from intact colonic muscles in the presence of l-NNA (100 μm) and atropine (1 μm). EFS single pulse (1 P) and 5–20 Hz elicited IJPs, followed by post-stimulus excitation consisting of a train of action potentials (AP). Previous studies have described these responses as purinergic fast IJPs (fIJPs). B, MRS-2500 (1 μm) abolished fIJPs evoked by 1 P, 5 and 10 Hz stimuli. A small component persisted after MRS-2500 at 20 Hz (4.5 ± 1.2 mV, n = 6). C, summary of the average number of post-stimulus action potentials in controls and in the presence of MRS-2500 at different frequencies (i.e. one pulse and 5–20 Hz; each bar in the graph represents the average number of action potentials within 10 s in response to EFS). Note that the post-stimulus activation of action potentials was also inhibited by MRS-2500 (n = 6). D, summary of IJP amplitudes before and with MRS-2500 present (n = 6; each bar in the graph represents the average IJP amplitude).
Figure 6
Figure 6. Latencies of electrical responses in response to EFS correlated with the latencies of Ca2+ responses in PDGFRα+ cells
A, summary of the average latency from the onset of EFS to peak of fIJP (n = 6). B, summary of average latency from onset of EFS to first action potential peak during the post-stimulus excitation (n = 6). C, strong correlation was found between the average latency to the peaks of fIJPs and the average latency to the peaks of Ca2+ transients in PDGFRα+ cells over the range of EFS frequencies tested (5–20 Hz). Similarly, the average latency from the onset of EFS to the first action potential peak correlated with the average latency to the first SMC Ca2+ response over the range of EFS frequencies tested (5–20 Hz), indicating that action potentials were the source of the post-stimulus Ca2+ transients in SMCs (D).
Figure 7
Figure 7. Expression of gap junction transcripts in PDGFRα+ cells
The relative expression of gap junction gene transcripts (Gja1, Gja5, Gja7, Gjb1, Gjb2) was compared in sorted PDGFRα+ cells (A), sorted SMCs (B) and unsorted cells (i.e. mixed cell population after enzymatic dispersions of distal colon muscles) by qPCR. A, PDGFRα+ cell expression of Cx 40 (Gja5), Cx 32 (Gjb1) and Cx 26 (Gjb2) were higher in PDGFRα+ cells in comparison to other cell types, although the highest transcript levels in PDGFRα+ cells were Cx 43 (Gja1) and Cx 45 (Gja7). B, transcript expression in sorted SMCs. Cx 45 (Gja7) and Cx 43 (Gja1) were also the most highly expressed gap junction genes in SMCs in comparison to other gap junction genes. The relative expression of each gene was normalized to the housekeeping gene, Gapdh.
Figure 8
Figure 8. 18-β-glycyrrhetinic acid (18-β-GA) failed to block EFS-evoked responses in PDGFRα+ cells but blocked responses in SMCs
A, an example of Ca2+ transients activated by EFS (10 Hz) under control conditions (l-NNA and atropine present, n = 6). The stimulus train (1 s) is denoted by the grey box and dotted lines through the trace. EFS evoked Ca2+ transients in PDGFRα+ cells with a short latency after onset of EFS and in SMCs after cessation of stimulation. 18-β-GA (100 μm) blocked Ca2+ responses evoked by EFS in SMCs but did not affect the responses in PDGFRα+ cells significantly (B). C, summary of the duration of Ca2+ transients in nerve fibre bundles (black bars), PDGFRα+ cells (white bars) and SMCs (grey bars) before and after addition of 18-β-GA (40 and 100 μm). D, summary graph of the average latency in Ca2+ responses in PDGFRα+ cells and SMCs after the onset of EFS to the first Ca2+ transient peak before and after the addition of 18-β-GA (40 and 100 μm). Little change was noted in the latencies in nerve fibres and PDGFRα+ cells after 18-β-GA (100 μm), but responses were blocked in SMCs in the presence of 100 μm 18-β-GA.
Figure 9
Figure 9. Octanol inhibited Ca2+ transients evoked by EFS in SMCs
A and B, inhibition of Ca2+ transients of SMCs by the gap junction uncoupler, octanol (700 μm). A, Ca2+ transients evoked in neural processes, PDGFRα+ cells and SMCs in response to EFS (10 Hz, 1 s) under control conditions (l-NNA and atropine present, n = 6). The stimulus train is denoted by the grey box and dotted lines through the trace. B, octanol (700 μm) abolished the Ca2+ responses to EFS in SMCs. Note that octanol (700 μm) also somewhat reduced the duration of responses in nerve processes and PDGFRα+ cells. C, summary graph of the average duration of each nerve fibre bundle (black bars), PDGFRα+ cells (white bars) and SMCs (grey bars) before and after the addition of octanol (300 and 700 μm). D, summary graph of the average latency of Ca2+ responses in PDGFRα+ cells and SMCs (from onset of EFS to the peak of the first Ca2+ transient) before and after addition of octanol (300 and 700 μm). Asterisks denote a signal bleedthrough artifact.
Figure 10
Figure 10. Gap junction uncouplers 18-β-GA and octanol inhibited IJPs in response to EFS
A, representative electrical response to EFS (10 Hz, 1 s). IJPs were abolished by 18-β-GA (100 μm) and octanol (700 μm) B, summary of average IJP amplitudes under control conditions (l-NNA and atropine present) and in the presence of 18-β-GA (40 μm) (C) and octanol (700 μm) (D). Note that IJP amplitude was reduced at all frequencies tested, even with the lower concentrations of both drugs, except for the response to the 1 P stimulus in the presence of 18-β-GA (n = 6). Higher concentrations of both uncouplers blocked IJPs. E, summary of the average number of action potentials before and after EFS in control and in the presence of 18-β-GA (40 μm). Note the marked decrease in post-stimulus action potentials in the presence of 18-β-GA (40 μm; each bar in the graph represents the average number of action potentials within 10 s after EFS). F, summary of the average number of action potentials in control and in the presence of octanol (300 μm). Note the marked decrease in the action potentials after cessation of EFS in the presence of octanol (300 μm) (each bar in the graph represents the average number of action potentials within 10 s before and after EFS).

Comment in

References

    1. Baker SA, Hennig GW, Salter AK, Kurahashi M, Ward SM. Sanders KM. Distribution and Ca2+ signalling of fibroblast-like (PDGFR+) cells in the murine gastric fundus. J Physiol. 2013;591:6193–6208. - PMC - PubMed
    1. Banks BE, Brown C, Burgess GM, Burnstock G, Claret M, Cocks TM. Jenkinson DH. Apamin blocks certain neurotransmitter-induced increases in potassium permeability. Nature. 1979;282:415–417. - PubMed
    1. Baranska J, Czajkowski R. Sabala P. Cross-talks between nucleotide receptor-induced signaling pathways in serum-deprived and non-starved glioma C6 cells. Adv Enzyme Regul. 2004;44:219–232. - PubMed
    1. Bennett MR. Transmission from intramural excitatory nerves to the smooth muscle cells of the guinea-pig taenia coli. J Physiol. 1966;185:132–147. - PMC - PubMed
    1. Bitar KN, Said SI, Weir GC, Saffouri B. Makhlouf GM. Neural release of vasoactive intestinal peptide from the gut. Gastroenterology. 1980;79:1288–1294. - PubMed

Publication types

MeSH terms

Substances

LinkOut - more resources