. 2015 May;129(5):749-56.
doi: 10.1007/s00401-015-1390-7. Epub 2015 Jan 28.

PART is part of Alzheimer disease

Affiliations

PART is part of Alzheimer disease

Charles Duyckaerts et al. Acta Neuropathol. 2015 May.

Abstract

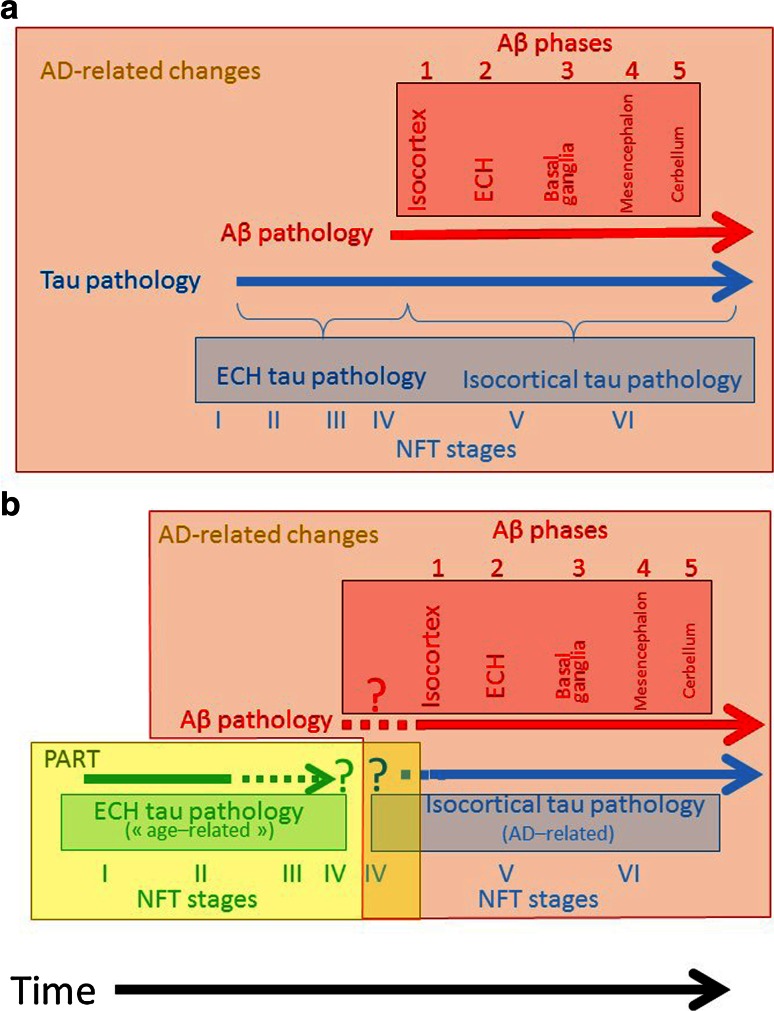
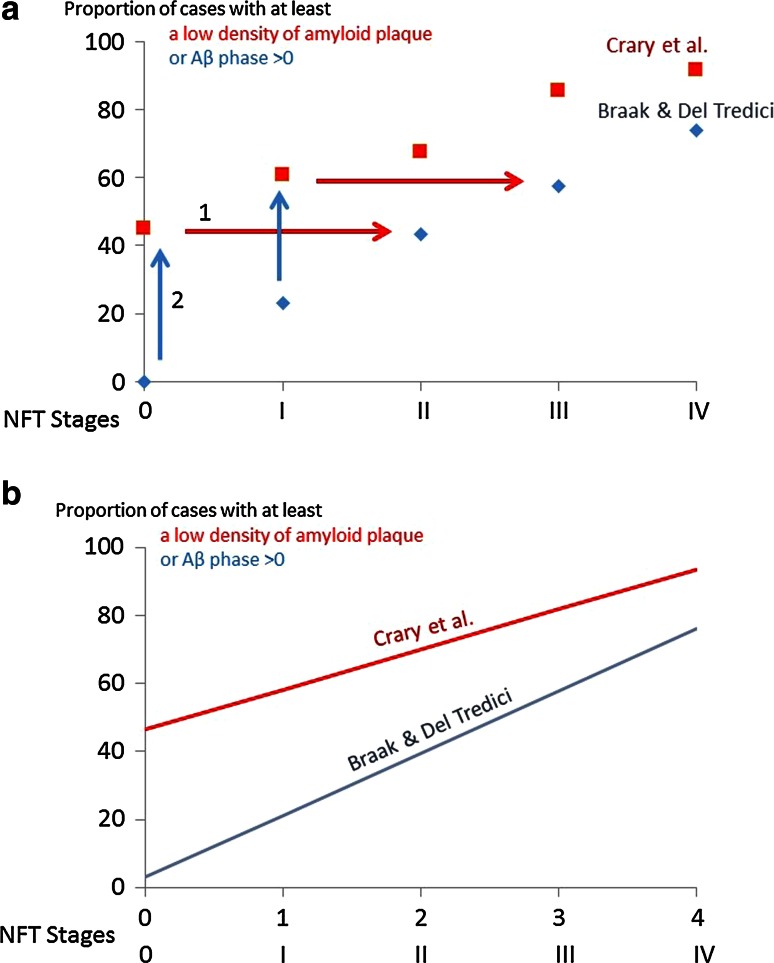
It has been proposed that tau aggregation confined to entorhinal cortex and hippocampus, with no or only minimal Aβ deposition, should be considered as a 'primary age-related tauopathy' (PART) that is not integral to the continuum of sporadic Alzheimer disease (AD). Here, we examine the evidence that PART has a pathogenic mechanism and a prognosis which differ from those of AD. We contend that no specific property of the entorhinal-hippocampal tau pathology makes it possible to predict either a limited progression or the development of AD, and that biochemical differences await an evidence base. On the other hand, entorhinal-hippocampal tau pathology is an invariant feature of AD and is always associated with its development. Rather than creating a separate disease entity, we recommend the continued use of an analytical approach based on NFT stages and Aβ phases with no inference about hypothetical disease processes.


Figures

Fig. 1
Fig. 1
Relationship between the development of tau pathology and Aβ deposition. a Tau pathology in the entorhinal cortex and hippocampus (ECH) belongs to the AD continuum. It is complemented over time by Aβ deposition that occurs in an ordered manner (no attempt has been made to represent the duration of each stage or phase; only the sequence is important here). b Panel b illustrates the PART hypothesis and the issues it raises. Tau pathology in the ECH differs from tau pathology in AD, with three major problems indicated by the dotted lines. 1 Can Aβ deposition precede tau pathology? 2 Can tau pathology related to PART occur with Aβ deposition phases 1–2? 3 How and where does PART end? Panel a describes our position
Fig. 2
Fig. 2
Linear relationship between the NFT stage and the proportion of cases with Aβ pathology. a Raw data from Crary et al. [8] (red squares) and Braak and Del Tredici [5] (blue diamonds). The red squares indicate the percentage of cases with ‘low,’ ‘moderate,’ or ‘high’ amyloid plaque score. The blue diamonds indicate the percentage of cases with Aβ phases 1, 2, 3, 4 or 5. Red squares and blue diamonds thus refer to the cases with Aβ deposition, whatever its severity. The blue arrows indicate the translation along the Y axis that should be applied to Braak and Del Tredici data [5] so that they coincide with the Crary et al. data [8]. The red arrows indicate, alternatively, the translation that should be applied along the X axis so that the Crary et al. data [8] coincide with Braak and Del Tredici data [5] (see text for explanation). b Regression line between the NFT stages and the proportion of cases with Aβ pathology. To compute the correlation coefficient, the slope and the intercept of the regression lines, the NFT stages (I to IV) had to be translated into numerical value (1–4). Equation of the red line (data from Crary et al. [8]): Proportion of cases (in percentage) with low, moderate or high plaque score = 11.78 × NFT stage + 46.5. The correlation coefficient r = 0.99 indicates that the NFT value suffices to predict with a high degree of accuracy the proportion of cases with Aβ pathology. Equation of the blue line (data from Braak and Del Tredici) [5]: Proportion of cases (in percentage) with Aβ phase higher than 0 = 18.21 × NFT stage + 3.11. The correlation coefficient r = 0.995 indicates that the NFT stages almost fully predicts the proportion of cases with Aβ pathology
Fig. 3
Fig. 3
Relationship between the NFT stage and the proportion of the population with an ‘amyloid plaque score’ of ‘none’ (PART definite), ‘low’ (PART possible), and ‘high’ (‘AD neuropathologic changes’). Comparisons with NFT stages and Aβ phases. Area chart. The percentage of the population (y value) corresponding to the NFT stage (X axis) for each category (color and label shown on each area) is proportional to the length of its projection on the Y axis. a The values shown here have been calculated from Table 1 of Crary et al. [8]. Percentage of normal cases (green) = NFT stage 0, amyloid plaque score = none. The PART area is surrounded by a dotted yellow line. Percentage of cases with PART ‘definite’ (yellow) = NFT stage > 0, amyloid plaque score = none. Percentage of cases with PART ‘possible ‘(dark yellow) = NFT stage > 0; amyloid plaque score = low. AD neuropathological changes [22] are indicated in shades of red, with a red border. The red and white cross-hatching corresponds to an area extrapolated from Table 1 of Crary et al. [8]: The diagnosis is necessarily AD neuropathological changes because NFT stages are >4 with a ‘moderate’ or ‘high’ plaque score. The blue arrow indicates the progression of Alzheimer disease neuropathological changes as we understand them in the context of the PART hypothesis: PART cases do not commonly progress to Alzheimer disease. Alzheimer disease begins with a low plaque count (or low Aβ phase) in the absence of tau pathology in the ECH. Please note that the frequency of cases with NFT stage 0 and ‘amyloid plaques’ (up to ‘numerous’ plaque score) is low in our experience (see text and [3]). It should also be emphasized that the dividing line between PART ‘definite’ and ‘possible’, and between PART ‘possible’ and AD-related changes is in Table 1 of Crary et al. [8] relies on an “amyloid plaque score” that differs from the “neuritic plaque score” recommended in the NIA–AA criteria [22] and from the Aβ phases recommended in the PART diagnostic criteria proposed in Table 2 of Crary et al. [8]. The difference between the density of neuritic plaques and of all types of Aβ deposits may be considerable. b The values shown here have been calculated from the cohort presented in Braak and Del Tredici [4]. Normal (green) = NFT stage 0, plaque score = none. The proportion of cases in the observed combination of NFT stages and Aβ phases are indicated in red shading. The blue arrow indicates the progression of the changes in the context of the continuum hypothesis defended here

References

    1. Braak H, Alafuzoff I, Arzberger T, Kretzschmar H, Del Tredici K. Staging of Alzheimer disease-associated neurofibrillary pathology using paraffin sections and immunocytochemistry. Acta Neuropathol. 2006;112:389–404. doi: 10.1007/s00401-006-0127-z. - DOI - PMC - PubMed
    1. Braak H, Braak E. The human entorhinal cortex: normal morphology and lamina-specific pathology in various diseases. Neurosci Res. 1992;15:6–31. doi: 10.1016/0168-0102(92)90014-4. - DOI - PubMed
    1. Braak H, Thal DR, Ghebremedhin E, Del Tredici K. Stages of the pathologic process in Alzheimer disease: age categories from 1 to 100 years. J Neuropathol Exp Neurol. 2011;70:960–969. doi: 10.1097/NEN.0b013e318232a379. - DOI - PubMed
    1. Braak H, Del Tredici K. Are cases with tau pathology occurring in the absence of Aβ deposits part of the AD-related pathological process? Acta Neuropathol. 2014;128:767–772. doi: 10.1007/s00401-014-1356-1. - DOI - PubMed
    1. Braak H, Del Tredici K. Neuroanatomy and pathology of sporadic Alzheimer’s Disease. Adv Anat Embryol Cell Biol. 2015;215:1–162. doi: 10.1007/978-3-319-12679-1_1. - DOI - PubMed

LinkOut - more resources