Energetic evaluation of binding modes in the C3d and Factor H (CCP 19-20) complex
- PMID: 25628052
- PMCID: PMC4420527
- DOI: 10.1002/pro.2650
Energetic evaluation of binding modes in the C3d and Factor H (CCP 19-20) complex
Abstract
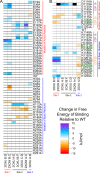
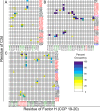
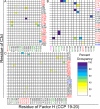
As a part of innate immunity, the complement system relies on activation of the alternative pathway (AP). While feed-forward amplification generates an immune response towards foreign surfaces, the process requires regulation to prevent an immune response on the surface of host cells. Factor H (FH) is a complement protein secreted by native cells to negatively regulate the AP. In terms of structure, FH is composed of 20 complement-control protein (CCP) modules that are structurally homologous but vary in composition and function. Mutations in these CCPs have been linked to states of autoimmunity. In particular, several mutations in CCP 19-20 are correlated to atypical hemolytic uremic syndrome (aHUS). From crystallographic structures there are three putative binding sites of CCP 19-20 on C3d. Since there has been some controversy over the primary mode of binding from experimental studies, we approach characterization of binding using computational methods. Specifically, we compare each binding mode in terms of electrostatic character, structural stability, dissociative and associative properties, and predicted free energy of binding. After a detailed investigation, we found two of the three binding sites to be similarly stable while varying in the number of contacts to C3d and in the energetic barrier to complex dissociation. These sites are likely physiologically relevant and may facilitate multivalent binding of FH CCP 19-20 to C3b and either C3d or host glycosaminoglycans. We propose thermodynamically stable binding with modules 19 and 20, the latter driven by electrostatics, acting synergistically to increase the apparent affinity of FH for host surfaces.
Keywords: C3d; MM/GBSA binding free energy; Poisson-Boltzmann electrostatics; complement system; factor H; molecular dynamics; steered molecular dynamics.
© 2015 The Protein Society.
Figures


Similar articles
-
Disease-linked mutations in factor H reveal pivotal role of cofactor activity in self-surface-selective regulation of complement activation.J Biol Chem. 2017 Aug 11;292(32):13345-13360. doi: 10.1074/jbc.M117.795088. Epub 2017 Jun 21. J Biol Chem. 2017. PMID: 28637873 Free PMC article.
-
Dual interaction of factor H with C3d and glycosaminoglycans in host-nonhost discrimination by complement.Proc Natl Acad Sci U S A. 2011 Feb 15;108(7):2897-902. doi: 10.1073/pnas.1017087108. Epub 2011 Feb 1. Proc Natl Acad Sci U S A. 2011. PMID: 21285368 Free PMC article.
-
Mutations of factor H impair regulation of surface-bound C3b by three mechanisms in atypical hemolytic uremic syndrome.J Biol Chem. 2009 Jun 5;284(23):15650-8. doi: 10.1074/jbc.M900814200. Epub 2009 Apr 7. J Biol Chem. 2009. PMID: 19351878 Free PMC article.
-
Translational mini-review series on complement factor H: structural and functional correlations for factor H.Clin Exp Immunol. 2008 Jan;151(1):14-24. doi: 10.1111/j.1365-2249.2007.03553.x. Clin Exp Immunol. 2008. PMID: 18081691 Free PMC article. Review.
-
Complement activation in diseases presenting with thrombotic microangiopathy.Eur J Intern Med. 2013 Sep;24(6):496-502. doi: 10.1016/j.ejim.2013.05.009. Epub 2013 Jun 4. Eur J Intern Med. 2013. PMID: 23743117 Review.
Cited by
-
Factor H-Inspired Design of Peptide Biomarkers of the Complement C3d Protein.ACS Med Chem Lett. 2020 Feb 28;11(5):1054-1059. doi: 10.1021/acsmedchemlett.9b00663. eCollection 2020 May 14. ACS Med Chem Lett. 2020. PMID: 32435425 Free PMC article.
-
Recent advances in user-friendly computational tools to engineer protein function.Brief Bioinform. 2021 May 20;22(3):bbaa150. doi: 10.1093/bib/bbaa150. Brief Bioinform. 2021. PMID: 32743637 Free PMC article. Review.
-
AESOP: A Python Library for Investigating Electrostatics in Protein Interactions.Biophys J. 2017 May 9;112(9):1761-1766. doi: 10.1016/j.bpj.2017.04.005. Biophys J. 2017. PMID: 28494947 Free PMC article.
-
Molecular Mechanisms of Macular Degeneration Associated with the Complement Factor H Y402H Mutation.Biophys J. 2019 Jan 22;116(2):215-226. doi: 10.1016/j.bpj.2018.12.007. Epub 2018 Dec 14. Biophys J. 2019. PMID: 30616835 Free PMC article.
-
Role of Electrostatic Hotspots in the Selectivity of Complement Control Proteins Toward Human and Bovine Complement Inhibition.Front Mol Biosci. 2021 Mar 16;8:618068. doi: 10.3389/fmolb.2021.618068. eCollection 2021. Front Mol Biosci. 2021. PMID: 33829039 Free PMC article.
References
MeSH terms
Substances
LinkOut - more resources
Full Text Sources
Other Literature Sources
Research Materials
Miscellaneous

