. 2015 Apr 20;43(7):e48.
doi: 10.1093/nar/gkv035. Epub 2015 Jan 27.

Increased functional protein expression using nucleotide sequence features enriched in highly expressed genes in zebrafish

Affiliations

Increased functional protein expression using nucleotide sequence features enriched in highly expressed genes in zebrafish

Eric J Horstick et al. Nucleic Acids Res. .

Abstract

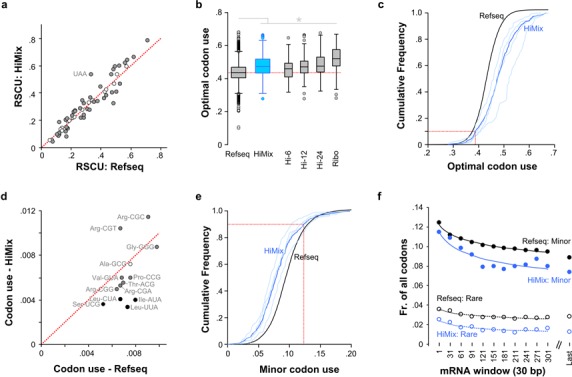
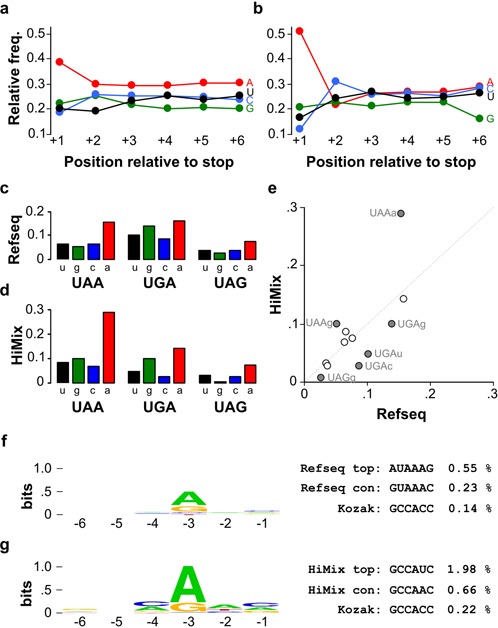
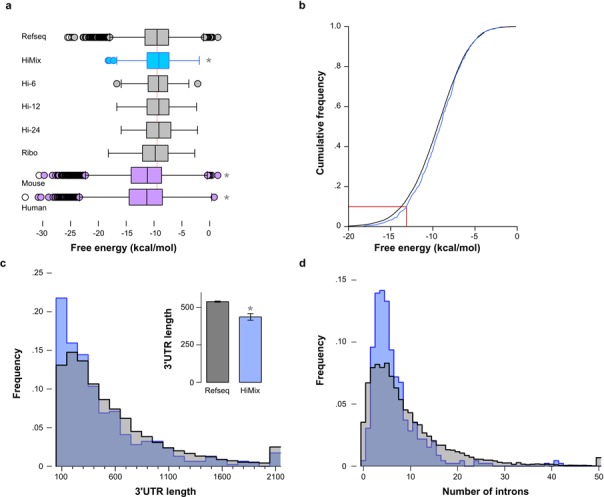
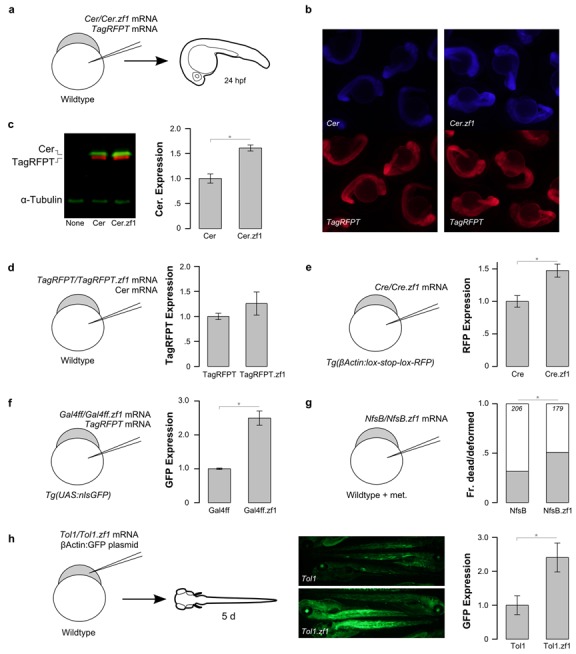
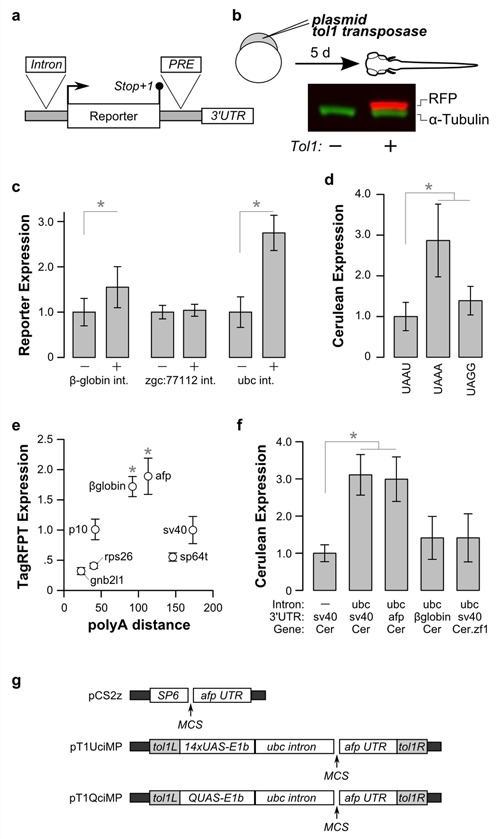
Many genetic manipulations are limited by difficulty in obtaining adequate levels of protein expression. Bioinformatic and experimental studies have identified nucleotide sequence features that may increase expression, however it is difficult to assess the relative influence of these features. Zebrafish embryos are rapidly injected with calibrated doses of mRNA, enabling the effects of multiple sequence changes to be compared in vivo. Using RNAseq and microarray data, we identified a set of genes that are highly expressed in zebrafish embryos and systematically analyzed for enrichment of sequence features correlated with levels of protein expression. We then tested enriched features by embryo microinjection and functional tests of multiple protein reporters. Codon selection, releasing factor recognition sequence and specific introns and 3' untranslated regions each increased protein expression between 1.5- and 3-fold. These results suggested principles for increasing protein yield in zebrafish through biomolecular engineering. We implemented these principles for rational gene design in software for codon selection (CodonZ) and plasmid vectors incorporating the most active non-coding elements. Rational gene design thus significantly boosts expression in zebrafish, and a similar approach will likely elevate expression in other animal models.


Figures

Figure 1.
Figure 1.
Codon use bias in genes that are highly expressed in zebrafish. (a) RSCU for 62 codons (excluding the single codon amino acids Met and Trp) in the Himix set compared to the Refseq set. Red dotted line indicates equal usage. Gray-shaded circles indicate codons with significant differences in usage between sets (X2 test, P < 0.001). (b) Optimal codon usage. The most frequently used (‘optimal’) codon for each amino acid was determined for each gene set. For each gene in the set, the fraction of codons using the optimal codon was calculated. Dotted red line indicates the median for the Refseq set. t-test *P < 0.001. (c) Cumulative frequency histogram representing preference for optimal codon usage for the data in (b). Dotted red line indicates 10th percentile, showing that 90% of highly expressed genes in the Himix set have an optimal codon use of at least 0.39. (d) Minor codon usage for all genes (Refseq) compared to the Himix gene set. Codon usage is the abundance of a particular codon as a fraction of all codons. Filled circles indicate where Himix codon usage is significantly different from the Refseq usage (X2 test, P < 0.001). Black shading indicates rare codons. Red dotted line indicates equal usage. (e) Cumulative frequency histogram for minor codon use by genes in the Refseq and Himix sets. Dotted line: <12.3% of codons are minor in 90% of highly expressed genes. (f) Minor and rare codon frequency for 30 bp windows along the coding sequence of the mRNA starting at the base indicated on the x-axis. ‘Last’ indicates the last 30 bp of the coding sequence.
Figure 2.
Figure 2.
Nucleotide use at translation termination and initiation sequences. (a–b) Relative use frequency for the 6 nucleotides following the stop codon in the (a) Refseq gene set and (b) Himix gene set. (c–d) Relative use frequency for stop tetranucleotides in the (c) Refseq gene set and (d) Himix gene set. Lower case letter indicates the nucleotide immediately following the indicated stop codon. (e) Comparison of stop tetranucleotide frequency in the Refseq gene set compared to the Himix set. Filled circles indicate tetranucleotides where use in the two sets is significantly different (Chi-square P < 0.05). (f–g) Left: DNA logo representing the nucleotide usage frequency in the six bases before the initiator ATG for Refseq genes (f) and the Himix gene set (g). Right: actual usage frequency for specific sequences in each set.
Figure 3.
Figure 3.
Structural mRNA and gene features in highly expressed genes. (a) Box plots of the maximal free energy of folding (dG) for nucleotides from −4 to +37 for genes in each data set and for genes in the mouse and human Refseq databases. *P < 0.05 for the mean compared to the zebrafish Refseq set. (b) Cumulative frequency histograms for the free energy of the minimum energy secondary structure (dG) for Refseq (black) and Himix (blue) gene sets. Dotted line indicates that for 90% of highly expressed genes, the dG was greater than –13.1 kcal/mol. (c) Distribution of 3′UTRs lengths (from the stop codon to the beginning of the polyadenylated sequence) in the Refseq (gray) and Himix (blue) sets. Bins sizes are 100 bp with maximum values per bin indicated on the x-axis. Inset, mean and standard error for each group. Mann–Whitney U test * P < 0.001. (d) Distribution of number of introns per gene for the Refseq (gray) and Himix (blue) sets.
Figure 4.
Figure 4.
Functional protein expression in codon-modified versions of genes for zebrafish. (a) Schematic of microinjection of mRNA into embryos for testing sequence features on protein expression. Protein is extracted at 24 hpf and analyzed by fluorescent western blot. Similarly, schematics in (d–g) indicate the genotype of the embryos and composition of the injection mix. (b–c) Cer modification, tested by microinjection of Cer or Cer.zf1 mRNA together with TagRFPT mRNA as a control into wildtype embryos (N = 3 groups each version). (b) Epifluorescent images of 24 hpf embryos expressing standard Cer or the version modified for zebrafish (Cer.zf1) and the matched TagRFPT co-injected control. (c) Quantification by western blot using an anti-EGFP antibody that recognizes an epitope also present in Cerulean, and an anti-TagRFPT antibody. Cer expression is the ratio of Cer and TagRFPT band intensities. (d) TagRFPT modification, tested by injection into wildtype embryos (N = 3). Experimental procedure was as in (a) except using mRNA encoding TagRFPT or TagRFPT.zf1, and Cerulean mRNA as control. Quantification by western blot with anti-TagRFPT and anti-EGFP. TagRFPT expression is the ratio of TagRFPT and Cer band intensities. (e) Cre modification, tested by injection into transgenic bActin:lox-GFP-stop-lox-RFP embryos (N = 3). Quantification by western blot with anti-TagRFPT, normalized to anti-α-tubulin. Increased RFP expression indicates greater Cre recombinase activity. (f) Gal4ff modification, tested by injection into transgenic UAS:GFP embryos together with TagRFPT mRNA as a control (N = 6). Quantification by western blot with anti-EGFP and anti-TagRFPT. GFP expression is the ratio of GFP and TagRFPT band intensities. (g) Nfsb modification, tested by injection into wildtype embryos treated with 10 mM metronidazole (met.) overnight. The fraction of embryos either dead or severely deformed is indicated (gray bars). Total number of embryos examined is indicated in italics. (h) Tol1 modification, tested by injection of Tol1 mRNA together with a plasmid containing a cassette with the β-actin promoter driving GFP, flanked by Tol1 transposon arms (N = 8). Middle: Epifluorescent images of GFP in 5 dpf embryos generated using standard Tol1 (top panel) and the zebrafish codon-modified versions (Tol1.zf1; bottom panel). Right: Quantification by western blot with anti-GFP, normalized to anti-α-tubulin. *P < 0.05.
Figure 5.
Figure 5.
Non-coding nucleotide features that increase protein expression. (a) Schematic of sequence features, showing the position of the inserted intron, PRE element and 3′ UTRs tested. (b) Microinjection of plasmid DNA and transposase for testing features of gene structure on protein expression. Protein is extracted at 5 dpf to ensure that expression from integrated transgenes is analyzed. Here the transgene is a nitroreductase-TagRFPT fusion, similar in size to α-tubulin. Expression from embryos where transposase is omitted from the injection mix (left lane) and where transposase is included resulting in expression from the integrated transgene (right lane). (c) Reporter expression in transgenic larvae, generated using constructs without (−) and with (+) the indicated intron. Introns from zgc:77112 and ubc were tested in the 5′UTR of the gene encoding Cer in HuC:Cer transgenic larvae (N = 6 groups each for control and intron-containing versions). The rabbit β-globin intron was tested in the 5′UTR of the gene encoding mCherry in Et(SCP1:Gal4)y271; UAS:GCaMP3–2a-mCherry transgenic (N = 6 groups each). *P < 0.05. (d) Cer expression in embryos injected with a mRNA for Cer-STOP-TagRFPT, where the stop codon and next nucleotide are as indicated (N = 6). *P < 0.05. (e) TagRFPT expression in embryos injected with mRNA synthesized from pCS2-based constructs with alternate 3′ UTRs: zebrafish rps26 (N = 3), zebrafish gnb2l1 (N = 3), p10 (N = 5), pout afp (N = 6), rabbit β-globin (N = 3). Also expression from mRNA derived from the pSP64T vector (N = 3). In each case expression was normalized to injections using mRNA with the unmodified pCS2 which contains a sv40 3′UTR. The x-axis indicates the number of nucleotides in the 3′UTR from the stop codon to the first AAUAAA polyadenylation motif. *P < 0.05. (f) Cer expression in transgenic larvae, generated with constructs using a HuC promoter with the indicated combinations of the ubc intron, the sv40, afp or β-globin 3′UTR and codon-modified Cerulean. N = 5–8 groups per combination. *P < 0.05. (g) Plasmid backbones containing elements that promote gene expression in zebrafish. Plasmid pT1UciMP contains tol1 arms (gray), a 14xUAS-E1b promoter and carp β-actin initiator sequence, the ubc intron, a multiple cloning site and the afp 3′UTR. Plasmid pT1QciMP is similar but with a QUAS regulatory element in place of the 14xUAS sequence.

Similar articles

Cited by

References

    1. Xia X. How optimized is the translational machinery in Escherichia coli, Salmonella typhimurium and Saccharomyces cerevisiae? Genetics. 1998;149:37–44. - PMC - PubMed
    1. Cannarozzi G., Schraudolph N.N., Faty M., von Rohr P., Friberg M.T., Roth A.C., Gonnet P., Gonnet G., Barral Y. A role for codon order in translation dynamics. Cell. 2010;141:355–367. - PubMed
    1. Cridge A.G., Major L.L., Mahagaonkar A.A., Poole E.S., Isaksson L.A., Tate W.P. Comparison of characteristics and function of translation termination signals between and within prokaryotic and eukaryotic organisms. Nucleic Acids Res. 2006;34:1959–1973. - PMC - PubMed
    1. Nott A., Meislin S.H., Moore M.J. A quantitative analysis of intron effects on mammalian gene expression. RNA. 2003;9:607–617. - PMC - PubMed
    1. Mahonen A.J., Airenne K.J., Purola S., Peltomaa E., Kaikkonen M.U., Riekkinen M.S., Heikura T., Kinnunen K., Roschier M.M., Wirth T., et al. Post-transcriptional regulatory element boosts baculovirus-mediated gene expression in vertebrate cells. J. Biotechnol. 2007;131:1–8. - PubMed

Publication types