. 2015 Jan 13:8:458.
doi: 10.3389/fncel.2014.00458. eCollection 2014.

Neurogenesis and growth factors expression after complete spinal cord transection in Pleurodeles waltlii

Affiliations

Neurogenesis and growth factors expression after complete spinal cord transection in Pleurodeles waltlii

Amira Z Zaky et al. Front Cell Neurosci. .

Abstract

Following spinal lesion, connections between the supra-spinal centers and spinal neuronal networks can be disturbed, which causes the deterioration or even the complete absence of sublesional locomotor activity. In mammals, possibilities of locomotion restoration are much reduced since descending tracts either have very poor regenerative ability or do not regenerate at all. However, in lower vertebrates, there is spontaneous locomotion recuperation after complete spinal cord transection at the mid-trunk level. This phenomenon depends on a translesional descending axon re-growth originating from the brainstem. On the other hand, cellular and molecular mechanisms underlying spinal cord regeneration and in parallel, locomotion restoration of the animal, are not well known. Fibroblast growth factor 2 (FGF-2) plays an important role in different processes such as neural induction, neuronal progenitor proliferation and their differentiation. Studies had shown an over expression of this growth factor after tail amputation. Nestin, a protein specific for intermediate filaments, is considered an early marker for neuronal precursors. It has been recently shown that its expression increases after tail transection in urodeles. Using this marker and western blots, our results show that the number of FGF-2 and FGFR2 mRNAs increases and is correlated with an increase in neurogenesis especially in the central canal lining cells immediately after lesion. This study also confirms that spinal cord re-growth through the lesion site initially follows a rostrocaudal direction. In addition to its role known in neuronal differentiation, FGF-2 could be implicated in the differentiation of ependymal cells into neuronal progenitors.

Keywords: gap replacement; growth factors; locomotion recovery; neurogenesis; spinal cord.


Figures

Figure 1
Figure 1
Imunohistochemical analysis of nestin labeling during spinal cord regeneration. (A) Separated stumps at 1 week (1 W) post-operatively (R: Rostral; C: Caudal; lesion site denoted by a white star). (B) Nestin is seen in the central canal region (arrow), stumps connect and nestin is equally distributed in both parts of the central canal at 2 weeks after transection (2 W: arrows). (C) Continuous cord and nestin is mainly expressed at the lesion site after 15 weeks of transection (15 W: arrow). (D) Normal spinal cord and few traces of nestin are still obvious 24 weeks post-operatively (24 W: arrow). Scale bar: 200 μm.
Figure 2
Figure 2
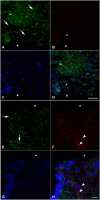
Imunohistochemical analysis of nestin (green) and NF (red) labeling during spinal cord regeneration in the rostral (A–D) and caudal (E–H) stumps after 1 week of spinal cord transection (stars show the lesion site). In (A) and (E), nestin expression shows the orientation of neural progenitor cells towards the lesion site in the rostral and caudal stumps of the regenerating spinal cord respectively (arrows show the orientation direction). The neurofilament marker NF is very faint in (B) although abundant in (F) (arrowheads). (C) and (G) show the nuclei demarked by Bis-Benzimide while (D) is an overlay snapshot showing a single NF-labeled cell (arrowhead) and the abundant nestin labeling surrounding blue nuclei. (H) is an overlay snapshot showing NF-labeled cells far from the lesion site (arrowheads) and the abundant nestin labeling closer to the lesion site. Scale bar for (A–D) = 120 μm; for (E–G) = 20 μm.
Figure 3
Figure 3
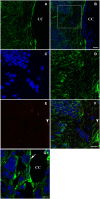
Longitudinal sections (A–F) and a transverse section (G) showing imunohistochemical analysis of nestin (green) and NF (red in E,F) labeling during spinal cord regeneration after 6 weeks of spinal cord transection. In (A), nestin expression increases dramatically. (B) represents an overlay of nestin and bis-benzimide-labeled nuclei. The white square is magnified in (C–F). (C) shows the bis-benzimide-labeled nuclei. (D) shows nestin-labeled cells. The neurofilament marker NF is rare in (E: arrowhead). (F) is an overlay snapshot showing a single NF-labeled cell (arrowhead) and the abundant nestin labeling. In (G), nestin is localizing around the central canal (CC) during spinal cord regeneration, 6 weeks after transection. Scale bar in (B) stands for (A,B) = 70 μm, in (F) stands for (C–F) = 40 μm and in (G) = 20 μm.
Figure 4
Figure 4
Imunohistochemical analysis of nestin (green) and NF (red) labeling during spinal cord regeneration after 24 weeks of spinal cord transection. (A) Faint nestin expression (arrow) situated far from the central canal. NF, arrowheads in (B), is prominent. (C) Nuclei demarked by Bis-Benzimide. (D) is an overlay snapshot showing neurofilament surrounding the blue nuclei (arrowheads). Scale bar = 25 μm.
Figure 5
Figure 5
FGF2 (A–C) and FGFR2 mRNA (D–F) expression (in pre-lesional spinal cord) in sham-operated (A,D) and spinal-transected (B,E) animals at 15 weeks post-operatively. (A) Localization of FGF-2 mRNA in cross sections of spinal cord showing in situ hybridization in the anterior region in sham-operated animals. (B) shows anterior spinal cord in lesioned animals. (D) Localization of FGFR2 mRNA in cross sections of spinal cord showing in situ hybridization in the anterior region in sham-operated animals. (E) shows anterior spinal cord in lesioned animals. All sections are dorsoventrally oriented. Arrows in (A,B,D,E) show the grains demarking hybridized FGF-2 (A,B) and FGFR2 (D,E) mRNAs, while arrowheads point at non labeled cells. Grains demarking hybridized FGF-2 mRNAs are more pronounced in number ventrolaterally (arrows in B) while FGFR2 grain distribution is mainly seen in the ependymal cells, lining the central canal (arrows in E). Scale bar = 40 μm. (C) Comparison between FGF-2 mRNA grain density in sham-operated and lesioned animals. In sham-operated animals, the level of grain density is significantly less compared to spinal-transected animals. (F) Comparison between FGFR2 mRNA grain density in sham-operated and lesioned animals. A slight increase was observed in lesioned animals compared to shams. Symbols above lesioned animals’ bars indicate their statistical significance compared to sham-operated animals’ bars. (**p ≤ 0.01; *p < 0.05).
Figure 6
Figure 6
Immunoblot analysis of FGF-2 expression: (A) shows that a band detected by an anti-FGF-2 antibody is reduced in intact (n = 5) pooled anterior parts of spinal cord: Ant SC (upper left band in intact panel) compared to intact (n = 5) pooled posterior parts of spinal cord: Post SC (upper right band in intact panel). In lesioned animals 15 weeks after transection, the Post SC bands (upper right band in lesioned panel) are less prominent than those of the Ant SC (upper left band in lesioned panel). Sham-operated animals show the same pattern of lesioned ones but at a lesser extent (upper panel of sham). Lower panels show beta-actin in all regions. (B) Ant SC band intensity compared to beta-actin bands. Note the maximum intensity in lesioned animals 15 weeks post-operatively. The symbols above each bar indicate the statistical significance with the sham bar. (C) Post SC band intensity compared to beta-actin bands. Note the non significant intensity increase in lesioned animals 15 weeks post-operatively. The symbols above each bar indicate the statistical significance with the sham Ant SC bar. (***p ≤ 0.001; **p ≤ 0.01).
Figure 7
Figure 7
A schematic representation of the conclusion of our findings: axonal re-growth follows a rostrocaudal direction and is related to FGF-2 and FGFR2 mRNA levels, neuronal differentiation and locomotor recovery. FGF-2 acting through its receptor FGFR2 could be implicated in ependymal cells differentiation into neuronal progenitors expressing NF after becoming adult neurons.

Similar articles

References

    1. Adolf B., Chapouton P., Lam C. S., Topp S., Tannhauser B., Strahle U., et al. . (2006). Conserved and acquired features of adult neurogenesis in the zebrafish telencephalon. Dev. Biol. 295, 278–293. 10.1016/j.ydbio.2006.03.023 - DOI - PubMed
    1. Alibardi L., Meyer-Rochow V. B. (1988). Ultrastructure of the neural component of the regenerating spinal cord in the tails of three species of New Zealand lizards. N. Z. J. Zool. 15, 535–550 10.1080/03014223.1988.10422633 - DOI
    1. Almqvist P. M., Mah R., Lendahl U., Jacobsson B., Hendson G. (2002). Immunohistochemical detection of nestin in pediatric brain tumors. J. Histochem. Cytochem. 50, 147–158. 10.1177/002215540205000203 - DOI - PubMed
    1. Anderson M. J., Choy C. Y., Waxman S. G. (1986). Self-organization of ependyma in regenerating teleost spinal cord: evidence from serial section reconstructions. J. Embryol. Exp. Morphol. 96, 1–18. - PubMed
    1. Anderson M. J., Rossetto D. L., Lorenz L. A. (1994). Neuronal differentiation in vitro from precursor cells of regenerating spinal cord of the adult teleost Apteronotus albifrons. Cell Tissue Res. 278, 243–248. 10.1007/s004410050213 - DOI - PubMed

LinkOut - more resources