. 2015 Jan 12:8:150.
doi: 10.3389/fncir.2014.00150. eCollection 2014.

Spatiotemporal characteristics and pharmacological modulation of multiple gamma oscillations in the CA1 region of the hippocampus

Affiliations

Spatiotemporal characteristics and pharmacological modulation of multiple gamma oscillations in the CA1 region of the hippocampus

Shilpashree Balakrishnan et al. Front Neural Circuits. .

Abstract

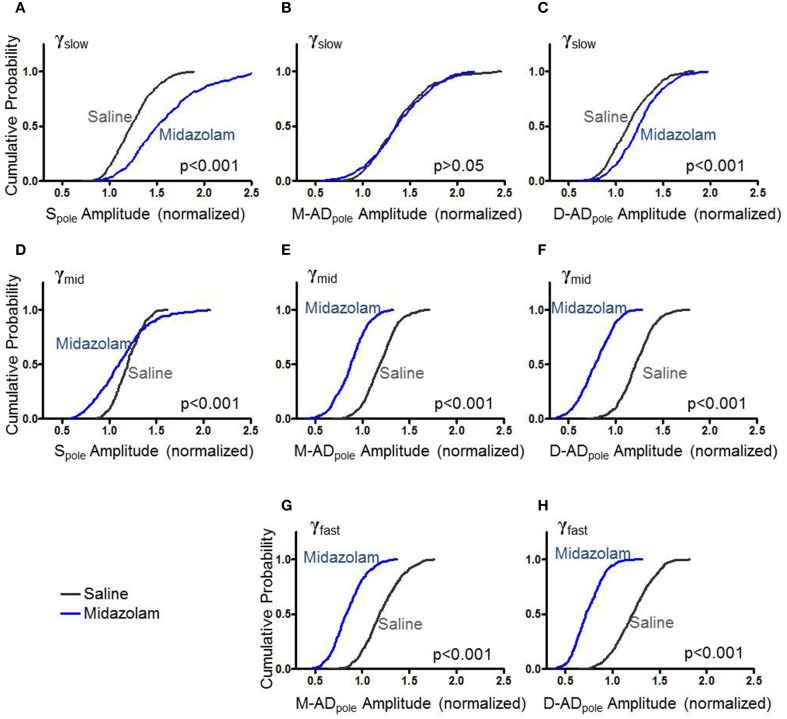
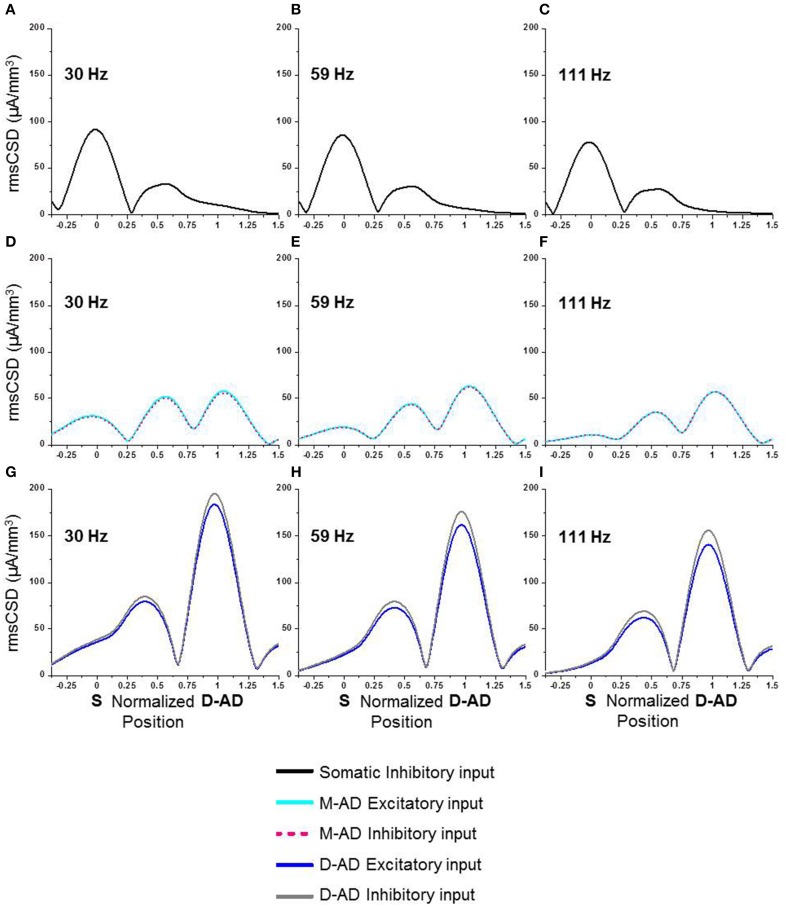
Multiple components of "γ-oscillations" between 30-170 Hz in the CA1 region of the hippocampus have been described, based on their coherence with oscillations in other brain regions and on their cross-frequency coupling with local θ-oscillations. However, it remains unclear whether the different sub-bands are generated by a single broadband oscillator coupled to multiple external inputs, or by separate oscillators that incorporate distinct circuit elements. To distinguish between these possibilities, we used high-density linear array recording electrodes in awake behaving mice to examine the spatiotemporal characteristics of γ-oscillations and their responses to midazolam and atropine. We characterized oscillations using current source density (CSD) analysis, and measured θ-γ phase-amplitude coupling by cross frequency coupling (CFC) analysis. Prominent peaks were present in the CSD signal in the mid- and distal apical dendritic layers at all frequencies, and at stratum pyramidale for γ(slow) (30-45 Hz) and γ(mid) (50-90 Hz), but not γ(fast) (90-170 Hz) oscillations. Differences in the strength and timing of θ-γ(slow) and θ-γ(mid) cross frequency coupling, and a lack of coupling at the soma and mid-apical region for γ(fast) oscillations, indicated that separate circuit components generate the three sub-bands. Midazolam altered CSD amplitudes and cross-frequency coupling in a lamina- and frequency specific manner, providing further evidence for separate generator circuits. Atropine altered CSD amplitudes and θ-γ CFC uniformly at all locations. Simulations using a detailed compartmental model were consistent with γ(slow) and γ(mid) oscillations driven primarily by inputs at the mid-apical dendrites, and γ(fast) at the distal apical dendrite. Our results indicate that multiple distinct local circuits generate γ-oscillations in the CA1 region of the hippocampus, and provide detailed information about their spatiotemporal characteristics.

Keywords: atropine; compartmental modeling; cross frequency coupling; current source density analysis; gamma oscillations; midazolam; theta oscillations.


Figures

Figure 1
Figure 1
Methods in vivo and in silico. (A) Histology showing electrode tract in the left dorsal CA1 region: p, stratum pyramidale; r, stratum radiatum; lm, stratum lacunosum-moleculare. (B) Experimental protocol for midazolam and saline-control and atropine and saline-control administration. Data was analyzed for the first 3-min of the pre-injection baseline and treatment periods for midazolam/saline-control and for the respective 10-min period for atropine/saline-control. (C) Left panel—example traces (2 s) from 16 channels in an exploring mouse. The trace from recording site 4 was situated at stratum pyramidale. The γ-oscillations are seen to ride on the θ-oscillations (black smooth line—θ filtered signal). Right panel shows the power spectral density (PSD) at different frequencies of raw trace at soma and D-AD (black—pre-injection baseline, gray—midazolam). (D) Schematic of model CA1 neuron used in simulations, with 16 recording sites spaced 50 μm apart. The arrows point to the locations of the different inputs tested independently (Soma-inhibitory input alone, Mid-apical dendritic (M-AD)—excitatory/inhibitory input and distal apical dendritic (D-AD)—excitatory/inhibitory input).
Figure 2
Figure 2
Spatial profile of CSD derived from LFP for gamma oscillations in CA1. One second example 3-D CSD plots of (A) γslow (30–45 Hz), (B) γmid (50–90 Hz), and (C) γfast (90–170 Hz) oscillations. (D–F) Each trace shows root mean squared values of CSD (rmsCSD) for 1-s data segments during the pre-injection baseline recording session in an exploring mouse, for γslow, γmid, and γfast oscillations respectively. In all bands the amplitude of the CSD was highest at the fissure (electrodes 13–14), with a large peak also present in the mid-apical region. The relative amplitude of the somatic peak decreased as the frequency increased, and was absent for γfast.
Figure 3
Figure 3
Effect of midazolam on the amplitude of rmsCSD peaks of γslow (A–C), γmid (D–F), and γfast oscillations (G,H). (A) Midazolam significantly increased the rmsCSD amplitude of γslow oscillations at the somatic region (Spole) compared to saline-control. (B) Midazolam did not change the amplitude of γslow at the mid-apical dendritic peak (M-ADpole). (C) There was a slight but significant increase in the amplitude of γslow at the distal apical dendrite rmsCSD peak (D-ADpole). (D–F) Midazolam decreased the rmsCSD amplitudes of γmid oscillations at all locations. (G,H) Midazolam decreased the rmsCSD amplitudes of M-ADpole and D-ADpole of γfast oscillations; no Spole was present for this component.
Figure 4
Figure 4
Atropine increases amplitude of CSD for all bands at all sites. (A–C) With respect to saline-control, atropine significantly increased the amplitudes of Spole, M-ADpole, and D-ADpole respectively of γslow oscillations for all animals (atropine/saline-control, Spole: n = 1875/871 data points from 3/3 mice; M-AD and D-ADpole: n = 2154(M-ADpole), 2192(D-ADpole)/871 data points from 5/4 mice p < 0.001 One-Way ANOVA). (D–F), Similarly for γmid, atropine significantly increased the rmsCSD amplitudes at all locations, though the difference was less at the D-ADpole (atropine/saline-control, Spole: n = 991/175 data points from 3/1 mice and M-ADpole: n = 1755/1054 data points from 5/4 mice p < 0.001; D-ADpole n = 1755/1054 data points from 5/4 mice p = 0.001–0.01) One-Way ANOVA. (G,H) For γfast oscillations, atropine significantly increased the amplitude of rmsCSD at the M-ADpole and D-ADpole (atropine/saline-control, n = 2671(M-ADpole), 2670(D-ADpole)/1205 data points from 5/4 mice p < 0.001 One-Way ANOVA).
Figure 5
Figure 5
Example of comodulogram and phase amplitude coupling at somatic, mid-apical and distal apical dendrite recording sites, for a single animal. (A–C) Comodulogram showing the modulation Index (MI) plotted as a function of phase-frequency and amplitude-frequency from a single animal. Hotter colors indicate larger amplitude modulation. (D,G,J) γslow (30–45 Hz)/γmid(50–90 Hz) /γfast (90–170 Hz) amplitude modulation by θ (6–10 Hz) phase, binned into 18 subdivisions of 20° each at the somatic recording site. (E,H,K) The γslow, γmid, and γfast amplitudes from the recording site at the mid-apical dendrite (M-AD) shows relative amplitude modulation by θ similar to that seen at the somatic site; however the phase of θ at which gamma amplitude was maximum were offset by 120° for γslow and 20° for γmid. (F,I,L) At the distal apical dendrite (D-AD) the amplitude coupling was anti-phasic (offset by 180°) for γslow and γmid with respect to soma. In addition the θ-γfast coupling was visible primarily only at D-AD [Phase amplitude coupling measurements shown in this figure were obtained from pre-injection baseline data in an exploring animal using the method described by Tort et al. (2010)].
Figure 6
Figure 6
Summary of midazolam effects on θ-γslow and θ-γmid cross frequency coupling. (A) Comodulogram at the somatic recording site following saline administration. (B) Comodulogram following midazolam administration at the somatic recording site, from the same mouse shown in (A). Peak MI values were shifted to lower amplitude- and phase-frequencies. (C,D) γslow amplitude modulation at the somatic recording site as a function of θ-phase following administration of saline (C) or midazolam (D). (E,F) γmid amplitude modulation at the somatic recording site as a function of θ-phase following administration of saline (E) or midazolam (F). (G,H) Grouped data from all animals. Midazolam increased θ-γslow coupling (G) and decreased θ-γmid coupling (H) at the somatic recording site. No significant effects were seen at mid-apical dendrite (M-AD) or distal-apical dendrites (D-AD). *p < 0.05; **p < 0.01.
Figure 7
Figure 7
Atropine effect on θ-γslow and θ-γmid cross frequency coupling. (A,B) No significant changes in Modulation Index (MI) were observed following atropine administration compared to saline-control, for θ-γslow (A) or θ-γmid cross frequency coupling, at the somatic, mid-apical dendrite (M-AD) or distal apical dendritic (D-AD) recording sites.
Figure 8
Figure 8
Computer simulations of spatial spread of γ-oscillations at different frequencies in a compartment model of a CA1 pyramidal neuron. (A–C) Inhibitory input imposed exclusively at the soma. (D–F) Excitatory (cyan) or inhibitory (pink) input at the mid-apical dendrite (M-AD). (G–I) Excitatory (blue) or inhibitory (gray) input at the distal apical dendrite (D-AD). (A,D,G) 30 Hz input (~γslow) at soma and distal dendrite spread to mid-apical dendrite, and M-AD input spread to both soma and D-AD. (B,E,H) 59 Hz input (~γmid) produced a pattern similar to 30 Hz input, but with less spread to soma and more to D-AD. (C,F,I) 111 Hz input (~γfast) produced a pattern similar to 30 and 59 Hz inputs, but with even greater attenuation of spread to the soma. X-axis positions are normalized, with “0” corresponding to soma and “1” to the D-AD inputs.

References

    1. Axmacher N., Henseler M. M., Jensen O., Weinreich I., Elger C. E., Fell J. (2010). Cross-frequency coupling supports multi-item working memory in the human hippocampus. Proc. Natl. Acad. Sci. 107, 3228–3233. 10.1073/pnas.0911531107 - DOI - PMC - PubMed
    1. Balakrishnan S., Pearce R. A. (2014). Midazolam and atropine alter theta oscillations in the hippocampal CA1 region by modulating both the somatic and distal dendritic dipoles. Hippocampus 24, 1212–1231. 10.1002/hipo.22307 - DOI - PMC - PubMed
    1. Battaglia F. P., Benchenane K., Sirota A., Pennartz C. M. A., Wiener S. I. (2011). The hippocampus: hub of brain network communication for memory. Trends Cogn. Sci. 15, 310–318. 10.1016/j.tics.2011.05.008 - DOI - PubMed
    1. Bédard C., Kröger H., Destexhe A. (2006). Model of low-pass filtering of local field potentials in brain tissue. Phys. Rev. E Stat. Nonlin. Soft Matter Phys. 73:051911. 10.1103/PhysRevE.73.051911 - DOI - PubMed
    1. Belluscio M. A., Mizuseki K., Schmidt R., Kempter R., Buzsáki G. (2012). Cross-frequency phase–phase coupling between theta and gamma oscillations in the hippocampus. J. Neurosci. 32, 423–435. 10.1523/JNEUROSCI.4122-11.2012 - DOI - PMC - PubMed

Publication types

LinkOut - more resources