

Calibrating Doppler imaging of preterm intracerebral circulation using a microvessel flow phantom
- PMID: 25628560
- PMCID: PMC4292584
- DOI: 10.3389/fnhum.2014.01068
Calibrating Doppler imaging of preterm intracerebral circulation using a microvessel flow phantom
Abstract
Introduction: Preterm infants are born during critical stages of brain development, in which the adaptive capacity of the fetus to extra-uterine environment is limited. Inadequate brain perfusion has been directly linked to preterm brain damage. Advanced high-frequency ultrasound probes and processing algorithms allow visualization of microvessels and depiction of regional variation. To assess whether visualization and flow velocity estimates of preterm cerebral perfusion using Doppler techniques are accurate, we conducted an in vitro experiment using a microvessel flow phantom.
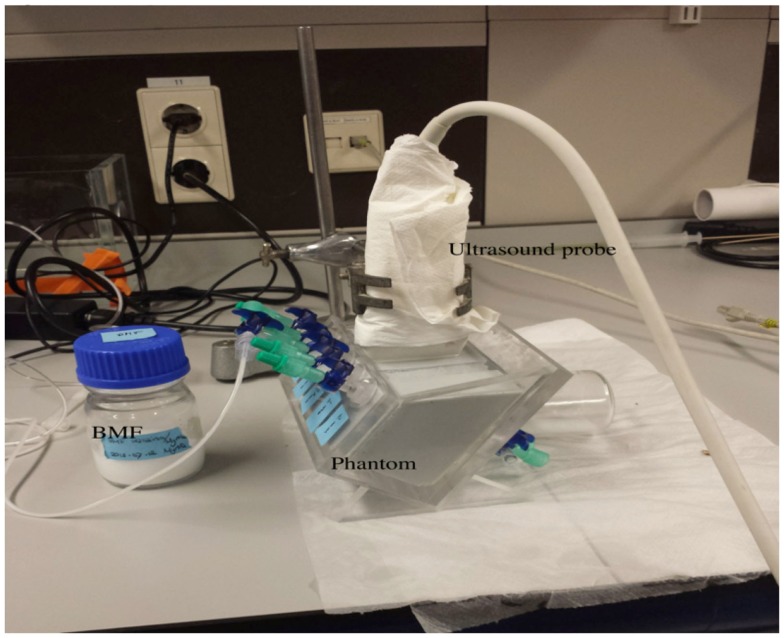
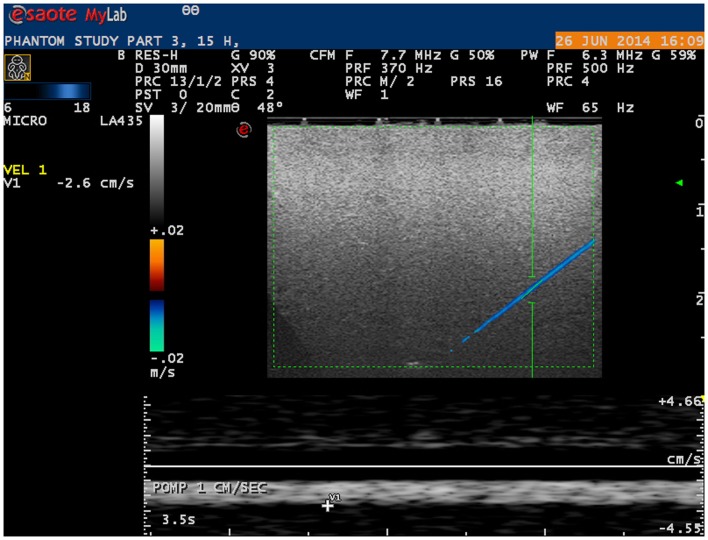
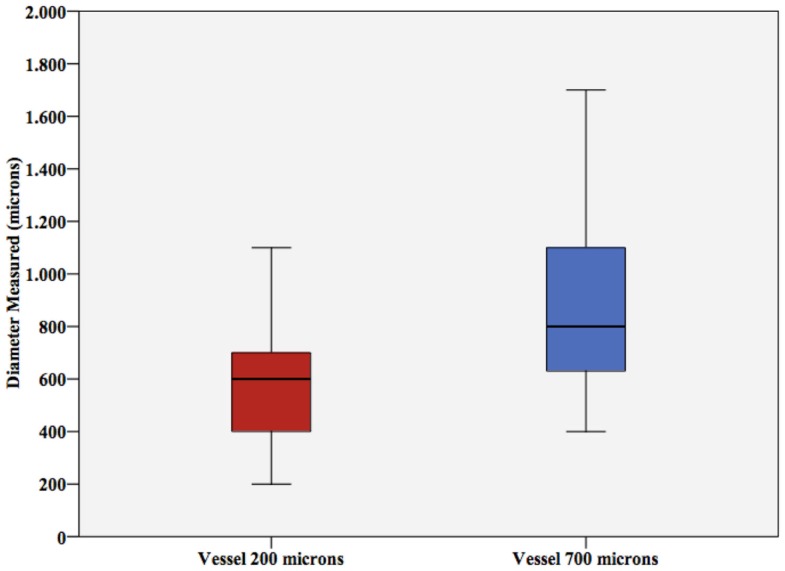
Materials and methods: An in-house developed flow phantom containing two microvessels (inner diameter 200 and 700 μm) with attached syringe pumps, filled with blood-mimicking fluid, was used to generate non-pulsatile perfusion of variable flow. Measurements were performed using an Esaote MyLab70 scanner.
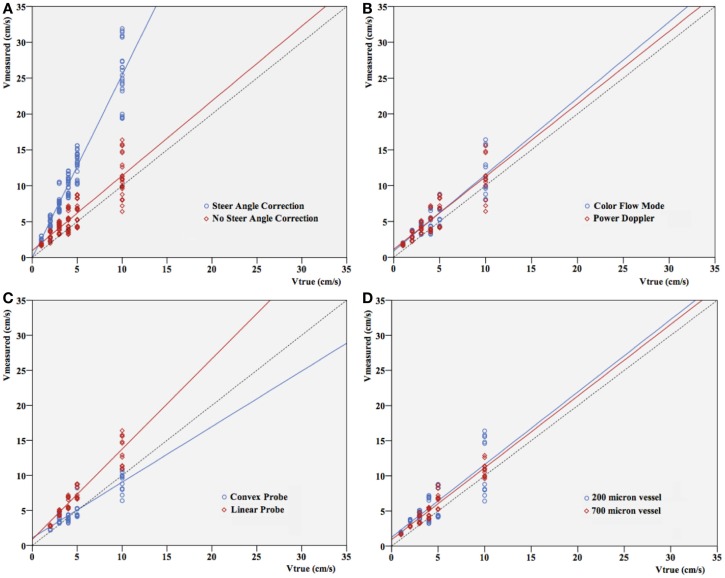
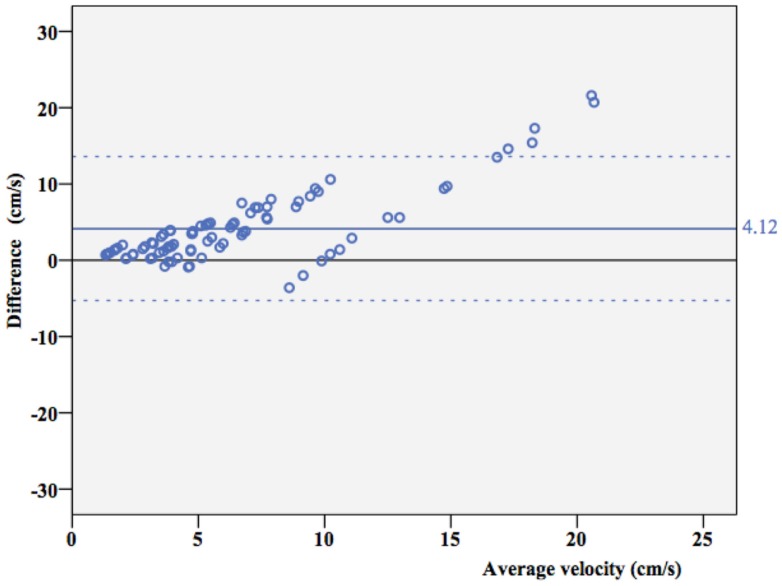
Results: Microvessel mimicking catheters with velocities as low as 1 cm/s were adequately visualized with a linear ultrasound probe. With a convex probe, velocities <2 cm/s could not be depicted. Within settings, velocity and diameter measurements were highly reproducible [intra-class correlation 0.997 (95% CI 0.996-0.998) and 0.914 (0.864-0.946)]. Overall, mean velocity was overestimated up to threefold, especially in high velocity ranges. Significant differences were seen in velocity measurements when using steer angle correction and in vessel diameter estimation (p < 0.05).
Conclusion: Visualization of microvessel-size catheters mimicking small brain vessels is feasible. Reproducible velocity and diameter results can be obtained, although important overestimation of the values is observed. Before velocity estimates of microcirculation can find its use in clinical practice, calibration of the ultrasound machine for any specific Doppler purpose is essential. The ultimate goal is to develop a sonographic tool that can be used for objective study of regional perfusion in routine practice.
Keywords: Doppler; calibration; cerebral blood flow; cerebral circulation; cerebral perfusion; flow phantom; microcirculation; preterm brain.
Figures
Similar articles
-
A realistic flow phantom model of the carotid artery in preterm infants for training and research.Ultrasound. 2020 Aug;28(3):145-154. doi: 10.1177/1742271X20902189. Epub 2020 Feb 3. Ultrasound. 2020. PMID: 32831887 Free PMC article.
-
A Microfluidics-based Pulpal Arteriole Blood Flow Phantom for Validation of Doppler Ultrasound Devices in Pulpal Blood Flow Velocity Measurement.J Endod. 2016 Nov;42(11):1660-1666. doi: 10.1016/j.joen.2016.08.008. Epub 2016 Sep 17. J Endod. 2016. PMID: 27651041
-
[Intracranial blood flow velocities evaluated by color Doppler (duplex) in preterm infants].Arq Neuropsiquiatr. 2004 Mar;62(1):68-74. doi: 10.1590/s0004-282x2004000100012. Epub 2004 Apr 28. Arq Neuropsiquiatr. 2004. PMID: 15122436 Portuguese.
-
Transcranial Doppler ultrasonography in intensive care.Eur J Anaesthesiol Suppl. 2008;42:167-73. doi: 10.1017/S0265021507003341. Eur J Anaesthesiol Suppl. 2008. PMID: 18289437 Review.
-
Sonographic depiction of microvessel perfusion: principles and potential.J Ultrasound Med. 2004 Nov;23(11):1499-506. doi: 10.7863/jum.2004.23.11.1499. J Ultrasound Med. 2004. PMID: 15498915 Review.
Cited by
-
Custom-made flow phantoms for quantitative ultrasound microvessel imaging.Ultrasonics. 2023 Sep;134:107092. doi: 10.1016/j.ultras.2023.107092. Epub 2023 Jun 22. Ultrasonics. 2023. PMID: 37364357 Free PMC article.
-
Diagnostic and predictive value of Doppler ultrasound for evaluation of the brain circulation in preterm infants: a systematic review.Pediatr Res. 2020 Mar;87(Suppl 1):50-58. doi: 10.1038/s41390-020-0777-x. Pediatr Res. 2020. PMID: 32218536 Free PMC article.
-
Editorial: Bridging the gap before and after birth: methods and technologies to explore the functional neural development in humans.Front Hum Neurosci. 2015 Oct 14;9:571. doi: 10.3389/fnhum.2015.00571. eCollection 2015. Front Hum Neurosci. 2015. PMID: 26528170 Free PMC article. No abstract available.
-
A realistic flow phantom model of the carotid artery in preterm infants for training and research.Ultrasound. 2020 Aug;28(3):145-154. doi: 10.1177/1742271X20902189. Epub 2020 Feb 3. Ultrasound. 2020. PMID: 32831887 Free PMC article.
-
Precision Medicine in Neonates: A Tailored Approach to Neonatal Brain Injury.Front Pediatr. 2021 May 19;9:634092. doi: 10.3389/fped.2021.634092. eCollection 2021. Front Pediatr. 2021. PMID: 34095022 Free PMC article. Review.
References
-
- Gill R. (2012). The Physics and Technology of Diagnostic Ultrasound. Sydney: High Frequency Publishing.
LinkOut - more resources
Full Text Sources
Other Literature Sources