. 2015 Jan 13:6:347.
doi: 10.3389/fnagi.2014.00347. eCollection 2014.

Age-group differences in speech identification despite matched audiometrically normal hearing: contributions from auditory temporal processing and cognition

Affiliations

Age-group differences in speech identification despite matched audiometrically normal hearing: contributions from auditory temporal processing and cognition

Christian Füllgrabe et al. Front Aging Neurosci. .

Abstract

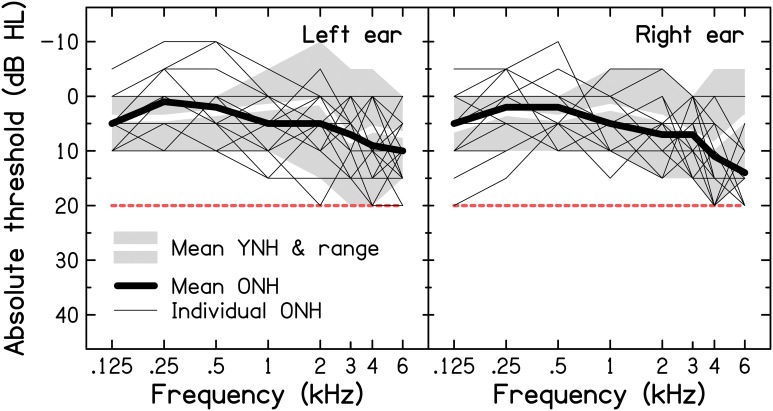
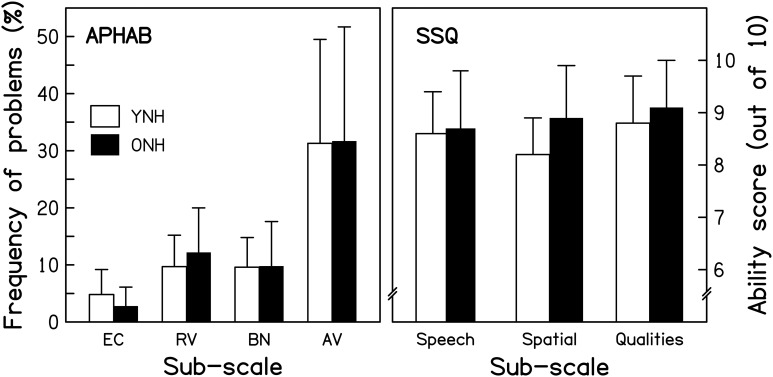
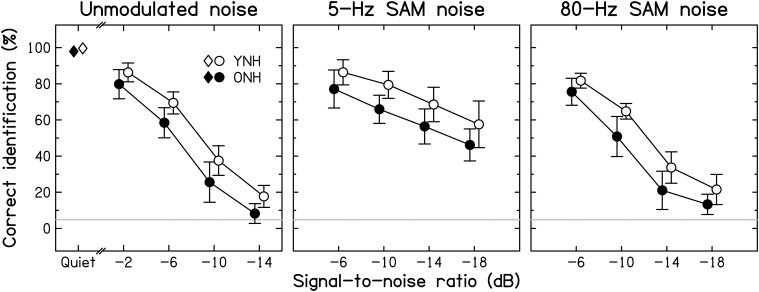
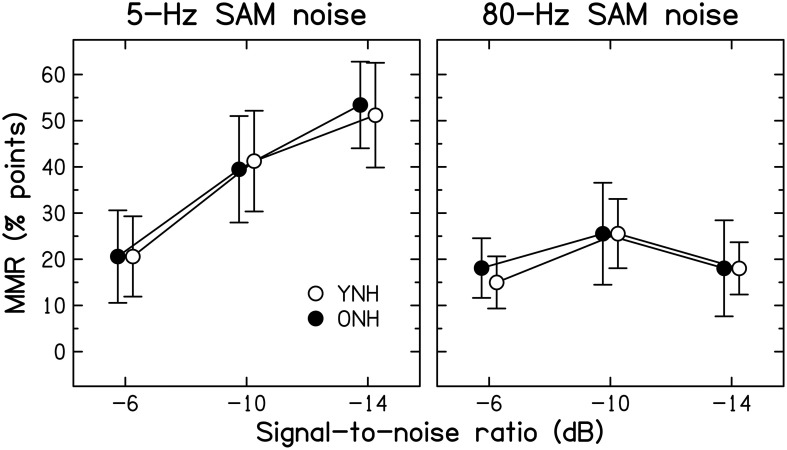
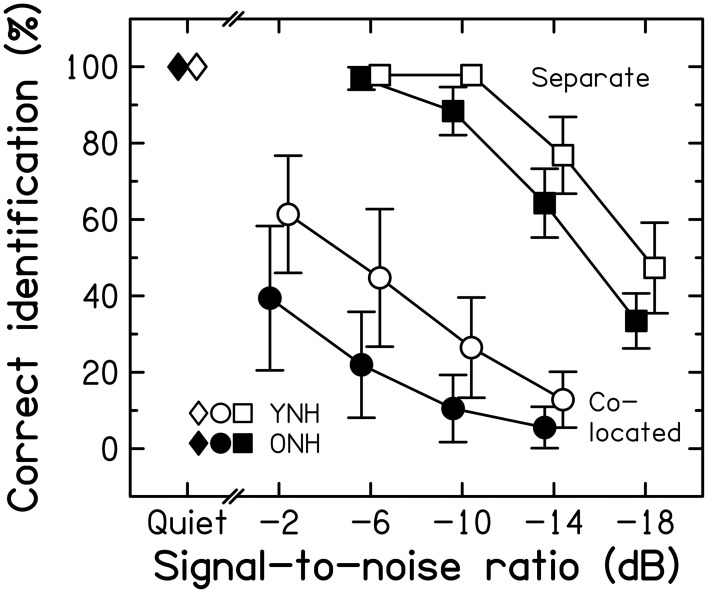
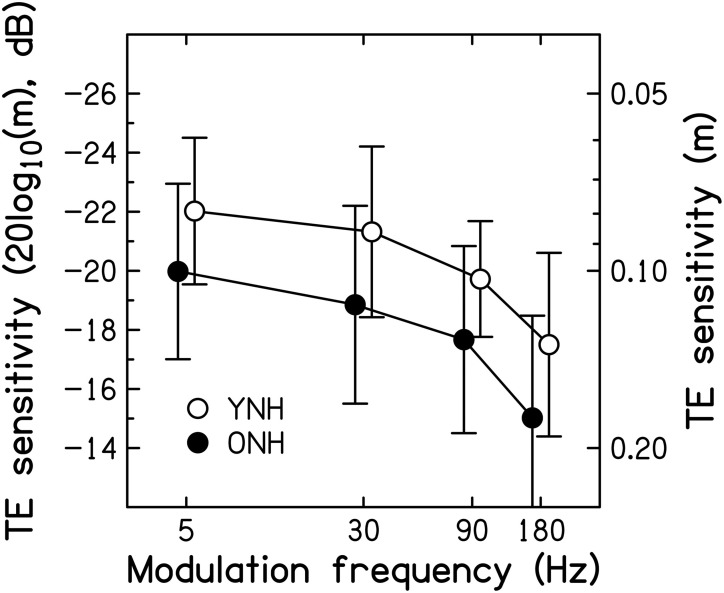
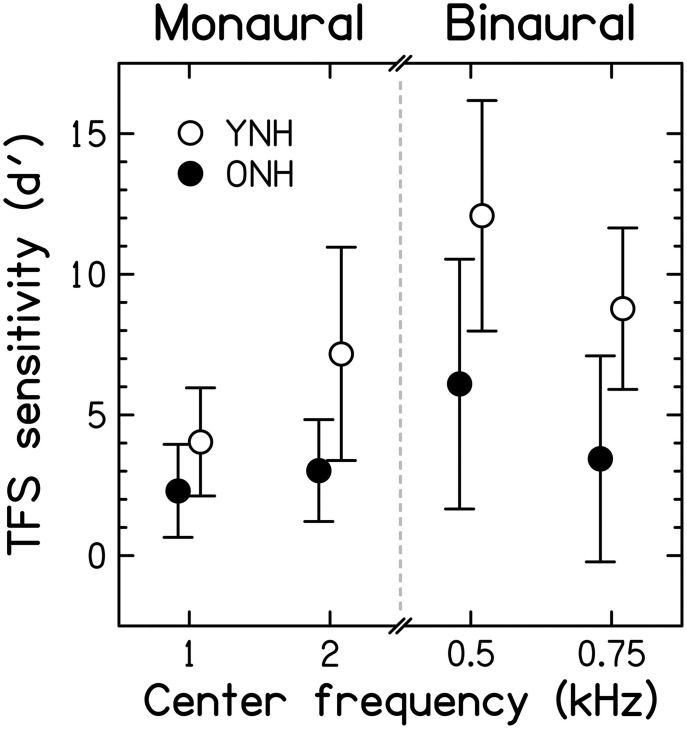
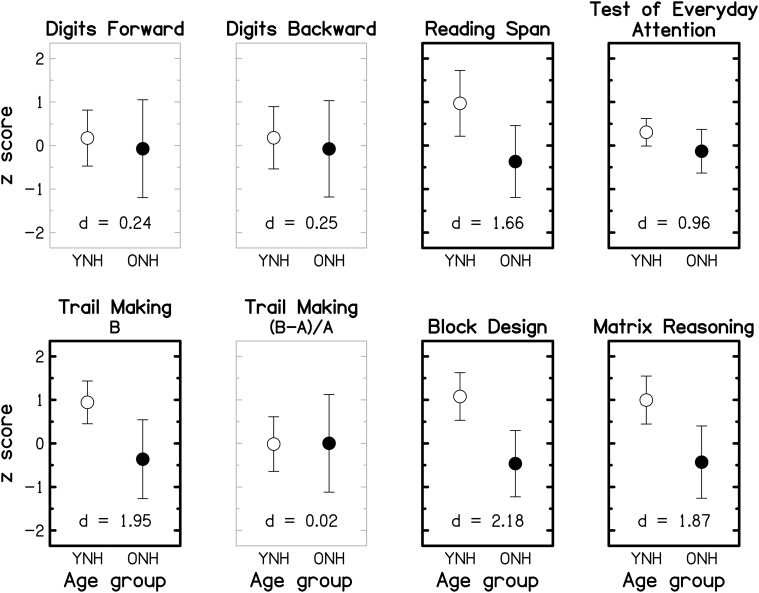
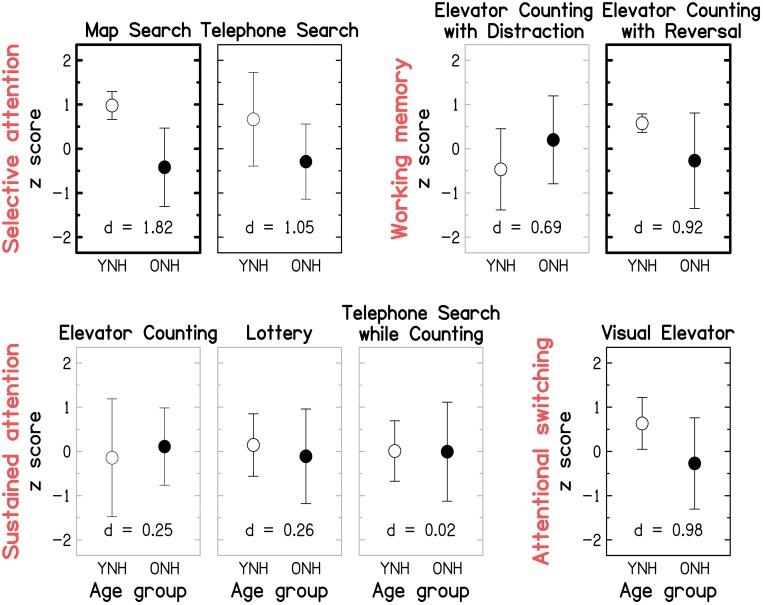
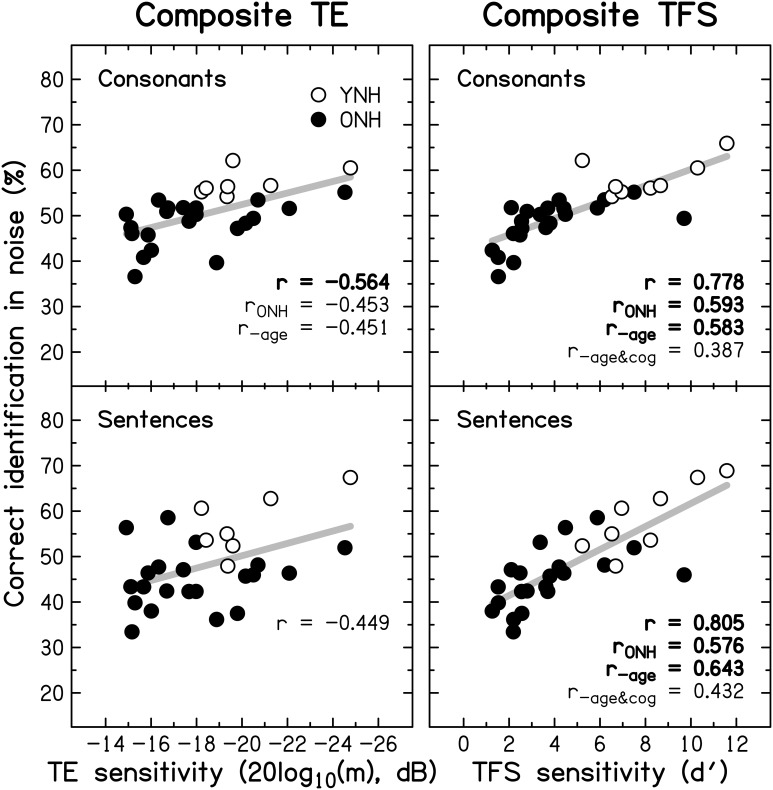
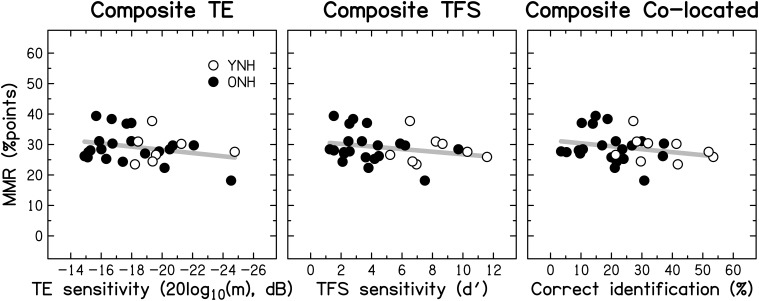
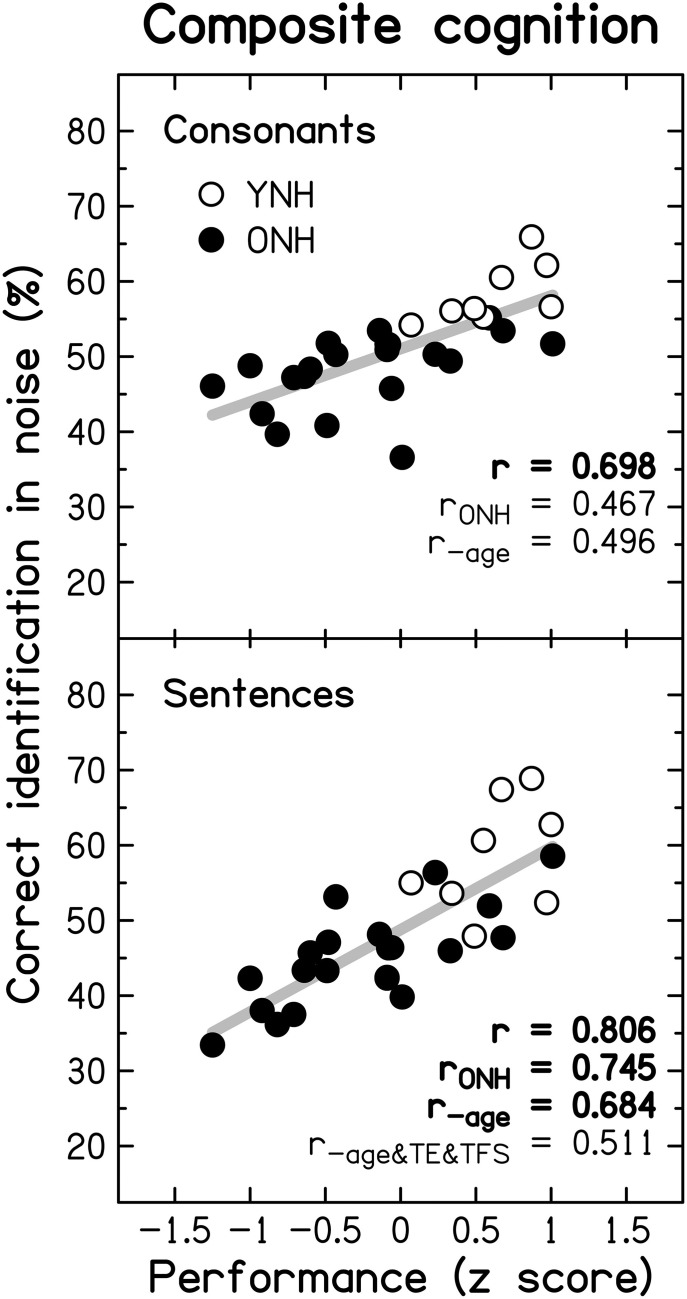
Hearing loss with increasing age adversely affects the ability to understand speech, an effect that results partly from reduced audibility. The aims of this study were to establish whether aging reduces speech intelligibility for listeners with normal audiograms, and, if so, to assess the relative contributions of auditory temporal and cognitive processing. Twenty-one older normal-hearing (ONH; 60-79 years) participants with bilateral audiometric thresholds ≤ 20 dB HL at 0.125-6 kHz were matched to nine young (YNH; 18-27 years) participants in terms of mean audiograms, years of education, and performance IQ. Measures included: (1) identification of consonants in quiet and in noise that was unmodulated or modulated at 5 or 80 Hz; (2) identification of sentences in quiet and in co-located or spatially separated two-talker babble; (3) detection of modulation of the temporal envelope (TE) at frequencies 5-180 Hz; (4) monaural and binaural sensitivity to temporal fine structure (TFS); (5) various cognitive tests. Speech identification was worse for ONH than YNH participants in all types of background. This deficit was not reflected in self-ratings of hearing ability. Modulation masking release (the improvement in speech identification obtained by amplitude modulating a noise background) and spatial masking release (the benefit obtained from spatially separating masker and target speech) were not affected by age. Sensitivity to TE and TFS was lower for ONH than YNH participants, and was correlated positively with speech-in-noise (SiN) identification. Many cognitive abilities were lower for ONH than YNH participants, and generally were correlated positively with SiN identification scores. The best predictors of the intelligibility of SiN were composite measures of cognition and TFS sensitivity. These results suggest that declines in speech perception in older persons are partly caused by cognitive and perceptual changes separate from age-related changes in audiometric sensitivity.

Keywords: aging; cognition; normal hearing; speech identification; temporal envelope; temporal fine structure.


Figures

Figure 1
Figure 1
Results of pure-tone air-conduction audiometry for the left (left panel) and right ears (right panel) of the nine YNH and 21 ONH participants. The thin and thick black lines represent the individual and mean audiograms of the ONH participants. The thick white lines and associated light-gray shaded areas represent the mean audiograms and ranges of audiometric thresholds for the YNH participants, respectively. The dashed red line indicates the audiometric inclusion criteria used in the present study.
Figure 2
Figure 2
Scores for the YNH (open bars) and ONH (filled bars) participants for two questionnaires. For the Abbreviated Profile of Hearing Aid Benefit (APHAB; left panel), responses in terms of frequency of experiencing the described problems are averaged for each of four sub-categories: Ease of communication (EC), Reverberation (RV), Background noise (BN), and Aversiveness (AV). For the Speech, Spatial, and Qualities of hearing scale (SSQ; right panel), responses on an 11-point scale (0–10, with greater scores reflecting less disability) are averaged for the sub-categories of Speech hearing (14 questions), Spatial hearing (17 questions), and Qualities of hearing (19 questions). Note that more hearing difficulties are indicated by taller and smaller bars in the left and right panels, respectively.
Figure 3
Figure 3
Average consonant-identification performance in different listening conditions for YNH (open symbols) and ONH (filled symbols) participants. Identification scores are given for the quiet condition (diamonds) and as a function of the signal-to-noise ratio (SNR) for the unmodulated, 5-Hz SAM, and 80-Hz SAM noise conditions (left, middle, and right panels, respectively). Here, and in the following figures, data points for the two groups are slightly displaced horizontally to aid visibility. Chance-level performance is indicated by the gray horizontal lines. Error bars represent ±1 SD.
Figure 4
Figure 4
Average amount of modulation masking release (MMR, in percentage points) for YNH (open symbols) and ONH (filled symbols) participants. MMR is the difference in scores obtained using an SAM noise [SAM frequency = 5 Hz (left panel) or 80 Hz (right panel)] and an unmodulated noise.
Figure 5
Figure 5
Average speech-identification scores for three listening conditions for the YNH (open symbols) and ONH (filled symbols) participants. Scores are given for the quiet condition (diamonds) and as a function of the SNR for the “co-located” (circles) and the “separate” conditions (squares). Error bars represent ±1 SD.
Figure 6
Figure 6
Thresholds for detecting SAM, expressed as 20log10(m) in dB on the left axis, and as m on the right axis, as a function of modulation frequency in Hz. Average thresholds for the YNH and ONH participants are indicated by the open and filled symbols, respectively. Error bars represent ±1 SD. Better sensitivity is toward the top of the figure.
Figure 7
Figure 7
Scores for TFS sensitivity, expressed in terms of the sensitivity index, d′, for the two fundamental frequencies used in the monaural TFS1 test and the two pure-tone frequencies used in the binaural TFS-LF test. Open and filled symbols denote results for the YNH and ONH participants, respectively. Error bars represent ±1 SD. Better TFS sensitivity is toward the top of the figure.
Figure 8
Figure 8
Group-mean performance (in z-scores) for YNH (open symbols) and ONH (filled symbols) participants on different cognitive tasks. Error bars represent ±1 SD. Gray panel frames indicate non-significant group differences (p > 0.05). Bold black panel frames denote significant results at p ≤ 0.05 that remained significant after applying a Holm-Bonferroni correction. The effect size is given by Cohen's d at the bottom of each panel.
Figure 9
Figure 9
Group-mean performance (in z-scores) for YNH (open symbols) and ONH (filled symbols) participants on each of the eight sub-tests of the Test of Everyday Attention. Sub-tests are grouped by the underlying attentional processes (see red labels) they are assumed to assess according to Robertson et al. (1996): Selective attention (Map Search, Telephone Search), Audio-verbal working memory (Elevator Counting with Distraction, Elevator Counting with Reversal), Sustained attention (Elevator Counting, Lottery, Telephone Search while Counting), and Attentional switching (Visual Elevator). Gray panel frames indicate non-significant group differences (p > 0.05). Black panel frames denote significant results at p ≤ 0.05. Bold panel frames indicate significant results after applying a Holm-Bonferroni correction. Otherwise as Figure 8.
Figure 10
Figure 10
Scatter plots of composite sensitivity to TE (left panel) and TFS (right panel) vs. composite consonant (top row) and sentence (bottom row) identification in noise. The thick gray line represents the best linear fit to the data from the entire group composed of YNH (open symbols) and ONH participants (filled symbols). Significant (at p ≤ 0.05; uncorrected) correlation coefficients for all participants (r), for the ONH participants only (rONH), and for all participants with age (r−age) or with age and composite cognition (r−age&cog) partialled out, are given in each panel. Bold font indicates significance at p ≤ 0.001.
Figure 11
Figure 11
Scatter plots of MMR for consonant identification vs. composite sensitivity to TE (left panel), composite sensitivity to TFS (middle panel), and composite sentence identification in the presence of co-located two-talker babble (right panel). Otherwise as Figure 10.
Figure 12
Figure 12
Scatter plots of composite cognition vs. consonant (top row) and sentence identification in noise (bottom row). Significant (at p ≤ 0.05; uncorrected) correlation coefficients for all participants (r), for the ONH participants only (rONH), and for all participants with age (r−age) or with age and composite TE and TFS sensitivity (r−age&TE&TFS) partialled out, are given in each panel. Otherwise as Figure 10.

References

    1. Agrawal Y., Platz E. A., Niparko J. K. (2008). Prevalence of hearing loss and differences by demographic characteristics among US adults: data from the national health and nutrition examination survey, 1999-2004. Arch. Intern. Med. 168, 1522–1530. 10.1001/archinte.168.14.1522 - DOI - PubMed
    1. Akeroyd M. A. (2008). Are individual differences in speech reception related to individual differences in cognitive ability? A survey of twenty experimental studies with normal and hearing-impaired adults. Int. J. Audiol. 47(Suppl. 2), S53–S71. 10.1080/14992020802301142 - DOI - PubMed
    1. Arbuthnott K., Frank J. (2000). Trail making test, part B as a measure of executive control: validation using a set-switching paradigm. J. Clin. Exp. Neuropsychol. 22, 518–528. 10.1076/1380-3395(200008)22:4;1-0;FT518 - DOI - PubMed
    1. Arlinger S. (2003). Negative consequences of uncorrected hearing loss–a review. Int. J. Audiol. 42(Suppl. 2), 2S17–2S20. 10.3109/14992020309074639 - DOI - PubMed
    1. Arlinger S., Lunner T., Lyxell B., Pichora-Fuller M. K. (2009). The emergence of cognitive hearing science. Scand. J. Psychol. 50, 371–384. 10.1111/j.1467-9450.2009.00753.x - DOI - PubMed

LinkOut - more resources