. 2015 Jun;99(6):1156-64.
doi: 10.1097/TP.0000000000000511.

Characteristics of Circulating Donor Human Leukocyte Antigen-specific Immunoglobulin G Antibodies Predictive of Acute Antibody-mediated Rejection and Kidney Allograft Failure

Affiliations

Characteristics of Circulating Donor Human Leukocyte Antigen-specific Immunoglobulin G Antibodies Predictive of Acute Antibody-mediated Rejection and Kidney Allograft Failure

Dinesh Kannabhiran et al. Transplantation. 2015 Jun.

Abstract

Background: Characteristics of pretransplant antibodies directed at donor human leukocyte antigen (HLA) donor-specific antibodies (DSA) associated with adverse outcomes in kidney transplant recipients are being elucidated but uncertainties exist.

Methods: We prospectively screened pretransplant sera from 543 kidney recipients using single antigen bead assays and identified 154 patients with and 389 without DSA. We investigated the association of DSA features to acute rejection and graft failure.

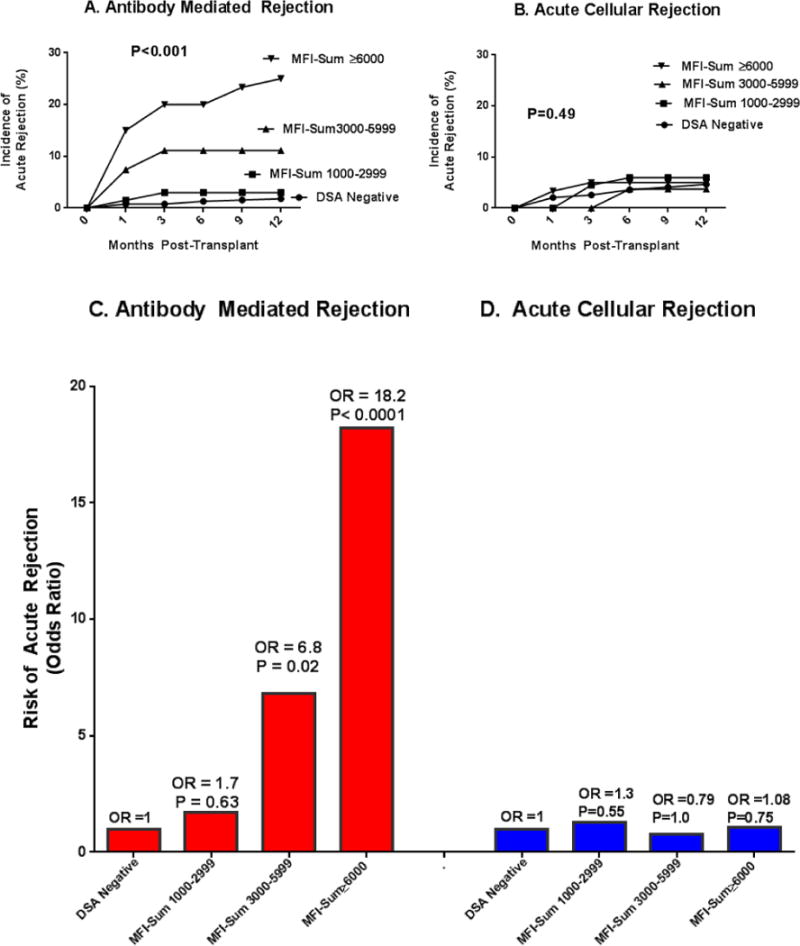
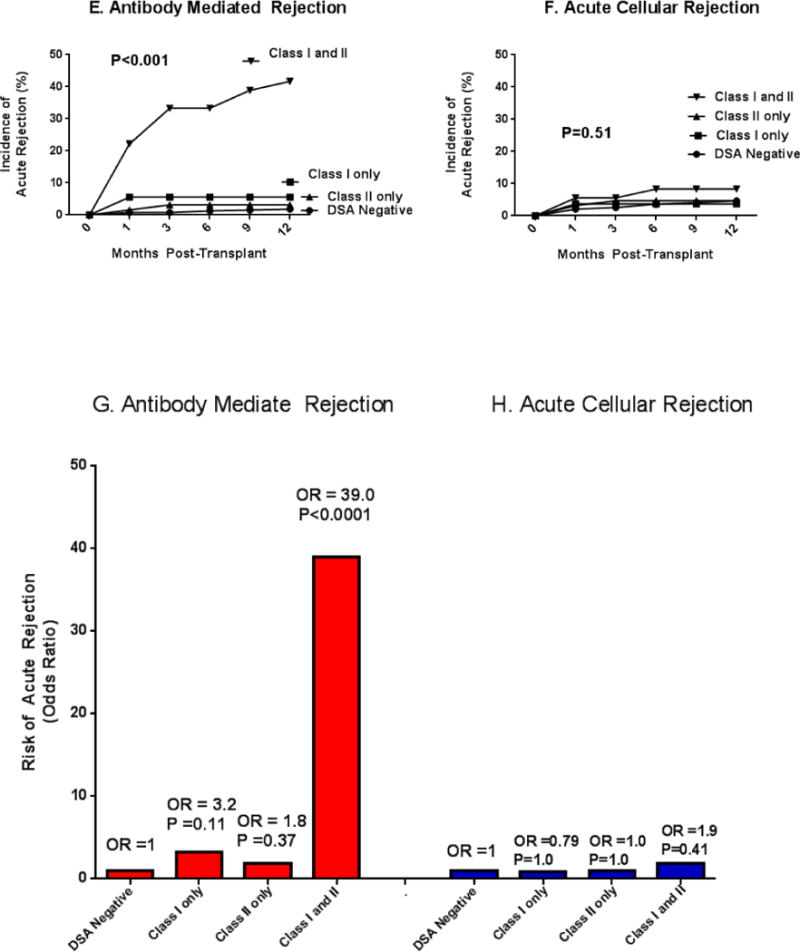
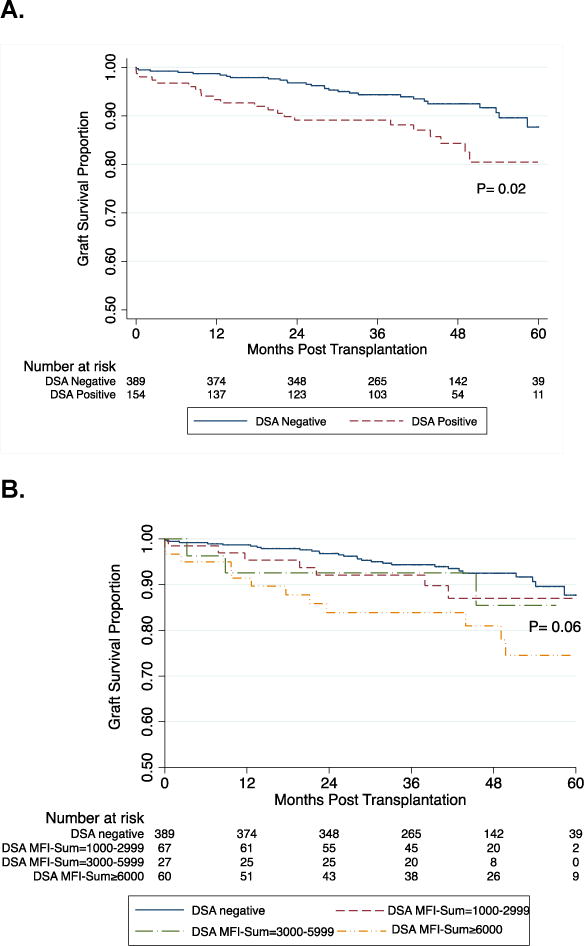
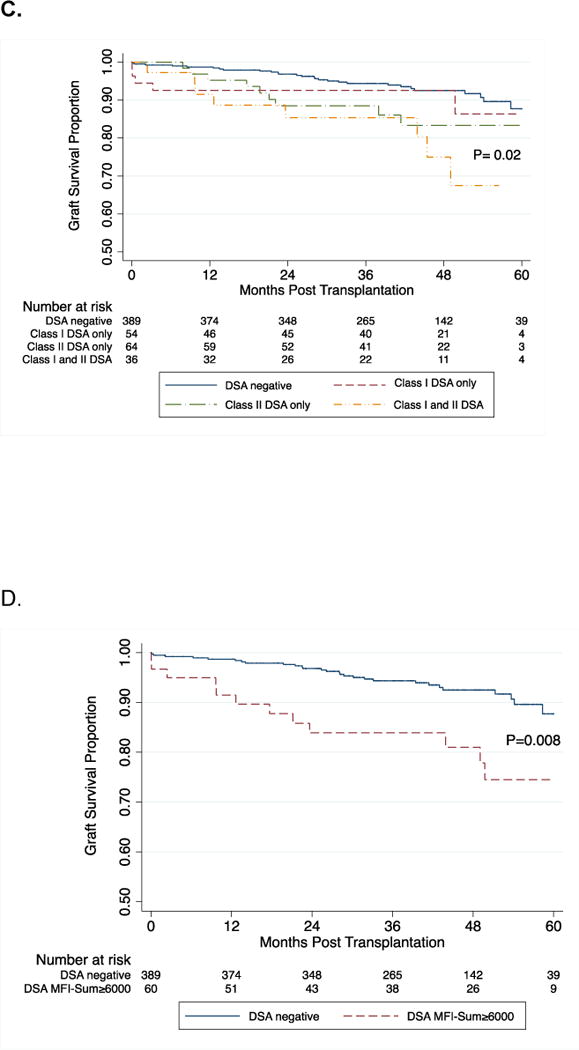
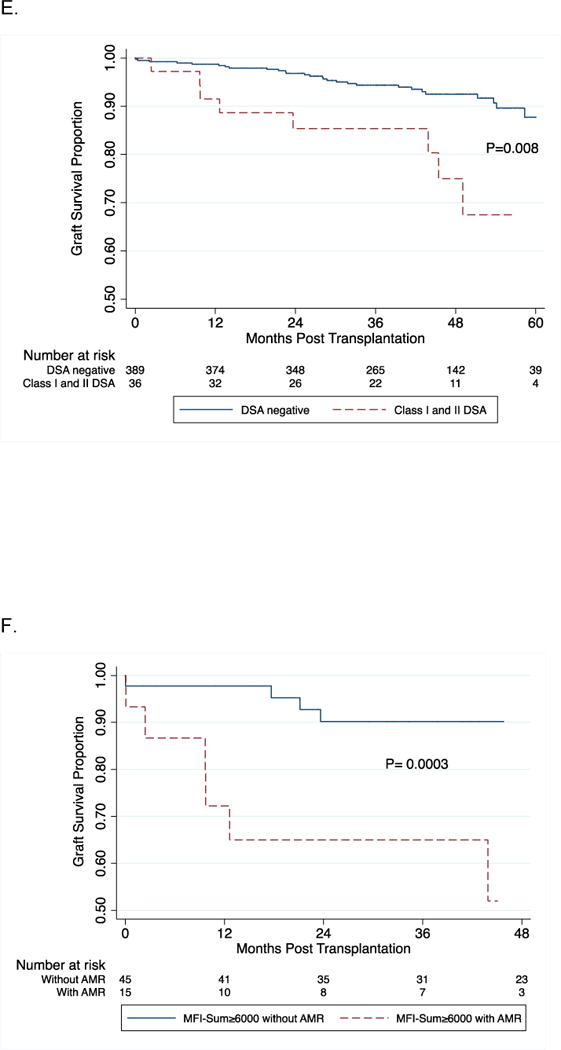
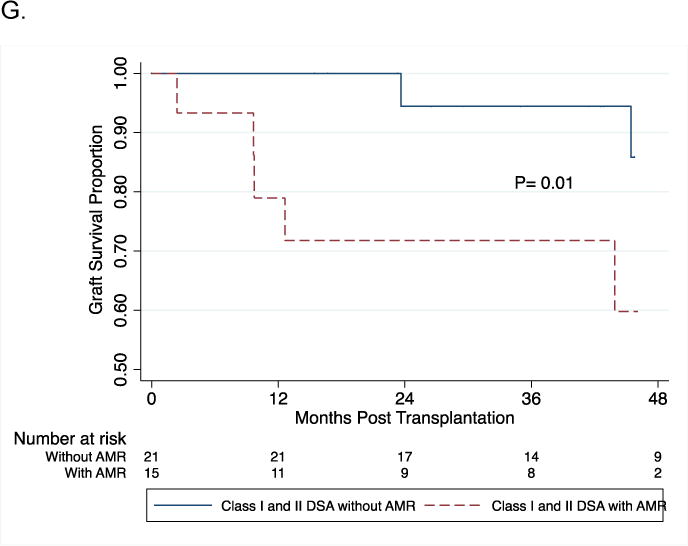
Results: One-year acute rejection incidence was higher in DSA-positive group (P < 0.001), primarily due to antibody-mediated rejection (AMR, 13% vs. 1.8%, P < 0.001) and not T cell-mediated rejection (ACR, 5% vs.6%, P = 0.65). The sum of mean fluorescence intensity of DSA (DSA MFI-Sum) of 6,000 or higher (OR, 18; 95% CI, 7.0-47; P < 0.001) and the presence of DSA against both HLA class I and II (OR, 39; 95% CI, 14-106; P < 0.0001) predicted 1-year AMR, independent of other covariates. Calculated panel reactive antibody and a positive flow cytometry cross-match result were associated with AMR by bivariate analysis but neither was an independent predictor in a multivariable regression analysis that included DSA-MFI-Sum or HLA DSA class. In multivariable Cox proportional hazards models, the covariate-adjusted hazard ratio for graft failure was 2.03 (95%CI, 1.05-3.92; P = 0.04) for DSA MFI-Sum of 6,000 or higher and 2.23 (95% CI, 1.04-4.80; P = 0.04) for class I and II DSA. Prediction of graft failure was not independent of AMR.

Conclusion: Our study suggests that DSA MFI-Sum and HLA class of DSA are characteristics predictive of AMR and graft failure. The elevated risk of graft failure in those with the identified features of DSA is attributable to increased risk of AMR.


Figures

Figure 1
Figure 1. Incidence and Risk of Acute Rejection in the First Year of Kidney Transplantation in the DSA Positive Cohort Stratified by DSA MFI-Sum and HLA Class in Pretransplant Serum
Figure 1 portrays the incidence and risk of biopsy confirmed acute antibody mediated rejection (AMR, n=27 biopsies from 27 patients, 21 of 27 biopsies showing acute AMR only and 6 showing both acute AMR and ACR) and biopsy confirmed T-cell mediated acute cellular rejection (ACR, n=26 biopsies from 26 patients) during the first year of transplantation, stratified according to DSA MFI-Sum (Fig. 1A to 1D) and DSA HLA class (Fig. 1E and H). In Panels A and B, the study cohort of 543 patients was divided into four groups based on DSA MFI-Sum in the pretransplant serum – DSA negative group, patients without a single DSA with MFI>1000 (n=389); patients with DSA MFI-Sum between 1000 and 2999 (n=67); patients with DSA MFI-Sum between 3000 and 5999 (n=27); and patients with DSA MFI-Sum≥6000 (n=60). The incidence of AMR (Panel A) was significantly higher in those with DSA MFI-Sum≥3000 (P<0.001) while the incidence of ACR was not significantly different among the four groups (P=0.9, Panel B). In Panel C, the incidence of AMR in DSA negative group was used as the reference and the relative increase in the Odds of AMR in the first year of transplantation was calculated for those with DSA MFI-Sum of 1000–2999 (OR=1.7; 95%CI: 0.34, 8.26), DSA MFI-Sum of 3000–5999 (OR=6.8; 95%CI: 1.7, 28.1) and DSA MFI-Sum≥6000 (OR=18.2; 95%CI: 7.0, 47.0). Panel D displays the Odds of ACR associated with different levels of DSA MFI-Sum (P>0.05). P-values based on Fisher’s exact test. In Panels E to H, the study cohort was divided into four groups according to HLA class of the DSA present in the pretransplant serum – DSA negative group (n=389); patients with DSA against HLA class I only (n=54); patients with DSA against HLA class II only (n=64); and patients with DSA against HLA class I and II (n=36). The incidence of AMR (Panel E) was significantly higher in those with DSA directed against both HLA class I and II (P<0.001) whereas the incidence of ACR was not significantly different among the four groups (P=0.5, Panel F). The frequency of AMR was not different when the data were analyzed according to the HLA locus (A, B, Cw, DR or DQ) that was targeted by the DSA (P=0.62, Chi-Square test). In Panel G, the DSA negative group was used as the reference and the relative increase in the Odds of AMR in the first year of transplantation was calculated for DSA against HLA class I only (OR=3.2; 95%CI: 0.8, 12.8), DSA against HLA class II only (OR=1.8; 95%CI: 0.36, 8.7) and DSA against HLA class I and II (OR=39; 95%CI: 14, 106); Panel H displays the Odds of ACR associated with HLA class of DSA (P>0.05). P-values based on Fisher’s exact test.
Figure 2
Figure 2. DSA MFI-Sums Pretransplant and at the Time of For-Cause Biopsy
Patients undergoing for-cause biopsy (n=157) were divided into groups according to the diagnosis of the index for-cause biopsy obtained within the first year post-transplantation. Each patient contributed only once and was assigned to one group only. In the AMR cohort (n=27), three patients experience AMR within the first week and did not have repeat DSA testing at the time of for-cause biopsy. The DSA MFI-Sum pre-transplant and at the time of for-cause biopsy are shown for the remaining 24 AMR patients. In the remaining groups, 26 patients with ACR, 33 with acute tubular necrosis/tubular toxicity, 28 with other diagnosis and 24 with no specific abnormality were screened for DSA at the time of for-cause biopsy. DSA MFI-Sum levels obtained pretransplant were compared to levels obtained at the time of for-cause biopsy using Wilcoxon test.
Figure 3
Figure 3. Kaplan-Meier Curves for Kidney Graft Survival Stratified by DSA MFI-Sum and HLA Class in Pretransplant Serum
Log-rank test was used to compare kidney graft survival curves in patients with and without DSA (Panel A). Panel B demonstrates graft survival in the four groups stratified by the DSA MFI-Sum in the pretransplant serum. Graft survival at 3-years post-transplantation was 84% in the patients with DSA MFI-Sum≥6000, 93% in patients with DSA MFI-Sum= 3000–5999, and 92% in patients with DSA MFI-Sum= 1000–2999 and 94% in patients without DSA (P=0.06). Graft survival in the group with DSA MFI-Sum≥6000 was significantly lower compared to all three other groups combined (DSA negative + DSA MFI-Sum =1000–2999 + DSA MFI-Sum = 3000–5999) (P=0.003). In Panel C, log-rank test was used to compare kidney graft survival curves in the four groups stratified by the DSA HLA class in the pretransplant serum. Graft survival at 3-years post-transplantation was 85% in the patients with DSA HLA class I and II, 93% in patients with DSA HLA class I only, 88% in patients with DSA HLA class II only and 94% in those without DSA (P=0.02). Graft survival in the group with DSA against both HLA class I and II was significantly lower compared to all three other groups combined (DSA negative + class I DSA only + and class II DSA only) (P=0.02). Panels 3D and 3E demonstrate a significant difference in graft survival in those at high risk for AMR – those with DSA MFI-Sum ≥ 6000 vs. no DSA (Fig 3D, P=0.008) and those with DSA Class I and II vs. no DSA (Fig. 3E, P=0.008). Within the group with DSA MFI-Sum ≥6000, the occurrence of an episode of AMR during the first year of transplantation resulted in a significantly lower graft survival (53% vs. 89%; P=0.0003, Fig. 3F). Within the group with DSA directed at HLA- class I and II, the occurrence of an episode of AMR during the first year of transplantation resulted in lower graft survival (60% vs. 90%; P=0.01, Fig. 3G).

References

    1. Patel R, Terasaki PI. Significance of the positive crossmatch test in kidney transplantation. The New England journal of medicine. 1969;280(14):735–9. - PubMed
    1. Ozawa M, Terasaki PI, Castro R, Alberu J, Morales-Buenrostro L, Alvarez I, et al. 14th International HLA and Immunogenetics Workshop Prospective Chronic Rejection Project: a three-year follow-up analysis. Clinical transplants. 2007:255–60. - PubMed
    1. Lefaucheur C, Suberbielle-Boissel C, Hill GS, Nochy D, Andrade J, Antoine C, et al. Clinical relevance of preformed HLA donor-specific antibodies in kidney transplantation. American journal of transplantation: official journal of the American Society of Transplantation and the American Society of Transplant Surgeons. 2008;8(2):324–31. - PubMed
    1. Gibney EM, Cagle LR, Freed B, Warnell SE, Chan L, Wiseman AC. Detection of donor-specific antibodies using HLA-coated microspheres: another tool for kidney transplant risk stratification. Nephrology, dialysis, transplantation: official publication of the European Dialysis and Transplant Association - European Renal Association. 2006;21(9):2625–9. - PubMed
    1. Pei R, Lee J, Chen T, Rojo S, Terasaki PI. Flow cytometric detection of HLA antibodies using a spectrum of microbeads. Human immunology. 1999;60(12):1293–302. - PubMed

Publication types

MeSH terms