Meta-Analysis
. 2015 May;87(5):984-95.
doi: 10.1038/ki.2014.395. Epub 2015 Jan 28.

A common gene signature across multiple studies relate biomarkers and functional regulation in tolerance to renal allograft

Affiliations
Meta-Analysis

A common gene signature across multiple studies relate biomarkers and functional regulation in tolerance to renal allograft

Daniel Baron et al. Kidney Int. 2015 May.

Abstract

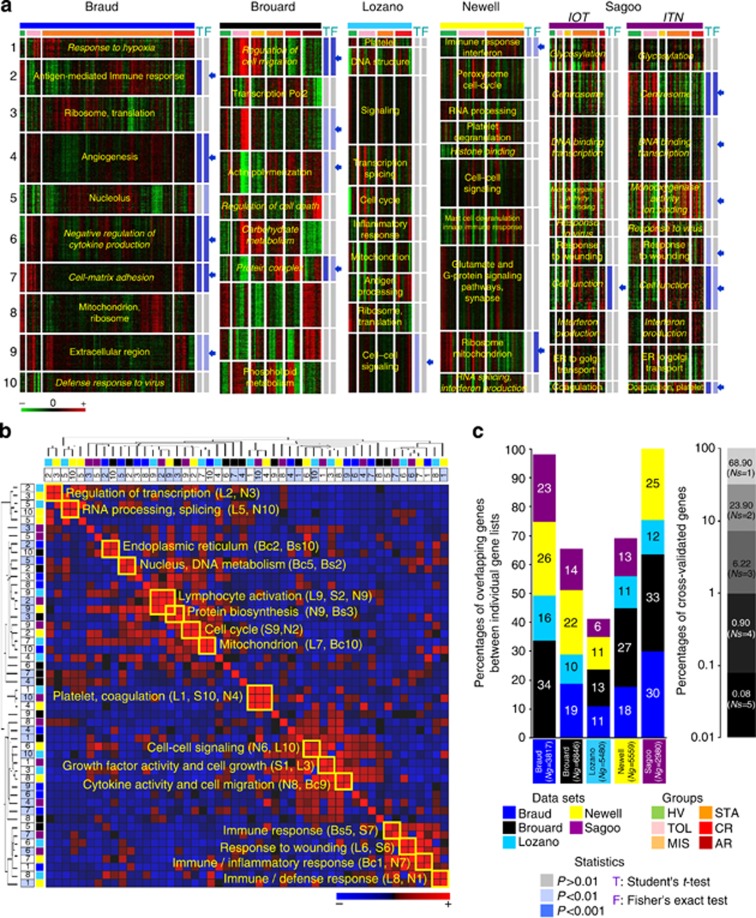
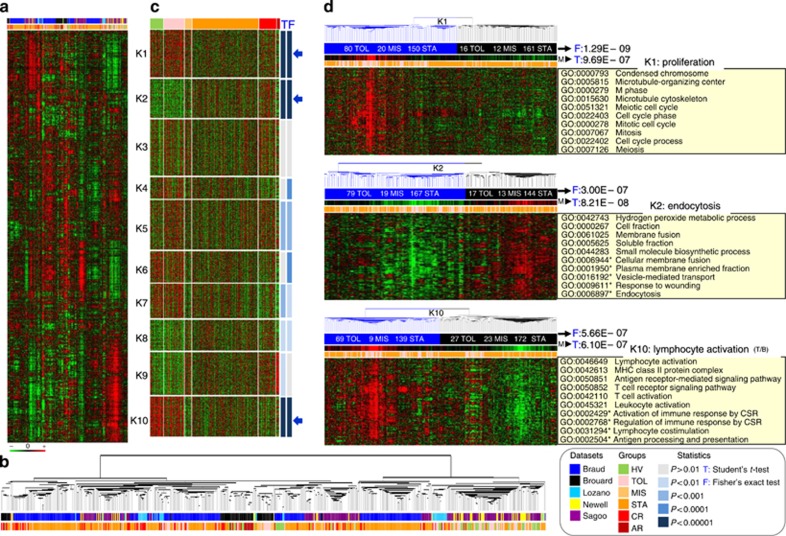
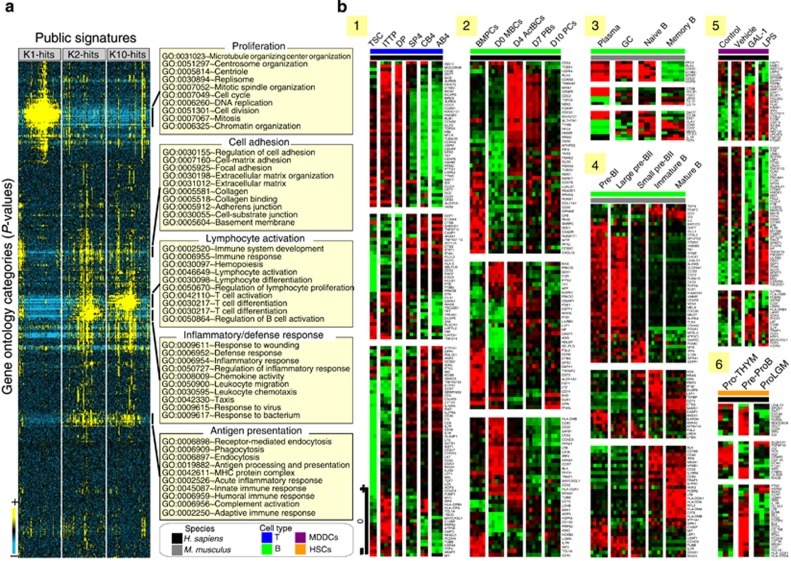
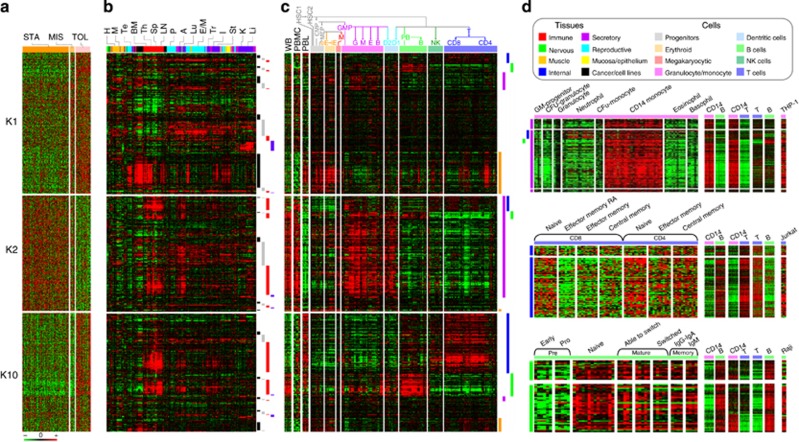
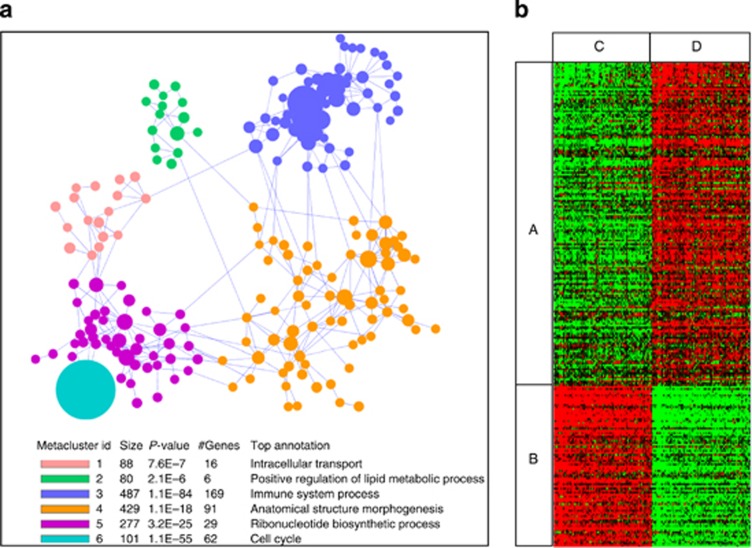
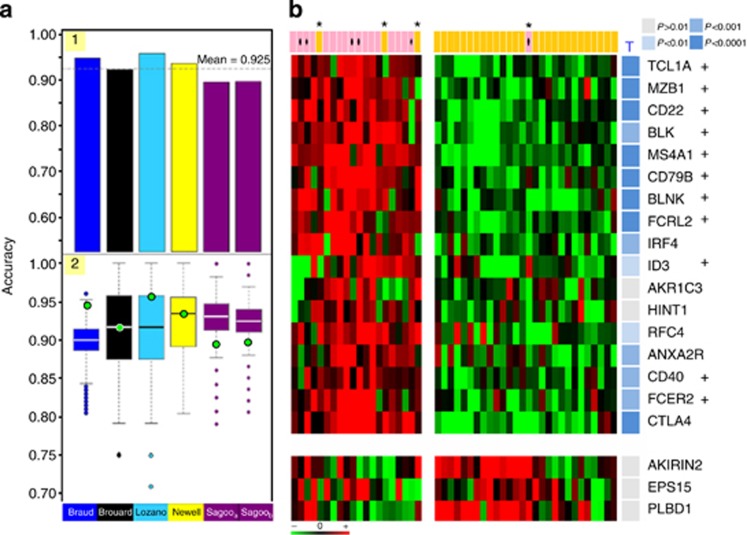
Patients tolerant to a kidney graft display a specific blood cell transcriptional pattern but results from five different studies were inconsistent, raising the question of relevance for future clinical application. To resolve this, we sought to identify a common gene signature, specific functional and cellular components, and discriminating biomarkers for tolerance following kidney transplantation. A meta-analysis of studies identified a robust gene signature involving proliferation of B and CD4 T cells, and inhibition of CD14 monocyte related functions among 96 tolerant samples. This signature was further supported through a cross-validation approach, yielding 92.5% accuracy independent of the study of origin. Experimental validation, performed on new tolerant samples and using a selection of the top-20 biomarkers, returned 91.7% of good classification. Beyond the confirmation of B-cell involvement, our data also indicated participation of other cell subsets in tolerance. Thus, the use of the top 20 biomarkers, mostly centered on B cells, may provide a common and standardized tool towards personalized medicine for the monitoring of tolerant or low-risk patients among kidney allotransplant recipients. These data point to a global preservation of genes favoring the maintenance of a homeostatic and 'healthy' environment in tolerant patients and may contribute to a better understanding of tolerance maintenance mechanisms.


Figures

Figure 1
Figure 1
Comparisons of gene lists from the re-analyzed studies. (a) Individualization of clusters of genes. For each data set (Braud: dark blue bar; Brouard: black bar; Lozano: turquoise blue bar; Newell: yellow bar; Sagoo: purple bar; see legend, ‘data sets'), results from K-means clustering are displayed by a heat-map view using green for gene underexpression, black for gene expression close to the median, and red for gene overexpression (see color scale). Samples are ordered according to the status of origin (see legend, ‘groups'). They correspond to healthy volunteers (HV, green bar), tolerant recipients (TOL, pink bar), stable recipients under minimal immunosuppression (MIS, light orange bar) or classical treatment (STA, dark orange bar), and recipients with chronic (CR, red bar) or acute rejection (AR, brown bar). For each data set, individualized clusters of genes from K-means clustering (K1 to K10) are annotated by a representative term (in yellow) from the Gene Ontology (GO) project. GO terms in italic denote significance of the enrichment but sensitivity to multitesting (false discovery rate adjusted P-values). The propensity of each K cluster to discriminate tolerant (TOL) and stable (STA) recipients was assessed by a Student's t-test (T in blue) applied on its median profile and a Fisher's exact test (F in blue) applied on the contingencies of the related dendrogram (see legend, ‘statistics'). P-values resulting from the tests are indicated on the right of each cluster using shades of blue (see legend, ‘statistics'). The 19 clusters significant at P<0.01 with at least one of the two tests are indicated by arrows. (b) Similarity in gene composition between the 50-K clusters of co-expressed genes. The 50-K clusters from the five re-analyzed studies (10 clusters per study) were compared in terms of overlapping genes. The normalized intersections resulting from pairwise comparisons are presented by a diagonally symmetric matrix ordered by hierarchical clustering (rows and columns) to highlight groups of similar clusters (see trees on top and left). For each cluster, its study of origin (see legend), its number (1–10), and its differential status (light blue square) are given. From the heat-map visualization, a strong overlap between two distinct clusters is portrayed in red and a poor overlap is portrayed in blue (see color scale). Particular similarities are framed on the diagonal along with a representative GO term identified from the functional annotation of the overlap. (c) Intersection of the 19 differential clusters. The 19 clusters (denoted by blue arrows in the top panel) discriminative of TOL and STA groups were compared altogether. The results (left side) are depicted by colored histograms giving for each study (see legend) the percentage of cross-validation of its merged differential clusters (size of the list ‘Ng') with the differential clusters originating from the other data sets. The global cross-validation rate (right side) is indicated by the proportions of differential genes observed in one (Ns=1) to five (Ns=5) data sets. Study from Sagoo comprises two independent cohorts (EU IOT: ‘Indices of Tolerance' US ITN: ‘Immune Tolerance Network') sponsored, respectively.
Figure 2
Figure 2
Meta-analysis of the five studies. (a) Reliability of the meta-matrix. Results from a two-way hierarchical clustering are visualized by a heat map (1846 genes in lines, 596 samples in columns) using the same color code: green for gene underexpression and red for gene overexpression (see color scale). (b) Sample classification. The zoomed tree (bottom) reflects correlation between samples for which the status and the study of origin are indicated (see color legend). (c) Individualization of the meta-clusters. To identify discriminative groups of genes, the meta-data set was partitioned into 10 clusters (from K1 to K10) using a k-means clustering. The results are depicted by a heat map (same color code for gene expression values). Samples are supervised according to their status of origin: healthy volunteer (HV, green), tolerant recipient (TOL, pink), stable recipient under minimum immunosuppression (MIS, light orange) or classical treatment (STA, dark orange), and recipient with chronic (CR, red) or acute (AR, brown) rejection (see legend). The discriminative propensity of each meta-cluster to discriminate tolerant (TOL) from the control group of stable recipients (MIS and STA) was assessed by a Student's t-test (T in blue) applied on its median profile and a Fisher's exact test (F in blue) applied on the contingency of its dendrogram (see legend, ‘statistics'): resulting P-values are indicated on the right of each meta-cluster using shades of blue (see color legend). The three most differential ones (TOL vs. STA/MIS, P<0.00001) with the two tests (namely K1, K2, and K10) are denoted by arrows. (d) Definition of the meta-signature of tolerance. For each of the three most differential (P<0.00001) meta-clusters (K1, K2, and K10) pertaining to the signature, a heat map visualization is depicted. Information provided includes the following: the median profile (M) of the cluster and the P-value from the Student's t-test (T) applied to it; the contingencies (number of TOL, MIS, and STA samples) from the two main branches of the dendrogram (blue and black, respectively); and the P-value from the Fisher's exact test applied to them. For each meta-cluster, the top ten significant Gene Ontology (GO) terms from functional annotation analysis are also given and summarized by a representative term (right side of the panel). Terms with an asterisk indicate significance of the enrichment but sensitivity to multiple testing corrections (FDR-adjusted P-values). CSR, class-switch recombination.
Figure 3
Figure 3
Functional interpretation by Gene Set Analysis (GSA). (a). Functional convergence of the overlapping gene sets. For each differential meta-cluster (K1, K2, and K10), the 100 top overlapping gene sets from the C2_CGP collection (chemical and genetic perturbation sets) of the GSEA Molecular Signature Database (MSigDB v.4) are retained. The functional annotation of these 300 overlapping sets is performed and enrichment P-values for each Gene Ontology (GO) term retained. These values were hierarchically clustered to order and place GO terms (rows) with similar patterns of enrichment across gene sets (columns) in proximity. Results are visualized by a heat map in which each cell represents a specific P-value of enrichment in a specific gene set, using the following color code: blue for poor P-values and yellow for highly significant P-values (see color scale). For each main GO ‘cluster', 10 significant terms are given and summarized by a representative annotation on the right side. (b) Particular similarities with data sets related to immune cell subsets. Overlapping gene sets (see legend) from human (1, 2, 5, and 6) or mice (3 and 4), and related to T- (1) or B-cell development (2, 3 and 4), myeloid-derived dentritic cells (5) or hematopoietic stem cells (6), are detailed by heat map views. Illustration 1 includes human samples corresponding to thymic stromal cultures (TSCs), intrathymic T progenitor (ITTP) cells, ‘double positive' (DP) thymocytes, ‘single positive 4' (SP4) thymocytes, ‘naive' T cells from cord blood (CB4) and ‘naive' T cells from adult blood (AB4). Illustration 2 includes human samples corresponding to bone marrow plasma cells (BMPCs), memory B cells on day 0 of in vitro differentiation (D0 MBCs), activated B cells on day 4 (D4 ActBCs), plasmablasts on day 7 (D7 PBs), and plasma cells on day 10 of culture (D10 PCs). Illustration 3 includes samples from mouse corresponding to plasma cells (plasma), germinal center B cells (GC), naive B cells (naive B), and memory B cells (memory B). Illustration 4 gathers B samples from mouse at the following stages of development: Pre-BI, large Pre-BII, small Pre-BII, immature, and mature. Illustration 5 is on human immature monocyte–derived dendritic cells (MDDCs) untreated (control) or treated with vehicle alone (vehicle) and matured with galectin-1 (GAL-1) or lipopolysaccharide (LPS). Illustration 6 is on human hematopoietic progenitor cells (HPC) corresponding to prothymocytes (Pro-THYM), early pre-proB precursors (ProB), and lymphogranulomacrophagic precursors (Pro-LGM).
Figure 4
Figure 4
Identification of the cellular component by virtual microdissection analysis (VMDA). (a) Gene meta-signature of tolerance. Gene expression profiles (in rows, same order as (b and c) from the three most differential meta-clusters (K1, K2, and K10) are shown for the following clinical groups (in columns): control group comprising stable recipients under classical treatment (STA, dark orange) or minimal immunosuppression (MIS, light orange) and tolerant recipients (TOL, pink). Results are displayed by a heat map using red for gene overexpression and green for gene underexpression (see color scale). (b and c) Related gene profiles across a large compendium of human tissues (b) and blood cell types (c). A hierarchical clustering was performed on the whole matrix to group genes on the basis of similar profiles across the collection of samples. Results are displayed by expression heat-map views using the same color code. (b) Expression profiles across a large collection of tissues. The 1661 tissue samples (in columns) were ranged according to a hierarchical classification and annotated according to eight main categories (see legend): the immune (red), the nervous (green), the muscle (orange), the internal (dark blue), the secretory (purple), the reproductive (turquoise blue), the mucosa (yellow), and the cancer (black) types of samples. Some particular tissues from these categories are noted on the top: heart (H) and skeletal muscle (M) for the muscle type; testis (Te), prostate (P), and endometrium/myometrium (E/M) for the reproductive type; bone marrow (BM), thymus (Th), spleen (Sp), lymph node (LN) for the immune type; adipose (A), lung (Lu), trachea (Tr), intestine (I), stomach (St), kidney (K), and liver (Li) for the internal type. Four major gene clusters are indicated on the right by colored bars: black bar for overexpression in proliferating tissues; gray bar for ubiquitous overexpression across a large panel of tissue samples; red bar for specific overexpression in immune tissues; blue bar for preferential expression in the liver. (c) Expression profiles across a large compendium of blood cell types. The 681 cell samples (in columns) are ranged according to their respective positions in hematopoiesis (see tree on top) and pertain to eight main categories (see legend): the hematopoietic progenitors (gray) comprising the hematopoietic stem cells (HSC1–2) and the common myeloid (CMP) and myeloid/erythroid (MEP) progenitors; the erythroid lineage (orange) gathering early (eE) to late (lE) erythroid cells; the megakaryocytic category (pink) comprising megakaryocytes (M); the granulocyte/monocyte lineage (purple) comprising granulocyte/monocyte progenitors (GMP), granulocytes (G), monocytes (M), eosinophils (E), and basophils (B); the dentritic category (light blue) comprising dentritic cells (D1–2); the B-cell lineage (light green) gathering pre-B (PB) to mature B cells (B); the natural-killer (NK) lineage (dark green) comprising natural killers (NK); and the T-cell lineage (dark blue) gathering T CD8 (CD8) and T CD4 (CD4) lymphocyte populations. Expression from whole blood (WB), peripheral blood monocytes (PBMC), and peripheral lymphocytes (PL) is also shown on the left side. Four major gene clusters are indicated by colored bars on the right: orange bar for overexpression in proliferating progenitors; purple bar for overexpression in granulocyte/monocyte lineage; blue bar for higher expression in T-cell lineage; green bar for higher expression in B-cell lineage. (d) Tolerance expression profiles specificity of immune cell subtypes. The heat-map view on top details the genes predominantly overexpressed across cell types from the granulocyte/monocyte lineage (purple bar) including: granulocyte/monocyte (GM) progenitors, colony-forming unit (CFU) granulocytes, granulocytes, neutrophils, CFU and CD14 monocytes, eosinophils, and basophils. The heat-map view in middle shows the genes overexpressed in the CD8 and CD4 populations from the T lymphocyte lineage (blue bar) including the following cell subsets: naive, effector memory (TEM and TEMRA), and central memory (CM). The heat-map view on bottom depicts the genes having higher expression in cell subsets from the B-cell lineage (green bar) corresponding to: pre-B (including early and proB), naive B, mature B (gathering samples from B able to switch to fully switched B), and memory B (gathering immunoglobulin IgG and IgA and IgM-secreting B). For more details on the specificity of these gene expression profiles, results from pairwise comparisons (CD14 monocytes vs. B lymphocytes, CD14 monocytes vs. T lymphocytes, and T lymphocytes vs. B lymphocytes) along with expression in specific related cell lines (THP-1, Jurkat, and Raji) are also depicted on the top right of each heat-map view.
Figure 5
Figure 5
Validation of the functionality and cellularity of the meta-signature of tolerance. (a) Similar neighbors of co-expression across public data sets. The results (co-expression-based meta-analysis) are visualized by a network representation of the six identified meta-clusters (see color legend and functional annotation) gathering 1462 genes. Nodes from the network are clusters (colored circles on the graph, size proportional to the number of genes they gather) of strongly connected genes (3–101 genes, density ⩾0.5) and edges intercluster density ⩾0.2. (b) Similar gene patterns across public data sets. The results (rank-based meta-analysis) are visualized by a heat map of the 244 top genes (in rows) discriminating tolerant (TOL) from stable (STA) recipients (P<0.005) across 215 sample pairs (in columns) from unique Gene Expression Omnibus (GEO) data sets. (A) Genes upregulated in TOL recipients; (B) genes downregulated in TOL recipients; (C) 215 samples having a ‘stable' (STA)-like pattern. (D) In all, 215 samples with a ‘tolerant' (TOL)-like pattern.
Figure 6
Figure 6
Reproducibility of the meta-signature of tolerance. (a) Cross-validation of the meta-signature. In panel 1, the classification performances through the six cross-validation folds are shown. Results are displayed with a histogram in which each bar (one of the six folds) represents the accuracy obtained on one data set used as test, whereas learning is performed on the five others. From left (first fold) to right (sixth fold), tests were data sets from Braud (dark blue), Brouard (black), Lozano (turquoise blue), Newell (yellow), Sagooa (European ‘Indices of Tolerance' (IOT) cohort, purple), and Sagoob (American ‘Immune Tolerance Network' (ITN) cohort, purple). In panel 2, the influence of the origin of a data set on the performances of classification is assessed. The accuracy from the six test data sets (green circle) is compared with the accuracy obtained on comparable test data sets (equal size and same sample composition) constructed by a random selection of tolerant (TOL) and stable (STA) samples from the total pool of samples (whatever the study of origin). Results are depicted by box plots (boxes: interquartile range (IQR); whiskers: 1.5 × IQR) corresponding each to the values obtained after 1000 repeated random selections. Values beyond the range are considered outliers and shown as circles. (b) Experimental validation of the meta-signature. The expression of the 20 top ranked biomarkers discriminating tolerant (TOL) from stable (STA) recipients is assessed in a new collection of 48 samples. The results from real-time PCR are displayed by an expression heat map (red for gene overexpression and green for gene underexpression) showing the patterns from 18 TOL (pink; dot: new cases) and 30 STA (orange). Misclassified samples are denoted by an asterisk. Significance of the individual markers (17 upregulated and 3 downregulated) is assessed by a Student's t-test: resulting P-values are depicted by shades of blue on the right side (see color legend). From the 20 genes, those corresponding to B-cell–related markers are quoted by a cross.

Comment in

Similar articles

Cited by

References

    1. Pascual M, Theruvath T, Kawai T, et al. Strategies to improve long-term outcomes after renal transplantation. N Engl J Med. 2002;346:580–590. - PubMed
    1. Dantal J, Hourmant M, Cantarovich D, et al. Effect of long-term immunosuppression in kidney-graft recipients on cancer incidence: randomised comparison of two cyclosporin regimens. Lancet. 1998;351:623–628. - PubMed
    1. Fishman JA. Infection in solid-organ transplant recipients. N Engl J Med. 2007;357:2601–2614. - PubMed
    1. Soulillou JP, Giral M. Controlling the incidence of infection and malignancy by modifying immunosuppression. Transplantation. 2001;72:S89–S93. - PubMed
    1. Wimmer CD, Rentsch M, Crispin A, et al. The janus face of immunosuppression - de novo malignancy after renal transplantation: the experience of the Transplantation Center Munich. Kidney Int. 2007;71:1271–1278. - PubMed

Publication types