. 2015 Feb 20;29(4):463-71.
doi: 10.1097/QAD.0000000000000545.

The effect of HAART-induced HIV suppression on circulating markers of inflammation and immune activation

Affiliations

The effect of HAART-induced HIV suppression on circulating markers of inflammation and immune activation

Nikolas Itaru Wada et al. AIDS. .

Abstract

Objectives: To investigate the impact of HAART-induced HIV suppression on levels of 24 serological biomarkers of inflammation and immune activation.

Design: A prospective cohort study.

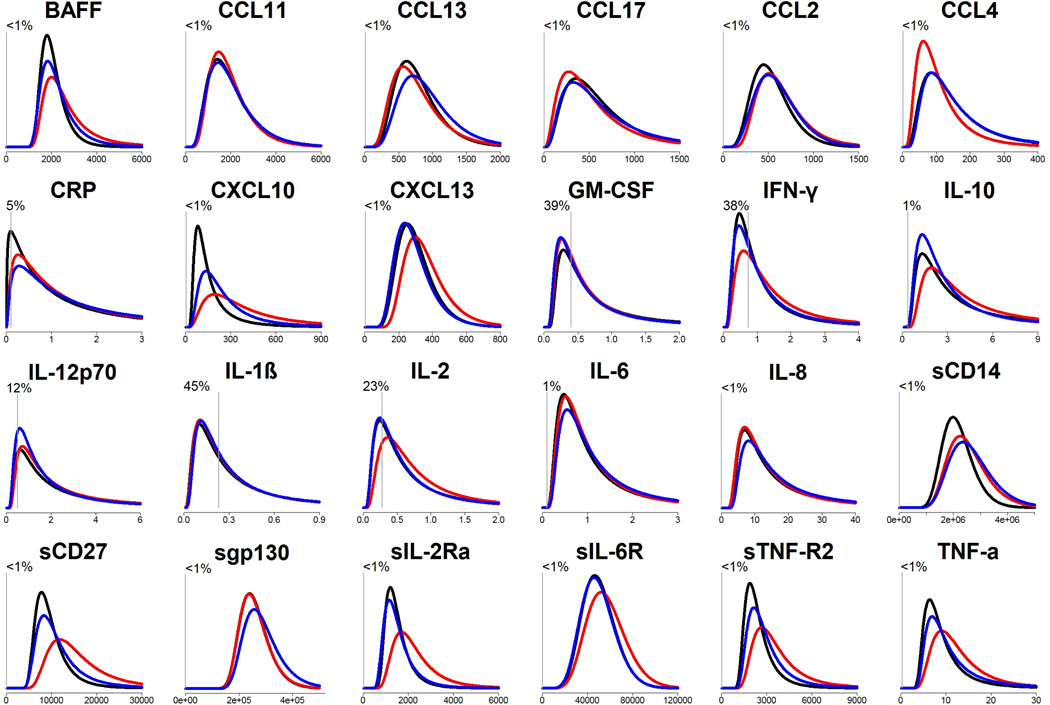
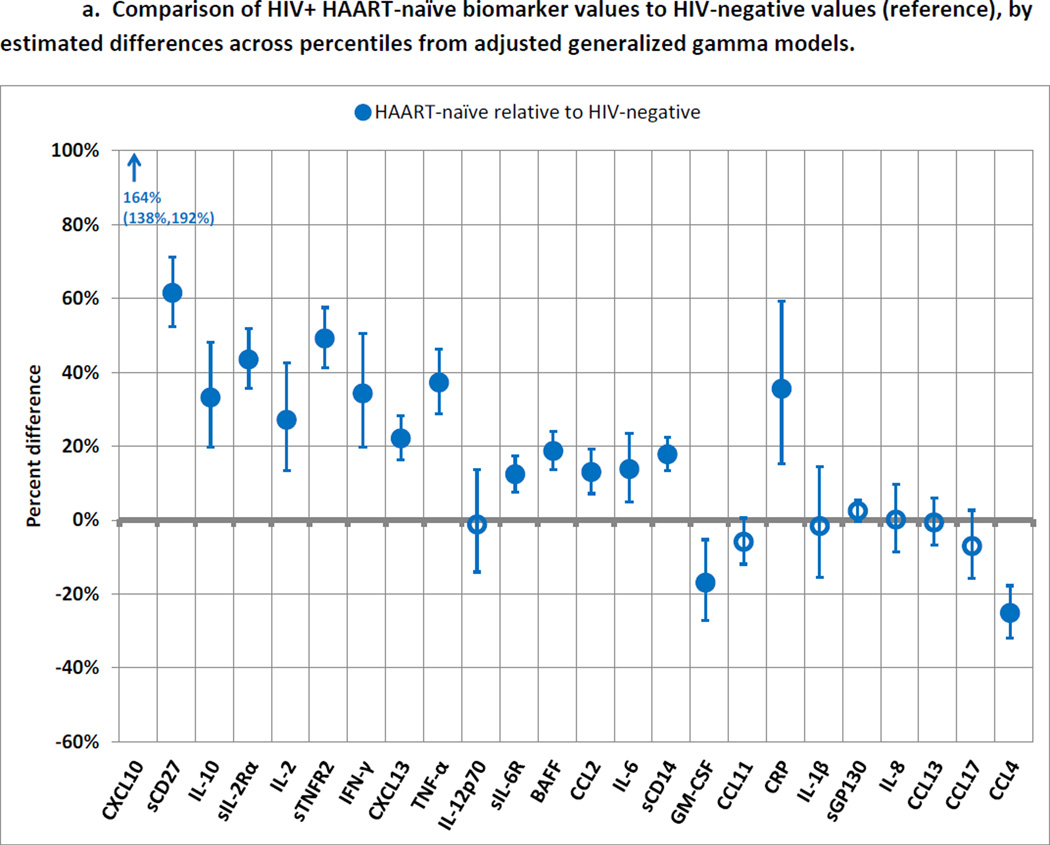
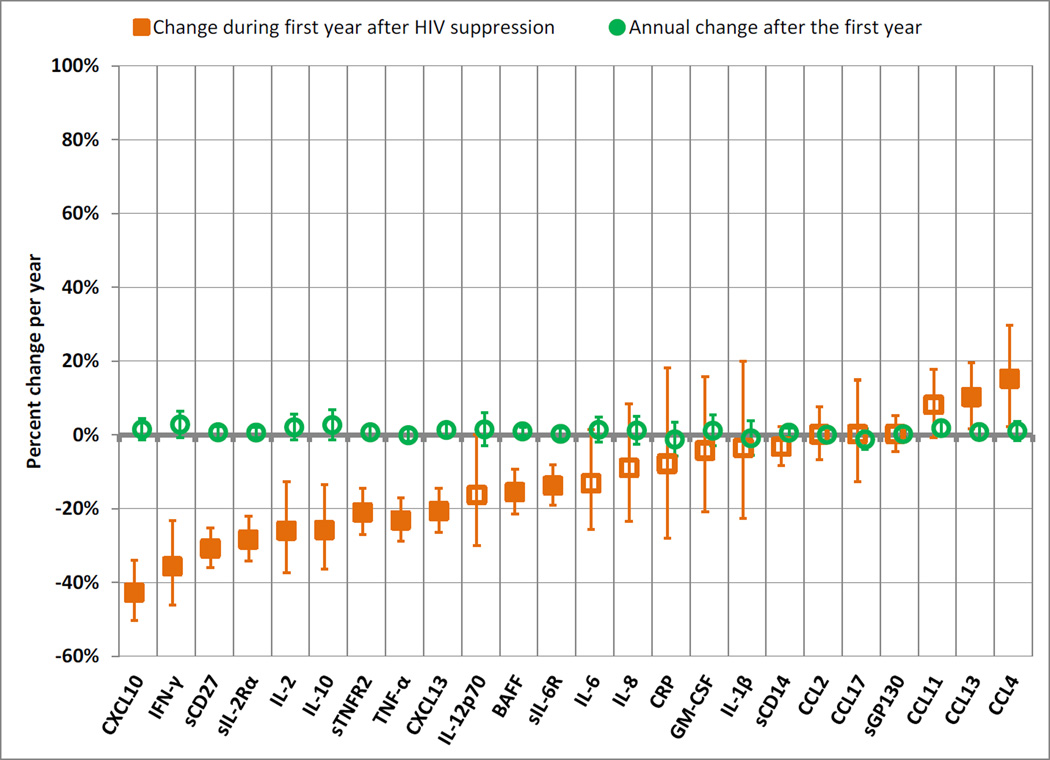
Methods: Biomarkers were measured with multiplex assays in centralized laboratories using stored serum samples contributed by 1697 men during 8903 person-visits in the Multicenter AIDS Cohort Study (MACS) from 1984 to 2009. Using generalized gamma models, we compared biomarker values across three groups, adjusting for possible confounders: HIV-uninfected (NEG); HIV-positive, HAART-naive (NAI); and HAART-exposed with HIV RNA suppressed to less than 50 copies/ml plasma (SUP). We also estimated changes in biomarker levels associated with duration of HIV suppression, using splined generalized gamma regression with a knot at 1 year.

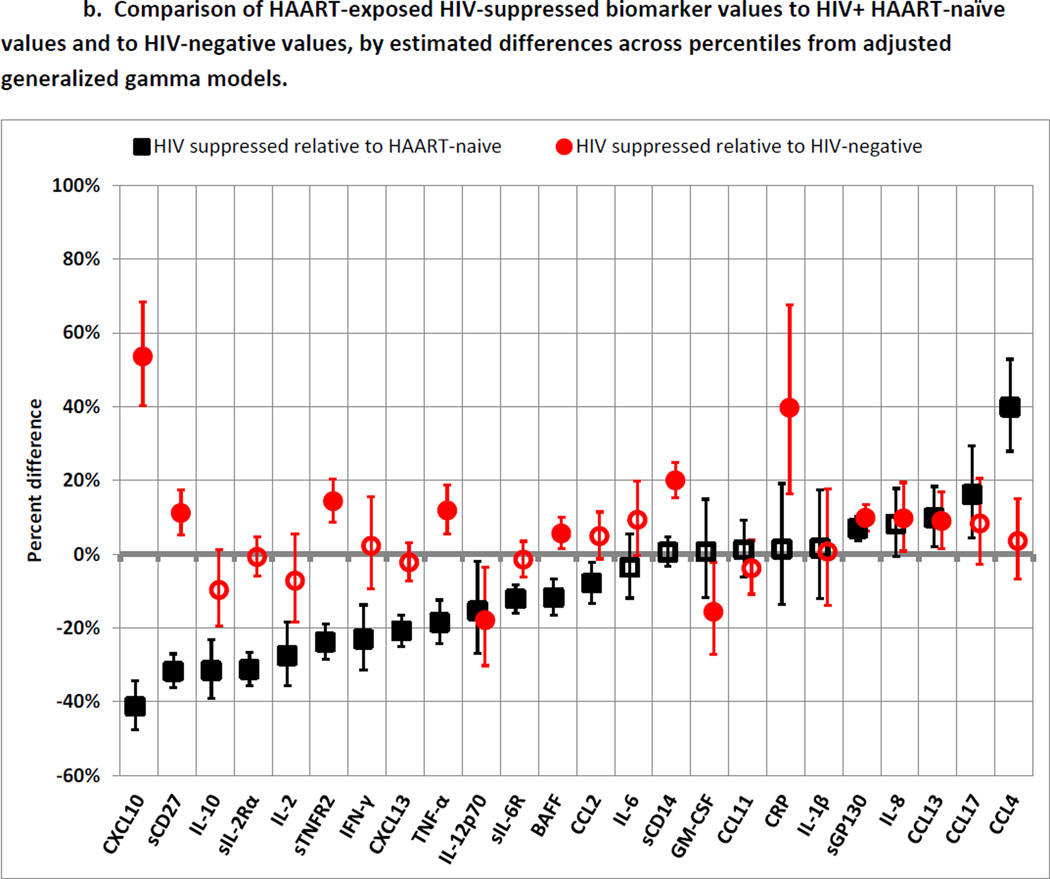
Results: Most biomarkers were relatively normalized in the SUP group relative to the NAI group; however, 12 biomarkers in the SUP group were distinct (P < 0.002) from NEG values: CXCL10, C-reactive protein (CRP), sCD14, sTNFR2, tumour necrosis factor-alpha (TNF-α), sCD27, sGP130, interleukin (IL)-8, CCL13, BAFF, GM-CSF and IL-12p70. Thirteen biomarkers exhibited significant changes in the first year after viral suppression, but none changed significantly after that time.

Conclusion: Biomarkers of inflammation and immune activation moved towards HIV-negative levels within the first year after HAART-induced HIV suppression. Although several markers of T-cell activation returned to levels present in HIV-negative men, residual immune activation, particularly monocyte/macrophage activation, was present. This residual immune activation may represent a therapeutic target to improve the prognosis of HIV-infected individuals receiving HAART.


Conflict of interest statement

Conflicts of interest: none declared.

Figures

Figure 1
Figure 1
Estimated distributions of biomarker levels for HIV-negative, HIV+ HAART-naïve, and HIV+ virally suppressed person-visits. Results are from saturated generalized gamma models. X-axis: pg/mL. Y-axis: probability density. Black=HIV-negative (NEG), red=HIV+ HAART-naïve (NAI), blue=HIV+ virally suppressed (SUP). Vertical gray lines represent the median lower limit of detection for assays. The percentage represents % of biomarker measurements that were below the lower limit of detection (right-censored by models by inverting values). Details of model estimates are shown in Supplemental Table 1.
Figure 2
Figure 2
a. Comparison of HIV+ HAART-naïve biomarker values to HIV-negative values (reference), by estimated differences across percentiles from adjusted generalized gamma models. Blue circles represent values of biomarkers among HIV+ HAART-naïve men compared to values among HIV-negative men as the reference category. Error bars represent 99.7% confidence intervals, calculated with Bonferroni adjustment to maintain a family-wise error rate of 0.05. Filled markers represent statistical significance. Results are displayed in the same order as in Figure 2b (sorted by magnitude of difference between HIV-suppressed and HIV+ HAART-naïve groups) to facilitate visual comparisons. Models were adjusted for age, race, smoking, hepatitis C infection, obesity, diabetes, and MACS site. Location parameters of generalized gamma models were allowed to differ by exposure category, while scale and shape parameters were held constant. Details of model estimates are shown in Supplemental Table 2. b. Comparison of HAART-exposed HIV-suppressed biomarker values to HIV+ HAART-naïve values and to HIV-negative values, by estimated differences across percentiles from adjusted generalized gamma models. Black squares represent values of biomarkers among HIV-suppressed men compared to values among HIV+ HAART-naïve men as the reference category. Red circles represent values of biomarkers among HIV-suppressed men compared to values among HIV-negative men as the reference category. Error bars represent 99.7% confidence intervals, calculated with Bonferroni adjustment to maintain a family-wise error rate of 0.05. Filled markers represent statistical significance. Models were adjusted for age, race, smoking, hepatitis C infection, obesity, diabetes, and MACS site. Location parameters of generalized gamma models were allowed to differ by exposure category, while scale and shape parameters were held constant. Details of model estimates are shown in Supplemental Table 2.
Figure 2
Figure 2
a. Comparison of HIV+ HAART-naïve biomarker values to HIV-negative values (reference), by estimated differences across percentiles from adjusted generalized gamma models. Blue circles represent values of biomarkers among HIV+ HAART-naïve men compared to values among HIV-negative men as the reference category. Error bars represent 99.7% confidence intervals, calculated with Bonferroni adjustment to maintain a family-wise error rate of 0.05. Filled markers represent statistical significance. Results are displayed in the same order as in Figure 2b (sorted by magnitude of difference between HIV-suppressed and HIV+ HAART-naïve groups) to facilitate visual comparisons. Models were adjusted for age, race, smoking, hepatitis C infection, obesity, diabetes, and MACS site. Location parameters of generalized gamma models were allowed to differ by exposure category, while scale and shape parameters were held constant. Details of model estimates are shown in Supplemental Table 2. b. Comparison of HAART-exposed HIV-suppressed biomarker values to HIV+ HAART-naïve values and to HIV-negative values, by estimated differences across percentiles from adjusted generalized gamma models. Black squares represent values of biomarkers among HIV-suppressed men compared to values among HIV+ HAART-naïve men as the reference category. Red circles represent values of biomarkers among HIV-suppressed men compared to values among HIV-negative men as the reference category. Error bars represent 99.7% confidence intervals, calculated with Bonferroni adjustment to maintain a family-wise error rate of 0.05. Filled markers represent statistical significance. Models were adjusted for age, race, smoking, hepatitis C infection, obesity, diabetes, and MACS site. Location parameters of generalized gamma models were allowed to differ by exposure category, while scale and shape parameters were held constant. Details of model estimates are shown in Supplemental Table 2.
Figure 3
Figure 3
Changes inbiomarker values during the first year after HIV viral suppression, and annual changes for each subsequent year, by estimated differences across percentiles from generalized gamma models. Orange squares represent the percent change in biomarker values during the first year after HIV suppression. Green circles represent the annual percent change in biomarker values after the first year of HIV suppression. Error bars represent 99.7% confidence intervals, calculated with Bonferroni adjustment to maintain a family-wise error rate of 0.05. Filled markers represent differences that were statistically significant after Bonferroni adjustment (p<0.002). Location parameters of generalized gamma models were allowed to differ by exposure category, while scale and shape parameters were held constant. Details of model estimates are shown in Supplemental Table 3.

References

    1. Egger M, Hirschel B, Francioli P, Sudre P, Wirz M, Flepp M, et al. Impact of new antiretroviral combination therapies in HIV infected patients in Switzerland: prospective multicentre study. BMJ. 1997;315:1194–1199. - PMC - PubMed
    1. Detels R, Muñoz A, McFarlane G, Kingsley LA, Margolick JB, Giorgi J, et al. Effectiveness of potent antiretroviral therapy on time to AIDS and death in men with known HIV infection duration. Multicenter AIDS Cohort Study Investigators. JAMA. 1998;280:1497–1503. - PubMed
    1. Wada N, Jacobson L, Cohen M, French AL, Phair JP, Muñoz A. Cause-specific life expectancies after age 35 for HIV-infected and HIV-negative individuals followed simultaneously in long-term cohort studies: 1984–2008. Am J Epidemiol. 2013;177:116–125. - PMC - PubMed
    1. Lederman MM, Funderburg NT, Sekaly RP, Klatt NR, Hunt PW. Residual immune dysregulation syndrome in treated HIV infection. Advances in immunology. 2013;119:51–83. - PMC - PubMed
    1. Plaeger SF, Collins BS, Musib R, Deeks SG, Read S, Embry A. Immune activation in the pathogenesis of treated chronic HIV disease: a workshop summary. AIDS research and human retroviruses. 2012;28:469–477. - PMC - PubMed

Publication types

MeSH terms