. 2015 Mar;129(3):429-47.
doi: 10.1007/s00401-015-1388-1. Epub 2015 Jan 29.

TREM2 regulates microglial cell activation in response to demyelination in vivo

Affiliations

TREM2 regulates microglial cell activation in response to demyelination in vivo

Claudia Cantoni et al. Acta Neuropathol. 2015 Mar.

Abstract

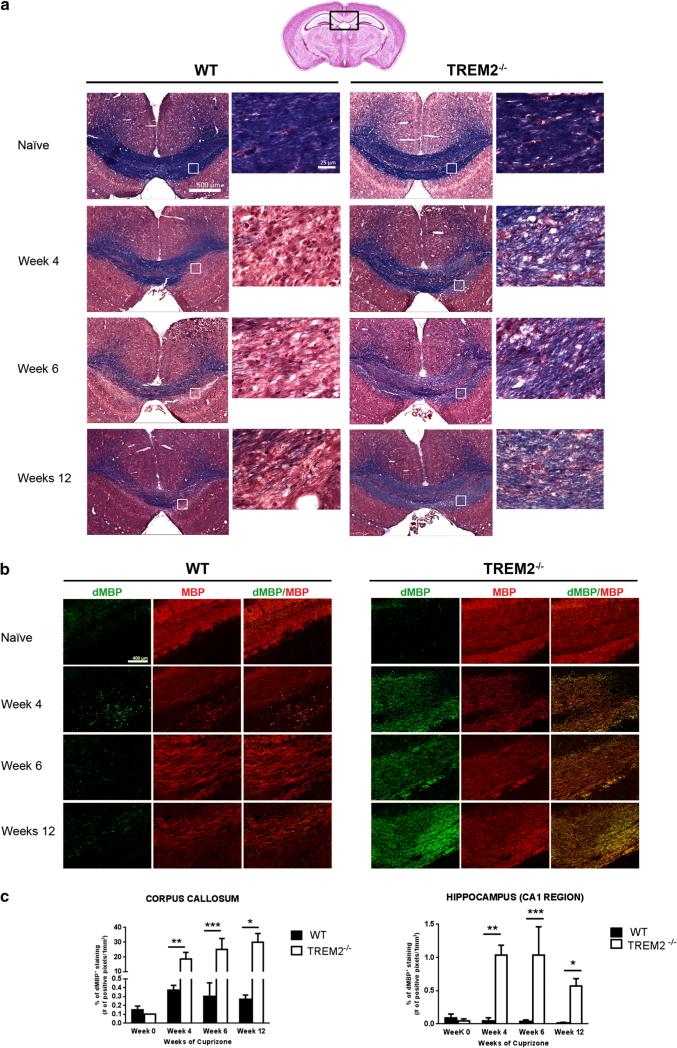
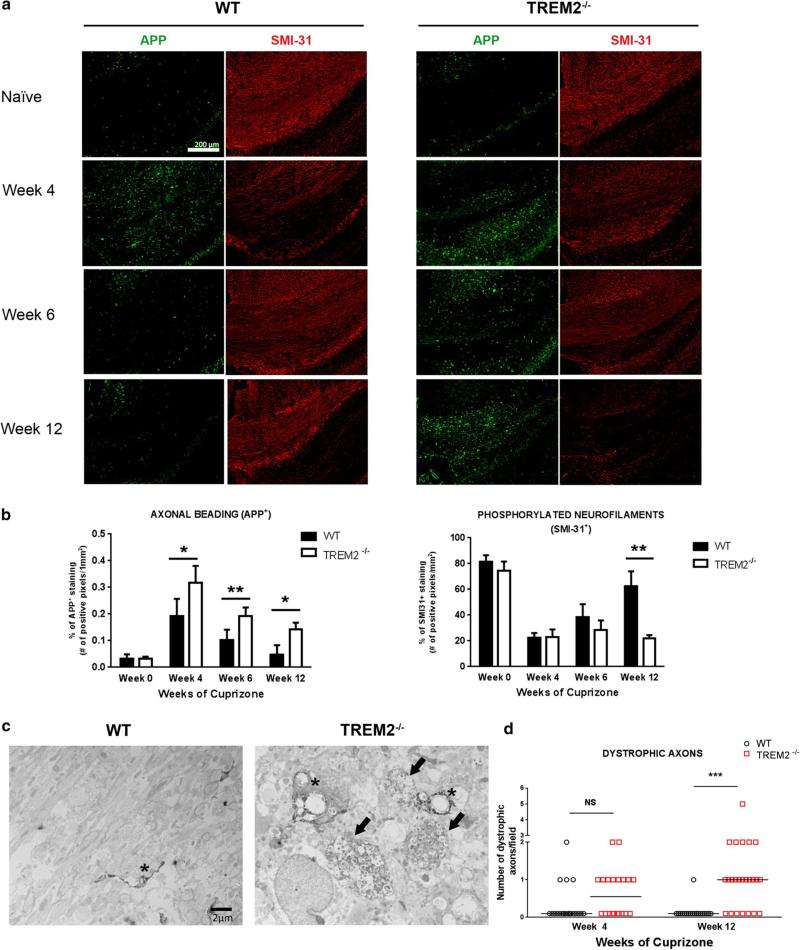
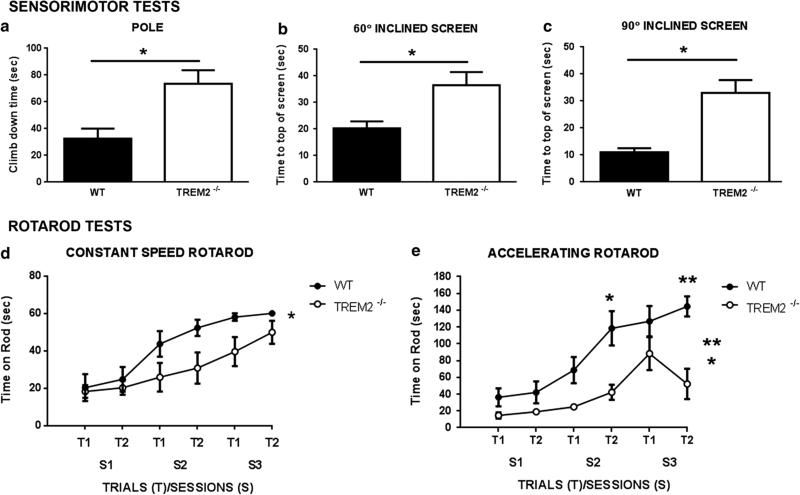
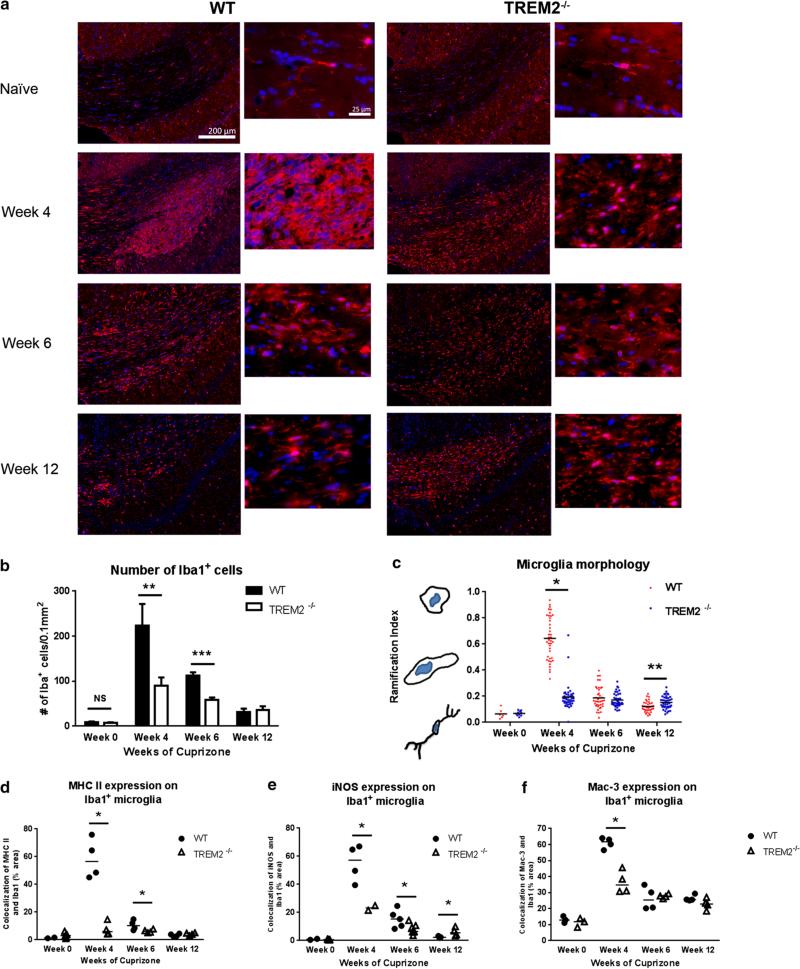
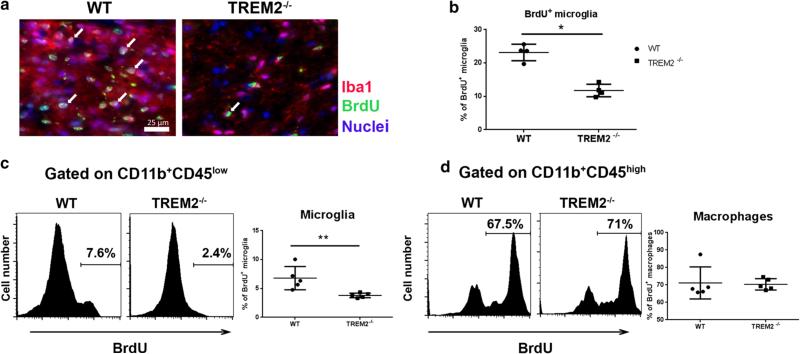
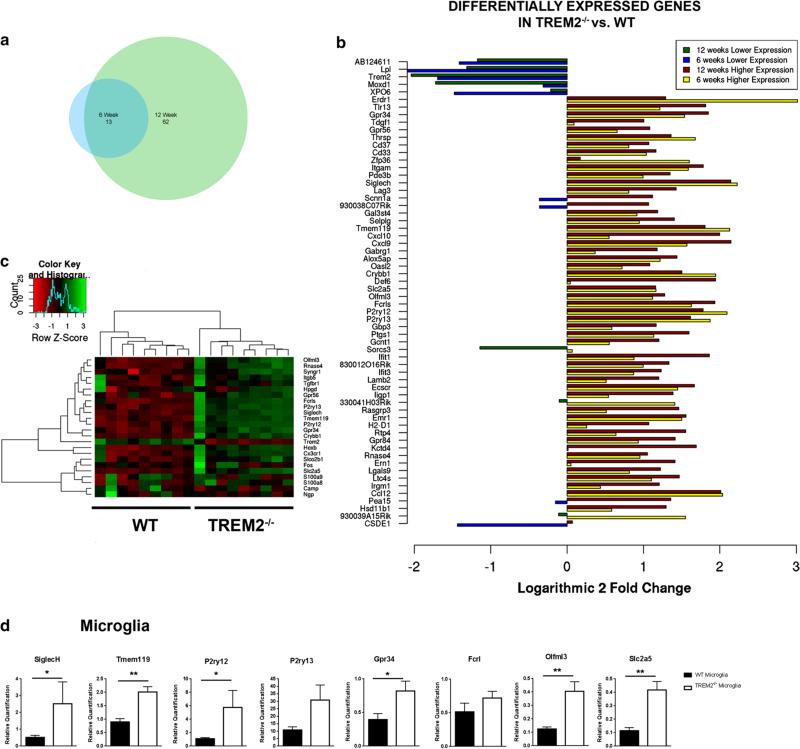
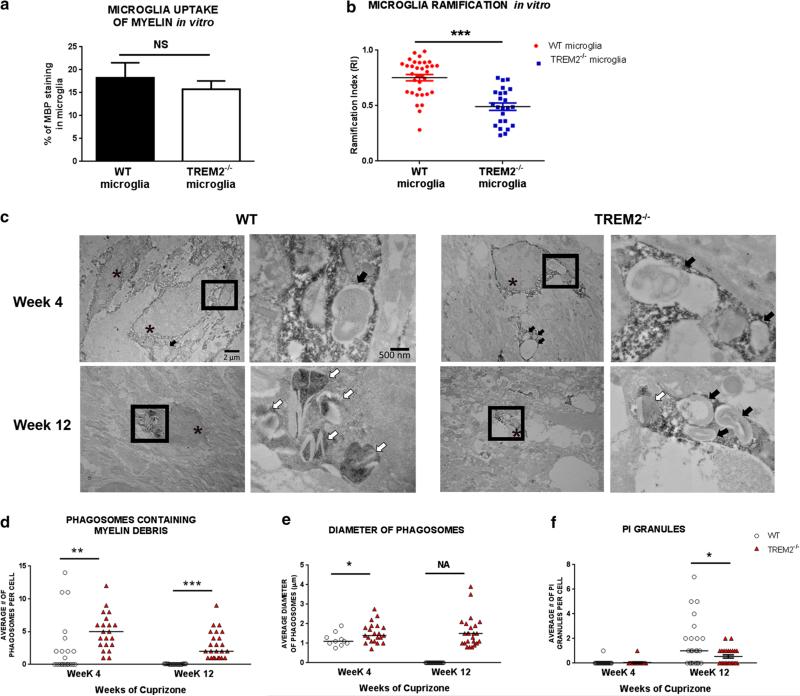
Microglia are phagocytic cells that survey the brain and perform neuroprotective functions in response to tissue damage, but their activating receptors are largely unknown. Triggering receptor expressed on myeloid cells 2 (TREM2) is a microglial immunoreceptor whose loss-of-function mutations in humans cause presenile dementia, while genetic variants are associated with increased risk of neurodegenerative diseases. In myeloid cells, TREM2 has been involved in the regulation of phagocytosis, cell proliferation and inflammatory responses in vitro. However, it is unknown how TREM2 contributes to microglia function in vivo. Here, we identify a critical role for TREM2 in the activation and function of microglia during cuprizone (CPZ)-induced demyelination. TREM2-deficient (TREM2(-/-)) mice had defective clearance of myelin debris and more axonal pathology, resulting in impaired clinical performances compared to wild-type (WT) mice. TREM2(-/-) microglia proliferated less in areas of demyelination and were less activated, displaying a more resting morphology and decreased expression of the activation markers MHC II and inducible nitric oxide synthase as compared to WT. Mechanistically, gene expression and ultrastructural analysis of microglia suggested a defect in myelin degradation and phagosome processing during CPZ intoxication in TREM2(-/-) microglia. These findings place TREM2 as a key regulator of microglia activation in vivo in response to tissue damage.


Figures

Fig. 1
Fig. 1
Defective clearance of myelin debris in TREM2−/− mice during CPZ-induced demyelination. a Myelin was studied histologically by solochrome cyanine staining (intact myelin stained in dark blue) in WT and TREM2−/− naïve mice and mice fed CPZ for 4, 6 and 12 weeks. The coronal section of the mouse brain on the top shows in the boxed area the region of the caudal corpus callosum (CC) that was analyzed (modified from Sidman, High Resolution Mouse Brain Atlas, http://www.hms.harvard.edu/research/brain/index.html). The images on the left for each WT and TREM2−/− panel (first and third columns) depict the CC (×4 magnification). A higher magnification (×60) of the boxed area is shown on the right of each image. b Myelin integrity was assessed in the CC of WT and TREM2−/− naïve and CPZ-fed mice by immunostaining using antibodies specific for intact or degraded myelin basic protein (MBP in red and dMBP in green, respectively; ×20). c dMBP accumulation was quantified in the CC and in the CA1 region of the hippocampus at the different time points. Data are from one experiment of two independent experiments performed with similar results. In the presented experiment for week 0 n = 3 each for naive WT and TREM2−/− mice; for week 4 n = 7 WT and n = 5 TREM2−/− mice; for week 6 n = 9 for both groups; for week 12 n = 4 WT and n = 6 TREM2−/− mice. Values in the graphs are mean ± SD. *P ≤ 0.05; ** P ≤ 0.005; ***P ≤ 0.0001 using Mann–Whitney test
Fig. 2
Fig. 2
TREM2−/− mice show more severe axonal pathology after CPZ. a Immunofluorescent APP (in green) and SMI-31 (in red) staining of WT and TREM2−/− naive mice and mice after 4, 6 and 12 weeks of CPZ treatment. The analysis was performed in the caudal CC area (×10 magnification). b Quantification of axonal beading (depicted by APP fluorescent staining), and of healthy, phosphorylated axons (measured by SMI-31 positivity) in the CC at the different time points. Data are from one experiment of two independent experiments performed with similar results. In the presented experiment for week 0 n = 3 naive WT and n = 5 naïve TREM2−/− mice; for week 4 n = 5 WT and n = 3 TREM2−/− mice; for week 6 n = 6 WT and n = 8 TREM2−/− mice; for week 12 n = 4 WT and n = 6 TREM2−/− mice. Values in the graphs are mean ± SD. c EM images of WT and TREM2−/− at 12 weeks of CPZ treatment. Black arrows indicate dystrophic autophagocytic axons and asterisks indicate Iba1+ immunolabeled microglia. d Quantification of the number of dystrophic axons at 4 and 12 weeks of CPZ treatment counted per field at × 3,000 magnification (area = 381 μm2; n = 2 mice/group). The horizontal lines in the graph represent medians. *P ≤ 0.05; **P ≤ 0.005; ***P ≤ 0.0001 using Mann–Whitney test
Fig. 3
Fig. 3
Clinical deficits in TREM2−/− mice after CPZ treatment. Behavioral testing in WT and TREM2−/− mice was performed after 12 weeks of CPZ treatment (n = 10/group). TREM2−/− mice showed impaired motor coordination compared to WT as measured by (a) time to climb down a pole and (b, c) time to reach the top of a 60° and 90° inclined screen. d, e TREM2−/− mice spent significantly less time on the constant speed (d Genotype effect: P = 0.038) and accelerating (e Genotype effect: P = 0.00016 and Genotype × Trials interaction: P = 0.013) rotarod trials compared to WT, indicating impaired performance on this test. Subsequent pairwise comparisons conducted on the accelerating rotarod data showed significant differences between groups (beyond Bonferroni correction; P = 0.05/6 = 0.0083) for Trial 2 during Sessions 2 and 3 (P = 0.006 and 0.001, respectively), while large differences were also found during Trial 1 for Sessions 1 and 2 (P = 0.040 and 0.011, respectively). Pairwise comparisons also showed that large differences occurred during Trial 2, Session 2 and Trial 1, Session 3 (P = 0.048 and 0.043, respectively) for the constant speed rotarod condition. *P ≤ 0.05; **P ≤ 0.005 using ANOVA
Fig. 4
Fig. 4
Decreased number of microglia in TREM2−/− mice during acute demyelination. a The number of microglial cells was evaluated in the CC of TREM2−/− and WT mice in naïve mice and after 4, 6 and 12 weeks of CPZ treatment by immunostaining for Iba1. Images were acquired in the CC of WT and TREM2−/− mice (×10 and 60 magnification images are presented for WT and TREM2−/− panels). b The number of Iba1+ microglial cells in the CC was quantified. Data are from one experiment of three independent experiments performed with similar results. In the presented experiment for week 0 n = 3 each for naive WT and TREM2−/− mice; for week 4 n = 7 WT and n = 5 TREM2−/− mice; for week 6 n = 9 WT and n = 9 TREM2−/− mice; for week 12 n = 5 WT and n = 9 TREM2−/− mice. Values are mean ± SD. c Microglia morphometric analysis at the different time points was done using a ramification index [RI = 4π × cell area/(cell perimeter)2] that describes microglia cell shape. RI of 1 is a perfectly round cell. RI is smaller than 1 if morphology deviates from perfectly circular and RI is close to zero when the cell is ramified (10 cells/group were analyzed in naïve mice and a total of 40 cells/group were analyzed from 4 to 9 independent mice/group at all other time points). Horizontal lines are means. d MHC II e iNOS and f Mac-3 expression was evaluated by IHC on Iba1+ cells in the CC of TREM2−/− and WT mice at the different time points (n = 4/group at all time points). Horizontal lines in the graphs represent medians. *P ≤ 0.05; **P ≤ 0.005; ***P ≤ 0.0001, using Mann–Whitney test
Fig. 5
Fig. 5
Defect of microglia proliferation in TREM2−/− mice. a Proliferation of microglia in the CC in TREM2−/− and WT mice at 4 weeks on CPZ after BrdU incorporation was evaluated by IHC (×60 images). White arrows indicate the nuclei of BrdU+/Iba+ proliferating microglia. b The percentage of BrdU+/Iba+ microglia relative to the total number of Iba+ microglia was quantified in the CC of TREM2−/− and WT mice after 4 weeks on cuprizione (n = 4 mice/group). This is one representative experiment out of two independent experiments performed with similar results. Values are median ± range. c Brain mononuclear cells were isolated from TREM2−/− and WT mice at 4 weeks on CPZ and after BrdU+ treatment. Microglia and macrophages were distinguished by flow cytometry using the CD45 and CD11b markers. BrdU incorporation was quantified by flow cytometry in CD11b+CD45low microglia and CD11b+CD45high macrophages (n = 5/group). This is one representative experiment out of two performed with similar results. Values are mean ± SD. *P ≤ 0.05; **P ≤ 0.01 using Mann–Whitney test
Fig. 6
Fig. 6
Microarray analysis in the TREM2−/− and WT corpus callosum at 6 and 12 weeks on CPZ. Gene expression array analysis was conducted on the CC isolated from WT and TREM2−/− mice at 6 (4 WT and 3 TREM2−/− mice) and 12 weeks (5 WT and 6 TREM2−/− mice) after CPZ treatment. a Venn diagram showing the number of genes that were differentially expressed (cut-off values: logarithmic fold change 1 and adjusted P value <0.05) between TREM2−/− and WT at 6 and 12 weeks. b List of all differentially expressed genes between the two groups for both time points using the predefined cut-off values (TREM2−/− vs. WT mice). c Hierarchical clustering analysis based on the published data set of microglia-unique gene expression signature [28]. d Gene expression quantification of some microglia-unique genes by qRT-PCR in purified WT and TREM2−/− microglia after 4 weeks on CPZ (from n = 6 WT and 8 TREM2−/− mice). Values are mean ± SD. *P ≤ 0.05; **P ≤ 0.01 using Mann–Whitney test
Fig. 7
Fig. 7
Defect in myelin degradation in TREM2−/− microglia. a Microglia were purified by sorting based on CD11b and CD45 expression from the brain of TREM2−/− and WT naïve mice and cultured in vitro for 24 h in presence of myelin. Myelin uptake was quantified by immunofluorescence staining for MBP detected in Iba1+ microglia cells. Mean ± SEM are shown. b Microglia morphology was quantified using the RI as expression of activation. RI equals 1 for a round cell and below 1 if the morphology deviated from round. Mean ± SEM are shown. c Immuno-EM images of TREM2−/− and WT microglia stained with Iba1 in the CC at 4 and 12 weeks on CPZ treatment. Images on the left in WT and TREM2−/−panels at week 4 and 12 (3,000× magnification) depict Iba+ microglial cells (asterisks). A higher magnification (15,000×) for the boxed area is shown on the right of each image. Black arrows indicate phagosomes containing myelin debris. White arrows indicate pi granules. d Number of phagosomes containing myelin. e The diameter of phagosomes and f the number of pi granules were quantified per field at 3,000× magnification (area = 381 μm2) (n = 2 mice/group). Horizontal lines are medians. *P ≤ 0.05; **P ≤ 0.0005; ***P ≤ 0.0001 using Mann–Whitney test. NA not applicable

References

    1. Archambault AS, Sim J, McCandless EE, Klein RS, Russell JH. Region-specific regulation of inflammation and pathogenesis in experimental autoimmune encephalomyelitis. J Neuroimmunol. 2006;181:122–132. doi:10.1016/j.jneuroim.2006.08.012. - PubMed
    1. Bayer TA. Proteinopathies, a core concept for understanding and ultimately treating degenerative disorders? Eur Neuropsychopharmacol. 2013 doi:10.1016/j.euroneuro.2013.03.007. - PubMed
    1. Benitez BA, Cruchaga C. TREM2 and neurodegenerative disease. N Engl J Med. 2013;369:1567–1568. doi:10.1056/NEJMc1306509#SA4. - PMC - PubMed
    1. Boissonneault V, Filali M, Lessard M, Relton J, Wong G, Rivest S. Powerful beneficial effects of macrophage colony-stimulating factor on beta-amyloid deposition and cognitive impairment in Alzheimer's disease. Brain. 2009;132:1078–1092. doi:10.1093/brain/awn331. - PubMed
    1. Borroni B, Ferrari F, Galimberti D, Nacmias B, Barone C, Bagnoli S, Fenoglio C, Piaceri I, Archetti S, Bonvicini C, et al. Heterozygous TREM2 mutations in frontotemporal dementia. Neurobiol Aging. 2014;35(934):e937. doi:10.1016/j.neurobiolaging.2013.09.017. - PubMed

Publication types

MeSH terms