. 2015 Mar 26;125(13):2120-30.
doi: 10.1182/blood-2014-08-594408. Epub 2015 Jan 28.

AML cells have low spare reserve capacity in their respiratory chain that renders them susceptible to oxidative metabolic stress

Affiliations

AML cells have low spare reserve capacity in their respiratory chain that renders them susceptible to oxidative metabolic stress

Shrivani Sriskanthadevan et al. Blood. .

Abstract

Mitochondrial respiration is a crucial component of cellular metabolism that can become dysregulated in cancer. Compared with normal hematopoietic cells, acute myeloid leukemia (AML) cells and patient samples have higher mitochondrial mass, without a concomitant increase in respiratory chain complex activity. Hence these cells have a lower spare reserve capacity in the respiratory chain and are more susceptible to oxidative stress. We therefore tested the effects of increasing the electron flux through the respiratory chain as a strategy to induce oxidative stress and cell death preferentially in AML cells. Treatment with the fatty acid palmitate induced oxidative stress and cell death in AML cells, and it suppressed tumor burden in leukemic cell lines and primary patient sample xenografts in the absence of overt toxicity to normal cells and organs. These data highlight a unique metabolic vulnerability in AML, and identify a new therapeutic strategy that targets abnormal oxidative metabolism in this malignancy.


Figures

Figure 1
Figure 1
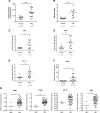
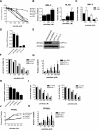
Primary AML samples have increased mitochondrial mass and mRNA level of mitochondrial biogenesis regulators. (A) Citrate synthase activity as a marker of mitochondrial mass was determined in primary normal hematopoietic cells (G-CSF mobilized peripheral blood mononuclear cells) and AML samples. (B) Mitochondrial DNA copy number was determined in primary normal hematopoietic and AML samples. DNA was extracted from cells and mRNA levels of the mitochondrial ND1 gene (mtND1) relative to human globulin (HGB) were measured by qRT-PCR. (C-F) Expression of NRF1, TFAM, EF-Tu, and c-Myc mRNA was measured in primary normal hematopoietic and AML samples. Expression was determined by qRT-PCR using 18s RNA as an internal standard. (G) Expression of NRF1, TFAM, EF-Tu, and c-Myc mRNA in functionally defined AML stem cells (LSC) vs normal hematopoietic stem cells (HSC) (G-CSF mobilized peripheral blood mononuclear cells). Data were derived from the publically accessible data set GSE 30377, achieved on the Gene Expression Omnibus. In all panels, *P < .05; **P < .01; ***P < .001 as determined by the unpaired Student t test.
Figure 2
Figure 2
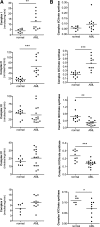
Activities of respiratory chain complexes do not increase in primary AML samples in parallel with mitochondrial mass. The activities of respiratory complexes I-V were measured in isolated mitochondria from primary normal hematopoietic (G-CSF mobilized peripheral blood mononuclear cells) and primary AML samples. (A) Complex activity was normalized to total protein concentration. (B) Complex activity was normalized to mitochondrial mass using citrate synthase activity. *P < .05; **P < .001; ***P < .0001 as determined by unpaired Student t test.
Figure 3
Figure 3
Genetic inhibition of mitochondrial biogenesis factor TFAM rescues effects of oxidative stress. (A-B) OCI-AML-2 cells were infected with TFAM targeting shRNAs or control sequences in lentiviral vectors. Four days posttransduction, TFAM mRNA expression relative to 18S was made by qRT-PCR (A) and TFAM protein expression was determined by immunoblotting (B). (C) DNA was extracted from cells, and quantitative PCR was used to measure levels of ND1 relative to HGB. ND1/HGB ratio is shown relative to control cells. (D) Citrate synthase activity as a marker of mitochondrial mass was determined in TFAM knockdown clones. (E) Basal OCR was shown after 1 hour of incubation in cell chambers. (F) Activity of complex III was measured in control and TFAM knockdown cells. Left panel shows complex activity was normalized to total protein concentration. Right panel shows complex activity was normalized to mitochondrial mass using citrate synthase activity. Data represent the mean complex activity ± standard deviation (SD) from representative experiments performed in triplicate. TFAM knockdown experiments in AML cells were repeated twice. In all panels, *P < .05; **P < .001; ***P < .0001 as determined by the unpaired Student t test.
Figure 4
Figure 4
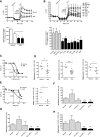
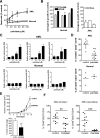
Primary AML cells and leukemic cell lines have lower spare reserve capacity in their respiratory chain enzymes than normal hematopoietic cells. Spare reserve capacity measured by OCR of primary AML samples and normal hematopoietic cells (A) and leukemic cell lines and solid tumor cell lines (B) after the sequential addition of oligomycin and FCCP. (C) Primary AML and normal hematopoietic cells were treated with increasing concentrations of antimycin and changes in oxygen consumption were measured. A representative graph is shown. Primary AML and normal hematopoietic cells (D-E) and leukemia, MCF-7 breast, and OVCAR-3 ovarian cancer cells (F-H) were treated with increasing concentrations of inhibitors of complex I (rotenone) (D,F), complex III (antimycin) (D,G), or complex V (oligomycin) (D,H). The concentration of the complex inhibitor required to reduce OCR by 50% (EC50) was determined. Data for cell lines represent the mean complex activity ± SD from representative experiments performed in triplicate. Experiments with cell lines were performed at least 3 times. (E) Primary AML cells and normal hematopoietic cells were treated with increasing concentrations of complex IV inhibitor, sodium azide (NaN3), and changes in oxygen consumption were measured. A representative graph is shown. The concentration of NaN3 required to reduce OCR by 25% (EC25) was determined. In all panels, *P < .05; **P < .001; ***P < .0001 as determined by the unpaired Student t test.
Figure 5
Figure 5
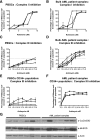
Primary AML cells have increased sensitivity to complex III inhibition. (A-D) PBSCs (A,C) and AML patient samples (B,D) were treated with the indicated concentrations of rotenone or antimycin to block complex I and III, respectively. After 2 hours (rotenone) or 4 hours (antimycin) of treatment, cells were stained with 5 μM MitoSOX Red. After 30 minutes, the stain was replaced with Annexin V to detect apoptotic cells and cells were analyzed using a BD FACS Canto II flow cytometer with a High Throughput Sampler. Data represent the mean value of triplicates ± SD. Each curve represents a patient/normal sample. (E-F) For detection of the progenitor population, CD34-PE-Cy7 (Clone 8G12) and CD38-PE-Cy5 (Clone HIT2) antibodies were also added with mitosox. (G) Immunoblots of cell lysates from PBSCs and AML patients, probed with the indicated antibodies against SOD1 (Cu/ZnSOD), present in the intermembrane space as well as cytoplasm, and SOD2 (MnSOD), present in the matrix. Lower panel shows actin as a loading control. 30 μg of total protein loaded in each lane.
Figure 6
Figure 6
Low spare reserve capacity renders AML cells sensitive to oxidative metabolic stress by palmitate, and this sensitivity can be rescued by genetically inhibiting fatty acid oxidation pathway. (A) Leukemic cells and MCF-7 cells were treated with increasing concentrations of palmitate for 72 hours. Cell viability and growth were measured by Cell Titer Fluor viability assay. (B) OCI-AML-2 and HL-60 cells were treated with increasing concentrations of palmitate for 24 hours. ROS production was measured by staining with MitoSOX and flow cytometry. (C) OCI-AML-2 cells were treated with increasing concentrations of palmitate for 72 hours in the presence and absence of N-acetylcysteine. Cell growth and viability was measured by Cell Titer Fluor viability assay. (D-F) OCI-AML-2 cells were infected with lentiviral vectors containing shRNAs targeting CPT1a or noncellular targets (control). A total of 6 days postinfection, CPT1a mRNA expression relative to 18s RNA was analyzed by qRT-PCR (D) and CPT1a protein expression was determined by immunoblotting (E). Cell growth and viability were measured by Cell Titer Flo after treating cells with palmitate for 72 hours (F). (G) Infected OCI-AML-2 cells were treated with increasing concentrations of palmitate for 24 hours. ROS production was measured by staining with MitoSOX and flow cytometry. (H-K) OCI-AML-2 cells were infected with lentiviral vectors containing shRNAs targeting PPARα or noncellular targets (control). Four days postinfection, PPARα mRNA expression relative to 18s RNA was analyzed by qRT-PCR (H). Cell growth and viability were measured by Cell Titer Flo after treating cells with palmitate for 72 hours (I). Infected OCI-AML-2 cells were treated with increasing concentrations of palmitate. 72 hours after treatment, cell viability was measured by Annexin V/PI staining (J). Infected OCI-AML-2 cells were treated with increasing concentrations of palmitate for 24 hours. ROS production was measured by staining with MitoSOX and flow cytometry (K). In all panels, error bars represent mean ± SD of independent/representative experiments. *P < .05; **P < .001 as determined by Tukey’s test after 1-way analysis of variance, comparing to controls. CPT1a and PPARα knockdown experiments were repeated twice.
Figure 7
Figure 7
Palmitate demonstrates therapeutic efficacy on AML growing in vitro and in vivo. (A) CD34+ AML cells, normal bulk hematopoietic cells, and CD34+ normal hematopoietic cells were treated with increasing concentrations of palmitate (stock concentration of 2 mM palmitate conjugated with 0.17 mM bovine serum albumin). A total of 24 hours after treatment, cell viability was measured by Annexin V/PI staining. (B) Primary AML (n = 3) and normal hematopoietic cells (n = 3) were treated with 50 μM palmitate for 24 hours and were plated in clonogenic growth assays. The number of resultant colonies was counted, including CFU-GM, BFU-E, and CFU-L colony-forming units. The mean percentage of colonies obtained ± SD compared with buffer control–treated cells is shown. (C) Normal hematopoietic cells and primary AML samples were treated with increasing concentrations of palmitate. After 4 hours of treatment, levels of ROS were measured by staining with MitoSOX and flow cytometry. (D) Primary AML and Lin CD34+-enriched human cord blood cells were treated with 50 μM palmitate or buffer control for 24 hours. After treatment, equal cell numbers were injected into the right femurs of irradiated NOD/SCID mice preconditioned with anti-CD122. Eight weeks later, the percentage of human CD45+CD33+CD19 cells in the noninjected femurs was measured by FACS. ***P < .0001 as determined by the unpaired Student t test. (E) NOD/SCID mice were injected subcutaneously with OCI- AML-2 leukemia cells. After tumors were palpable (day 7), mice were treated with palmitate or vehicle control as described in Materials and Methods. Tumor volume was measured with time and tumor mass was measured at the end of the experiment. Data represent mean ± SD. **P < .001, by Student t test. (F) Sublethally irradiated NOD/SCID mice preconditioned with anti-mouse CD122 were injected intrafemorally with primary AML cells. Six days after injection, mice were treated with palmitate or vehicle control as described in Materials and methods. Engraftment of human AML cells into the mouse marrow was assessed by determining the percentage of human CD45+CD33+CD19 cells by flow cytometry. *P < .01 by Student t test.

References

    1. Wise DR, DeBerardinis RJ, Mancuso A, et al. Myc regulates a transcriptional program that stimulates mitochondrial glutaminolysis and leads to glutamine addiction. Proc Natl Acad Sci USA. 2008;105(48):18782–18787. - PMC - PubMed
    1. Samudio I, Harmancey R, Fiegl M, et al. Pharmacologic inhibition of fatty acid oxidation sensitizes human leukemia cells to apoptosis induction. J Clin Invest. 2010;120(1):142–156. - PMC - PubMed
    1. DeBerardinis RJ, Mancuso A, Daikhin E, et al. Beyond aerobic glycolysis: transformed cells can engage in glutamine metabolism that exceeds the requirement for protein and nucleotide synthesis. Proc Natl Acad Sci USA. 2007;104(49):19345–19350. - PMC - PubMed
    1. Warburg O. On the origin of cancer cells. Science. 1956;123(3191):309–314. - PubMed
    1. Funes JM, Quintero M, Henderson S, et al. Transformation of human mesenchymal stem cells increases their dependency on oxidative phosphorylation for energy production. Proc Natl Acad Sci USA. 2007;104(15):6223–6228. - PMC - PubMed

Publication types

Substances