. 2015 Mar 15;26(6):1129-40.
doi: 10.1091/mbc.E14-09-1375. Epub 2015 Jan 28.

Ploidy variation in multinucleate cells changes under stress

Affiliations

Ploidy variation in multinucleate cells changes under stress

Cori A Anderson et al. Mol Biol Cell. .

Abstract

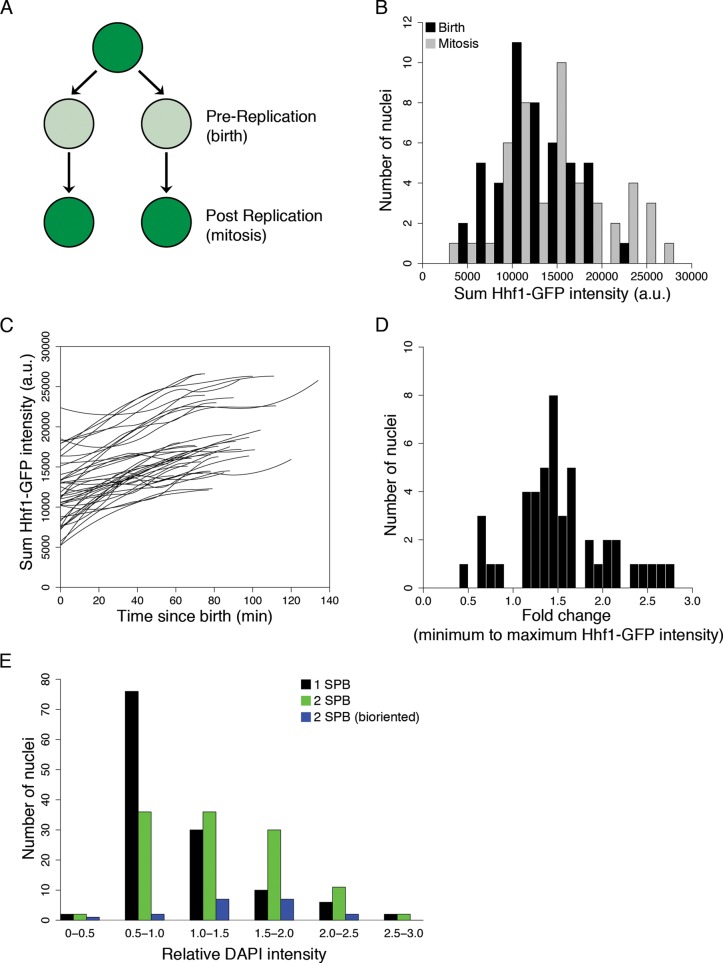
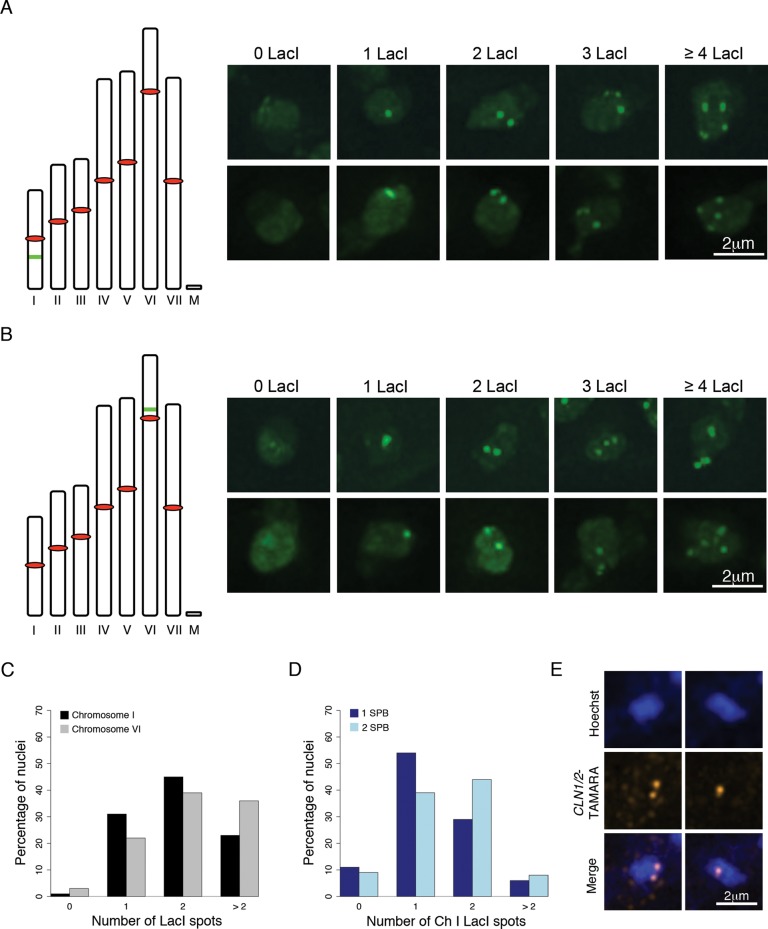
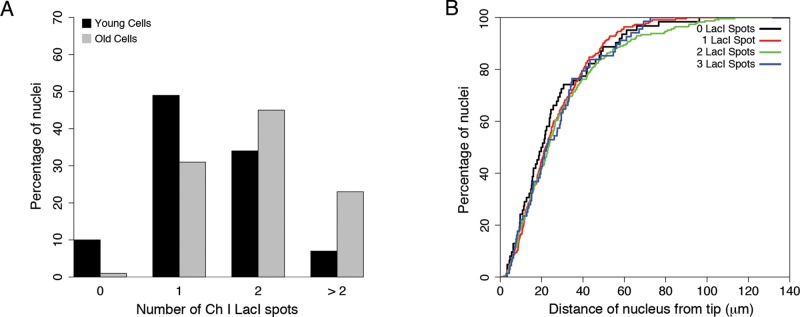
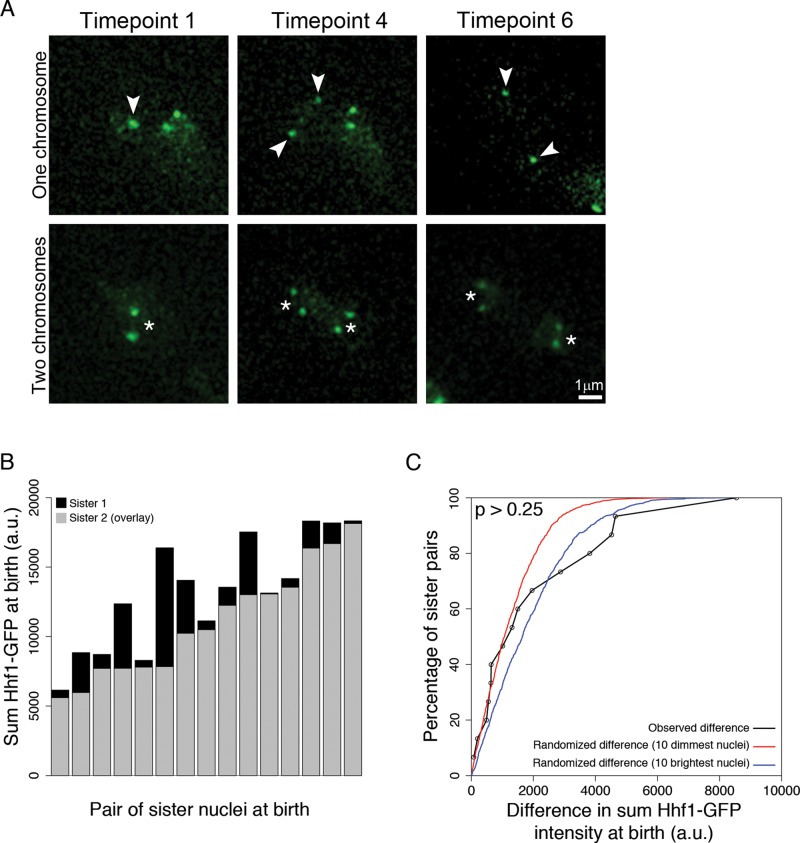
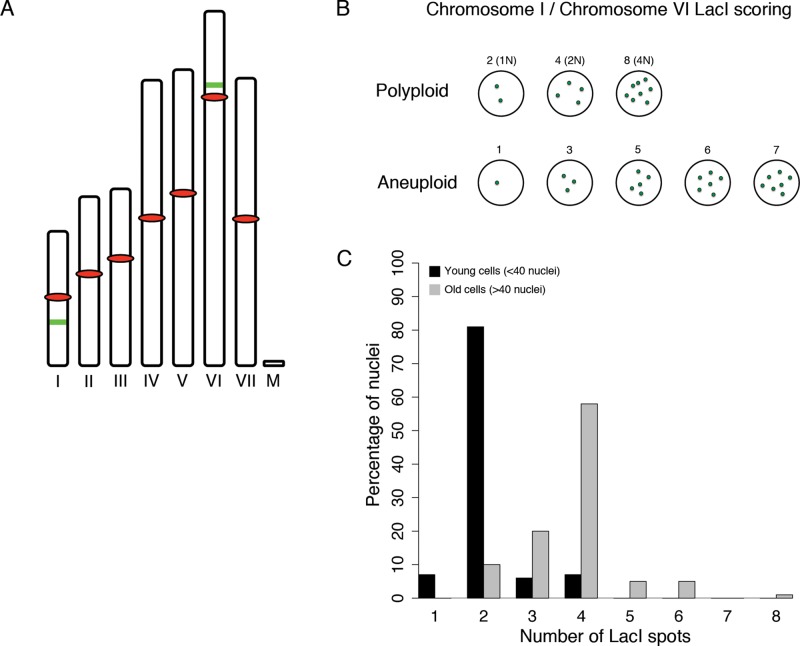
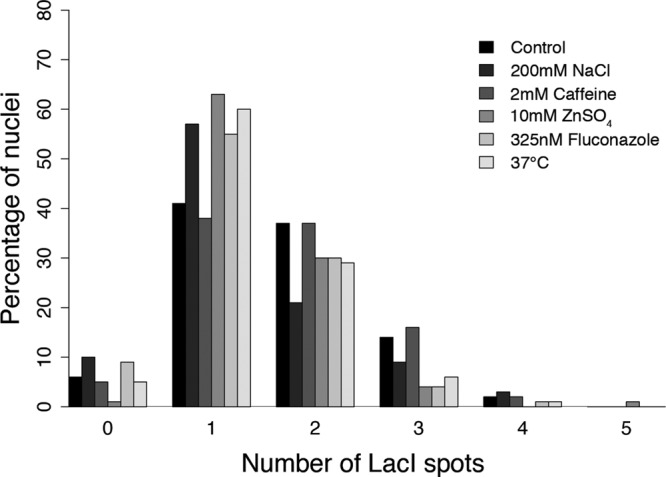
Ploidy variation is found in contexts as diverse as solid tumors, drug resistance in fungal infection, and normal development. Altering chromosome or genome copy number supports adaptation to fluctuating environments but is also associated with fitness defects attributed to protein imbalances. Both aneuploidy and polyploidy can arise from multinucleate states after failed cytokinesis or cell fusion. The consequences of ploidy variation in syncytia are difficult to predict because protein imbalances are theoretically buffered by a common cytoplasm. We examined ploidy in a naturally multinucleate fungus, Ashbya gossypii. Using integrated lac operator arrays, we found that chromosome number varies substantially among nuclei sharing a common cytoplasm. Populations of nuclei range from 1N to >4N, with different polyploidies in the same cell and low levels of aneuploidy. The degree of ploidy variation increases as cells age. In response to cellular stress, polyploid nuclei diminish and haploid nuclei predominate. These data suggest that mixed ploidy is tolerated in these syncytia; however, there may be costs associated with variation as stress homogenizes the genome content of nuclei. Furthermore, the results suggest that sharing of gene products is limited, and thus there is incomplete buffering of ploidy variation despite a common cytosol.


Figures

FIGURE 1:
FIGURE 1:
DNA content varies among Ashbya nuclei. (A) Schematic of predicted relative Hhf1-GFP intensity changes before replication and after replication. (B) Hhf1-GFP intensity at birth and mitosis. Background-corrected GFP intensity was measured by thresholding around the central nuclear coordinate, which was manually recorded immediately before and after mitosis (47 nuclei; Anderson et al., 2013). (C) Background-corrected Hhf1-GFP intensity summed for each nucleus over time. Each line represents one nucleus (47 nuclei). (D) Fold change in Hhf1-GFP intensity over time for each nucleus tracked. Fold change was defined as the maximum Hhf1-GFP intensity normalized to the starting Hhf1-GFP intensity for each nucleus (47 nuclei). (E) Histogram of DAPI intensity for all cell cycle phases. Cell cycle stage was scored by SPB state, and GFP intensity was normalized to the one-SPB population mean. Black bars represent one SPB (G1; N = 126), green bars represent two SPBd (S/G2; N = 117), and blue bars represent two SPBs that are bioriented (M; N = 19).
FIGURE 2:
FIGURE 2:
Individual chromosomes are variable between nuclei. (A, B) Schematic of Ashbya chromosomes. All seven chromosomes and the mitochondrial DNA are shown to scale. Red ovals indicate centromeres; green bars indicate the location of the 32lacO::Gen3 integration onto chromosomes I (A) and VI (B). The chromosome I and IV lacO integrations are 126 and 56 kb away from the centromere, respectively. Still images of Ashbya nuclei containing zero to four copies of both chromosomes I and VI are shown beside each schematic. (C) Quantification of chromosome counts in Ashbya nuclei. Chromosome I counts are indicated in black and chromosome VI counts are in gray (chromosome I, N = 350; VI, N = 364). (D) Chromosome I counts are independent of cell cycle phase, as indicated by SPB state. Dark blue bars represent chromosome I distribution for one SPB (G1), and light blue bars represent the chromosome I distribution for two SPBs (S/G2/M). One SPB, N = 112; two SPBs, N = 66. (E) RNA FISH of individual nuclei using CLN1/2-TAMRA probes that hybridize to mRNA. Signals in nucleus represent sites of gene expression, and >90% nuclei express CLN1/2 transcript. Images of DNA (Hoechst) and chromosomes and a merge image show that individual nuclei containing one or two signals indicate sites where CLN1/2 is expressed in a single nucleus.
FIGURE 3:
FIGURE 3:
Ashbya chromosome variation is independent of location in the cell and increases as cells age. (A) Chromosome I counts and cell age. Black bars represent the chromosome I distribution for young cells (<40 nuclei), and gray bars represent the chromosome I distribution for older cells (>40 nuclei). Young cells, N = 178; old cells, N = 350. (B) Cumulative distribution plot of chromosome I counts and distance from cell tip (ANOVA, F = 1.56, p > 0.20).
FIGURE 4:
FIGURE 4:
Ashbya faithfully segregates chromosomes at mitosis. (A) Still images of chromosome segregation at mitosis. Top, frames from Supplemental Movie S1, showing one copy of chromosome I being faithfully segregated. Arrowheads point to single chromosome spots. Bottom, frames from Supplemental Movie S2, showing two copies of chromosome I being segregated. The asterisk is centered between the two copies of chromosome I in each nucleus. (B) Sister Hhf1-GFP intensity at birth. The sum Hhf1-GFP intensity of the brighter sister is plotted in black, with the dimmer sister overlaid in gray (15 pairs of sisters). (C) Kolmogorov–Smirnov (K-S) test plot of observed sister Hhf1-GFP intensities. The observed difference in sister Hhf1-GFP intensity at birth (immediately after mitosis) is displayed as a cumulative distribution plot in black. A randomized difference was calculated for two different populations of observed nuclei; the lowest 10 observed Hhf1-GFP intensities were used as a distribution for 1N, and the highest 10 observed Hhf1-GFP intensities were used as a distribution for 2N. No difference is observed between the difference in sister Hhf1-GFP intensity and randomly pairing nuclei in these two subpopulations (15 sister pairs; compared with 1N [red line], D = 0.26, p = 0.26; compared with 2N [blue line], D = 0.19, p = 0.65).
FIGURE 5:
FIGURE 5:
Ashbya nuclei are predominantly polyploid. (A) Schematic of Ashbya chromosomes. All seven chromosomes and the mitochondrial DNA are shown to scale. Red ovals indicate centromeres, and green bars indicate the location of the 32lacO::Gen3 integration onto chromosomes I and VI. (B) Schematic of ChI 32lacO::Gen3/ChVI 32-lacO::Nat1 results. Nuclei with two, four, or eight resolvable LacI spots are polyploid. All other LacI spot counts would be evidence for aneuploidy. (C) Quantification of chromosome counts in ChI 32-lacO::Gen3/ChVI 32-lacO::Nat1 Ashbya nuclei. Black bars represent the distribution for young cells (<40 nuclei, N = 118), and gray bars represent the distribution for older cells (>40 nuclei, N = 253).
FIGURE 6:
FIGURE 6:
mad2Δ cells have decreased viability in Ashbya. Colony growth of wild-type (-ade2) and mad2Δ::NAT1 heterokaryon strains. Bars, SD; three plates/strain. Images represent colony growth after 5 d.
FIGURE 7:
FIGURE 7:
Chromosome number variation decreases in response to various cellular stresses. Quantification of chromosome I counts in Ashbya nuclei under normal growth and in the presence of various cellular stresses (>85 nuclei/condition).

References

    1. Albertin W, Marullo P. Polyploidy in fungi: evolution after whole-genome duplication. Proc Biol Sci. 2012;279:2497–2509. - PMC - PubMed
    1. Anderson CA, Eser U, Korndorf T, Borsuk ME, Skotheim JM, Gladfelter AS. Nuclear repulsion enables division autonomy in a single cytoplasm. Curr Biol. 2013;23:1999–2010. - PMC - PubMed
    1. Ayad-Durieux Y, Knechtle P, Goff S, Dietrich FS, Philippsen P. A PAK-like protein kinase is required for maturation of young hyphae and septation in the filamentous ascomycete Ashbya gossypii. J Cell Sci. 2000;113(Pt 24):4563–4575. - PubMed
    1. Bakhoum SF, Compton DA. Chromosomal instability and cancer: a complex relationship with therapeutic potential. J Clin Invest. 2012;122:1138–1143. - PMC - PubMed
    1. Bennett RJ. Completion of a parasexual cycle in Candida albicans by induced chromosome loss in tetraploid strains. EMBO J. 2003;22:2505–2515. - PMC - PubMed

Publication types

LinkOut - more resources