. 2015 Apr 1;26(7):1386-94.
doi: 10.1091/mbc.E14-07-1175. Epub 2015 Jan 28.

Size-dependent leak of soluble and membrane proteins through the yeast nuclear pore complex

Affiliations

Size-dependent leak of soluble and membrane proteins through the yeast nuclear pore complex

Petra Popken et al. Mol Biol Cell. .

Abstract

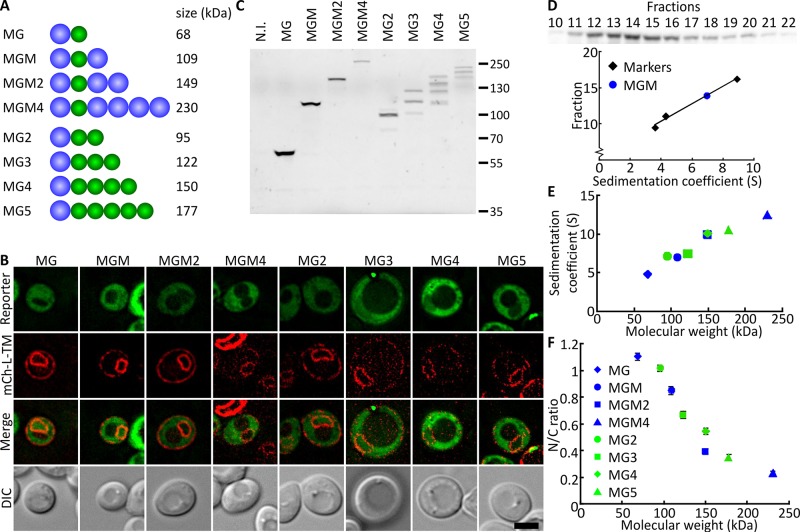
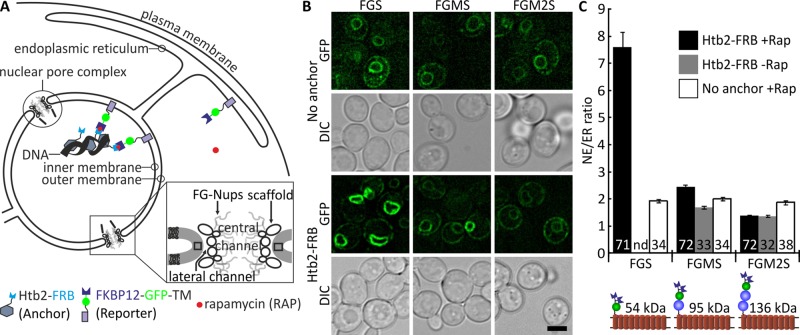
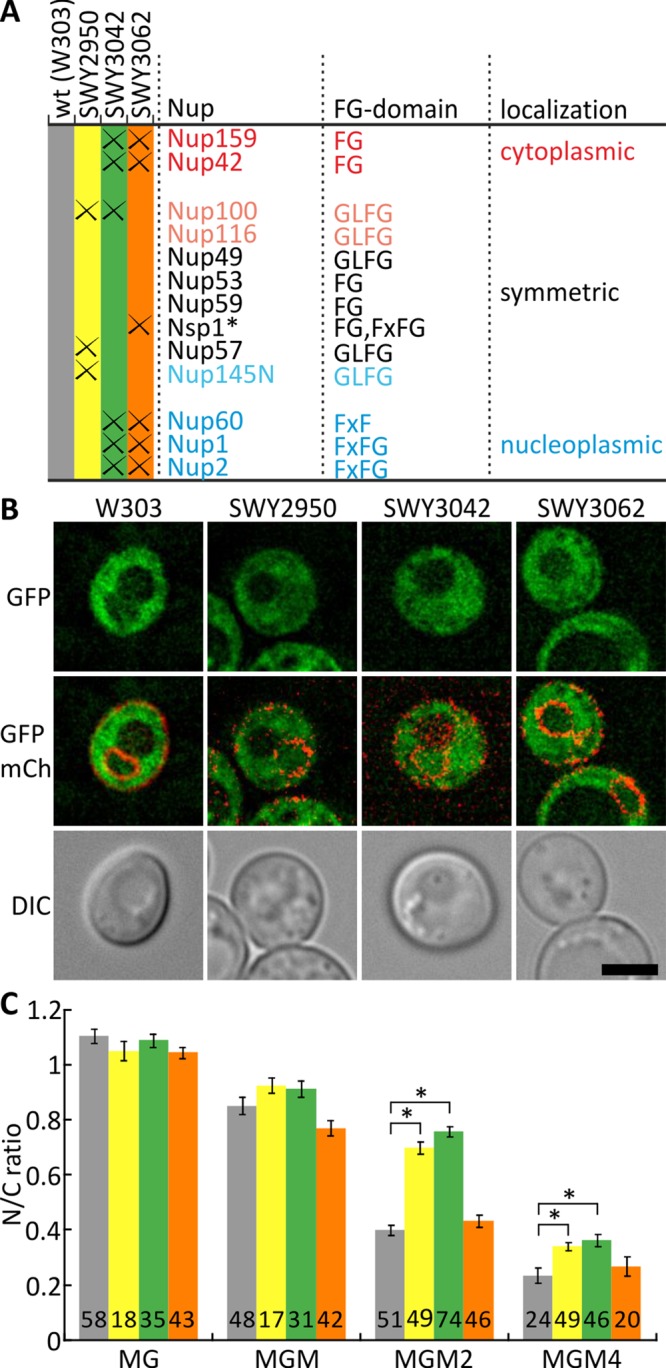
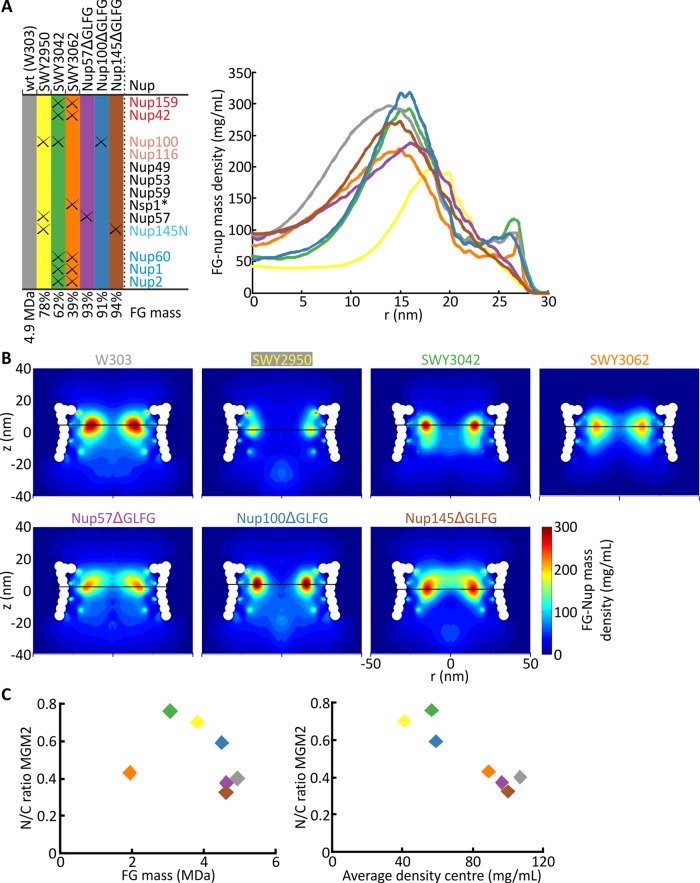
Nuclear pore complexes (NPCs) allow selective import and export while forming a barrier for untargeted proteins. Using fluorescence microscopy, we measured in vivo the permeability of the Saccharomyces cerevisiae NPC for multidomain proteins of different sizes and found that soluble proteins of 150 kDa and membrane proteins with an extralumenal domain of 90 kDa were still partly localized in the nucleus on a time scale of hours. The NPCs thus form only a weak barrier for the majority of yeast proteins, given their monomeric size. Using FGΔ-mutant strains, we showed that specific combinations of Nups, especially with Nup100, but not the total mass of FG-nups per pore, were important for forming the barrier. Models of the disordered phase of wild-type and mutant NPCs were generated using a one bead per amino acid molecular dynamics model. The permeability measurements correlated with the density predictions from coarse-grained molecular dynamics simulations in the center of the NPC. The combined in vivo and computational approach provides a framework for elucidating the structural and functional properties of the permeability barrier of nuclear pore complexes.


Figures

FIGURE 1:
FIGURE 1:
Expression and localization of soluble reporter proteins. Permeability of the NPC correlates with sedimentation coefficient and molecular weight. (A) Cartoon representing domain composition and size of reporter proteins. G, GFP; M, MBP. (B) Deconvolved images of cells expressing reporter proteins of increasing size (green). mCh-L-TM (red) is localized in the NE-ER network and used to locate the nucleus. Cells were induced with 0.1% (wt/vol) galactose for 3 h, followed by 1-h incubation with 1% (wt/vol) glucose to block expression and allow proteins to equilibrate between cytoplasm and nucleus. Scale bar, 3 μm. (C) Lysates from cells expressing indicated reporter proteins analyzed on SDS–PAGE, in-gel fluorescence detected. N.I., not induced. A Western blot of the same samples is shown in Supplemental Figure S1A. (D) Western blot (detection with anti-GFP) of fractions from a sucrose gradient over which a whole-cell extract of cells expressing MGM (and mCh-L-TM) was separated. Three biotin-labeled marker proteins—ovalbumin (3.6 S), bovine serum albumin (4.3 S), and amylase (8.9 S)—were used as internal standard. The peak width at half-maximum for the reporter proteins is ∼6 fractions. Estimated error ± 1 S. (E) Plot of the obtained sedimentation coefficients against the molecular weight of the reporters. (F) NPC permeability, quantified by the ratio of the fluorescence intensity in the nucleus and cytosol (N/C ratio), plotted as function of the molecular weight of the reporters. N/C ratio close to 1 means that the reporter equilibrates over cytoplasm and nucleus within the time frame of the experiment. A low N/C ratio shows that the diffusion through the NPC is hindered. Plotted N/C ratios are the mean for ∼50 cells; SEM is indicated.
FIGURE 2:
FIGURE 2:
Size dependence of diffusion of membrane proteins through lateral channels of the NPC. Access to the INM depends on the size of extralumenal domains. (A) Cartoon explaining an inducible diffusion-retention assay reporting access to the INM. The reporter proteins with an extralumenal FKBP domain are mobile within the ER and the ONM and, if small enough, also the INM. Htb2-FRB is the anchor in the nucleus. On addition of rapamycin, FKBP and FRB form a complex, trapping any INM-resident reporter irreversibly in the INM. Inset, model of the NPC, indicating the lateral channel. (B) Deconvolved images of cells expressing reporter proteins with extralumenal domains increasing in size. Cells were induced with 0.1% (wt/vol) galactose for 1 h with simultaneous addition of rapamycin. Scale bar, 3 μm. (C) Permeability of NPC quantified by fluorescence intensity in NE over ER in the indicated number of cells after 1-h expression in the presence of rapamycin. High NE/ER ratio represents accumulation in the NE, showing that the reporter can diffuse to the INM and is trapped there. Error bars are SEM; numbers, cells analyzed; nd, not determined. NE/ER ratios were significantly higher for FGS and FGMS in Htb2-FRB + Rap (black bars) compared with no anchor + Rap (white bars). Cartoons of the reporters used are included; FGS, FKBP-GFP-Sec61TMs; FGMS, FKBP-GFP-MBP-Sec61TMs; FGM2S, FKBP-GFP-2xMBP-Sec61TMs. Size of the cytoplasmic domain is indicated.
FIGURE 3:
FIGURE 3:
Permeability of NPC in FGΔ-mutant strains. (A) Table indicating strains used and which FG-domains are lacking. *In all strains, Nsp1 is missing amino acids 349–443; see Materials and Methods. (B) Deconvolved images of cells expressing reporter MGM2 (green), comparing wild-type W303 with three FGΔ-mutant strains. SWY3062 shows similar localization as wild type, whereas SWY2950 and SWY3042 show more nuclear localization. Scale bar, 3 μm. (C) Permeability of NPC quantified as the mean N/C ratio over the indicated numbers of cells for four different reporters—MG, MGM, MGM2, and MGM4. Error bars are SEM; numbers, cells analyzed. Significant changes are indicated with asterisks; all other pairwise comparisons between the strains are not significant.
FIGURE 4:
FIGURE 4:
Coarse-grained modeling of FGΔ-mutant strains. (A) The table shows the strains used with their respective FG-domain deletions and the remaining FG-domain mass as compared with wild-type NPCs (based on the definition in Strawn et al., 2004). The graph plots the modeled FG-nup mass density in the pore in the different FG-deletion strains, measured at z with maximum density (indicated by black horizontal lines in B). *In all strains, Nsp1 is missing amino acids 349–443; see Materials and Methods. (B) Two-dimensional FG-nup mass density plots of the mutant NPCs. A more detailed definition of the composition of the modeled NPCs and the fluctuation of the FG-nup mass density over the simulation time are given in Supplemental Methods and Supplemental Figure S3. Horizontal lines indicate z-plane with maximum density. (C) The permeability (in vivo–determined N/C ratio) of the reporter MGM2 plotted against the FG-domain protein mass (left) and against the computed average protein density in the center (r = 0–5 nm) of the NPC at z with maximum density (right).

References

    1. Adams R, Wente S. Uncovering nuclear pore complexity with innovation. Cell. 2013;152:1218–1221. - PMC - PubMed
    1. Aitchison J, Rout M. The yeast nuclear pore complex and transport through it. Genetics. 2012;190:855–883. - PMC - PubMed
    1. Alber F, Dokudovskaya S, Veenhoff LM, Zhang W, Kipper J, Devos D, Suprapto A, Karni-Schmidt O, Williams R, Chait BT, et al. The molecular architecture of the nuclear pore complex. Nature. 2007;450:695–701. - PubMed
    1. Beetz C, Brodhun M, Moutzouris K, Kiehntopf M, Berndt A, Lehnert D, Deufel T, Bastmeyer M, Schickel J. Identification of nuclear localisation sequences in spastin (SPG4) using a novel Tetra-GFP reporter system. Biochem Biophys Res Commun. 2004;318:1079–1084. - PubMed
    1. Chatterjee S, Javier M, Stochaj U. In vivo analysis of nuclear protein traffic in mammalian cells. Exp Cell Res. 1997;236:346–350. - PubMed

Publication types

Substances

LinkOut - more resources