. 2015 Mar 1;194(5):2148-59.
doi: 10.4049/jimmunol.1401876. Epub 2015 Jan 28.

A transendocytosis model of CTLA-4 function predicts its suppressive behavior on regulatory T cells

Affiliations

A transendocytosis model of CTLA-4 function predicts its suppressive behavior on regulatory T cells

Tie Zheng Hou et al. J Immunol. .

Abstract

Manipulation of the CD28/CTLA-4 pathway is at the heart of a number of immunomodulatory approaches used in both autoimmunity and cancer. Although it is clear that CTLA-4 is a critical regulator of T cell responses, the immunological contexts in which CTLA-4 controls immune responses are not well defined. In this study, we show that whereas CD80/CD86-dependent activation of resting human T cells caused extensive T cell proliferation and robust CTLA-4 expression, in this context CTLA-4 blocking Abs had no impact on the response. In contrast, in settings where CTLA-4(+) cells were present as "regulators," inhibition of resting T cell responses was dependent on CTLA-4 expression and specifically related to the number of APC. At low numbers of APC or low levels of ligand, CTLA-4-dependent suppression was highly effective whereas at higher APC numbers or high levels of ligand, inhibition was lost. Accordingly, the degree of suppression correlated with the level of CD86 expression remaining on the APC. These data reveal clear rules for the inhibitory function of CTLA-4 on regulatory T cells, which are predicted by its ability to remove ligands from APC.


Figures

Figure 1
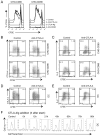
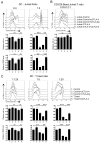
Figure 1. CTLA-4 blockade has little impact on resting T cell proliferation or IL-2 production
CFSE labelled responder CD4 T cells were stimulated with 0.5μg/ml of soluble anti-CD3 and CHO-CD80 or CHO-CD86 expressing cells (A, B and C) or monocyte derived DC (D and E). A. T cell stimulations were carried out in the presence or absence anti-CTLA-4 Ab (Tremelimumab; 40μg/ml), CTLA-4 Ig (Abatacept 10μg/ml) or anti-CD28 Ab (10μg/ml) for 5 days and analysed by flow cytometry. B and C. Cells stimulated as in A were analysed for cell division and total CTLA-4 expression in the presence or absence of CTLA-4 blockade or for IL-2 production. In D and E, T cell responses were stimulated with monocyte-derived DC in the presence of anti-CD3 and analysed for CTLA-4 expression (D) and IL-2 production (E). For cytokine analysis, cultures were re-stimulated at day 5, with PMA/Ionomycin in the presence of Brefeldin A for 4 hours. The data presented is representative of five independent experiments. F. CD80/86 control commitment of CD4 T cells at the first 24-48 hours. Cell Trace Violet labeled naïve CD4 conventional T cells were stimulated by soluble anti-CD3 (0.5ug/ml) and human monocyte-derived DC in the presence of CTLA-4Ig (or Abatacept 10ug/ml) at indicated time after culture setup. Data are representative of three separate experiments.
Figure 2
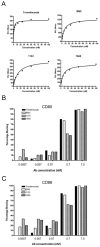
Figure 2. Characterization of blocking anti-CTLA-4 Abs
A. Analysis of anti-CTLA-4 Abs binding to CTLA-4-Ig using surface plasmon resonance. The maximum response unit for each concentration of anti-CTLA-4 was plotted for four different anti-CTLA-4 clones. B and C. Anti-CTLA-4 Abs were tested for their ability to block CTLA-4-Ig binding to CD80 or CD86. CHO Cells expressing either CD80 (B) or CD86 (C) were incubated with 0.1μg/ml of CTLA-4Ig in the presence of increasing concentrations (nM) of Tremelimumab, BNI3, 11G1 and 10A8 anti-CTLA-4 Abs. Percentage blocking is calculated based on the MFI of unblocked CTLA-4-Ig staining.
Figure 3
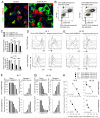
Figure 3. Characterisation and blocking of CD86 transendocytosis
A. CTLA-4 mediated acquisition of CD86 is blocked by anti-CTLA-4. Confocal micrographs show adherent CHO-CD86 cells and CHO-CTLA-4 cells after overnight incubation in presence or absence of anti-CTLA-4 blockade. CD86 (green) and CTLA-4 (red) were detected by Ab staining. Colocalization of CD86 and CTLA-4 is shown in yellow. B Depletion of CD86 from CD86+ cells is associated with concomitant CD86 acquisition by CTLA-4+ cells detected by flow cytometry. Far red labeled donor CHO-CD86-GFP cells were co-cultured with recipient CHO-CTLA-4 (RH panel) or CHO-Control (LH Panel) at 37°C for 20h. After coculture, singlet CTLA-4+ cells were analyzed for CD86-GFP acquisition based on far-red negative cells and loss of GFP from donors was determined by gating on far-red positive cells. C. Depletion of CD86 by CTLA-4 overtime. CHO-CD86-GFP cells were cultured with CHO-CTLA-4 as in B. at 4:1 (upper panel) and 4:16 (lower panel) of donor to recipient ratio for 3, 10 and 21 hours. The MFI of GFP remaining on donor cells were used to calculate relative expression level. Bar graph shows mean ± SEM of 3 experiments. P values were determined by unpaired, 2-tailed, t-test. *P < 0.05, **P < 0.01, ***P < 0.001. D and E. Mean fluorescence intensity (MFI) of GFP on donors or recipients are shown for both high and low densities of ligand expression at 3h(D) and 24h(E). F and G. CD86 remaining on donors is inversely correlated with CD86 acquired by CTLA-4 on recipients. Conditions in D-G are numbered as: 1. CHO-Control only; 2. CHO-CD86GFP only; 3. CHO-CTLA-4 only; 4. 4:0.25 (CHO-CD86GFP: CHO-CTLA-4); 5. 4:1 (CHO-CD86GFP: CHO-CTLA-4); 6. 4:4 (CHO-CD86GFP: CHO-CTLA-4); 7. 4:16 (CHO-CD86GFP: CHO-CTLA-4); 8. 4:16 (CHO-CD86GFP: CHO-Control). Total fluorescent intensity (TFI) of GFP was calculated as cell number × GFP MFI on both donors and recipients following transendocytosis as shown in C and D. G. Plots show the relationship between total GFP acquired by CTLA-4 expressing cells vs GFP remaining on the donors. Data are presented at 3h and 24h using both high and low density donors.
Figure 4
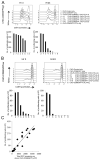
Figure 4. CTLA-4 mediated down-regulation of CD86 is functionally relevant for T cell activation
A and B. Cell trace violet-labelled human naïve CD4+ T cells were stimulated with CHO-CD86GFP cells which were FACS sorted following transendocytosis as performed in figure 1 in the presence of 0.5μg/ml soluble anti-CD3. Cell division was monitored using cell trace violet dilution at day 5 using flow cytometry. Live proliferating T cell counts were determined using counting beads and the total cell numbers shown in bar charts. Correlation between total CD86 remaining on the APC and total proliferating T cell number is shown in C. The data presented are representative of 3 independent experiments.
Figure 5
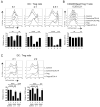
Figure 5. CTLA-4 suppression via DC doesn’t require specialised cell type
A. Violet-labelled human naïve T cells were stimulated using DC in the presence of anti-CD3 and suppression measured in response to CTLA-4 negative (control) or CTLA-4 transduced Jurkat cells. Assays were carried out in the presence or absence of anti-CTLA-4 or in the presence of CTLA-4Ig (10μg/ml) to establish costimulation dependence. Monocyte derived DC were used for costimulation at the indicated ratio. B. Violet-labelled naïve T cells were stimulated with anti-CD3/CD28 coated beads to provide a ligand independent stimulus and suppression of CTLA-4+ Jurkat cells monitored as in A. Cell division was monitored by dye dilution at day 5 using flow cytometry and the absolute number of dividing T cells shown in bar chart. Expression levels of CD86 on CD11c+ DC are shown in mean fluorescence intensity (MFI) by flow cytometric analysis using anti-CD86 Abs. C. Activated T cells expressing CTLA-4 were used as suppressor cells in the same manner as in A. Bar chart depicts mean ± SEM. n = 3. P values were determined by unpaired, 2-tailed, t-test. ns, not significant, P > 0.05, **P < 0.01, ***P < 0.001. Data are representative of 3 independent experiments.
Figure 6
Figure 6. Transendocytosis predicts the behavior of CTLA-4 dependent suppression by Treg
A. Cell trace violet-labelled human naïve T cells were stimulated with soluble anti-CD3 (0.5μg/ml) and human monocyte-derived DC for costimulation at the indicated ratios in the absence or presence of Treg. Anti-CTLA-4 (40μg/ml) or CTLA-4-Ig (10ug/ml) were used to block CTLA-4 or ligands respectively. Cell division was monitored by violet dilution at day 5 using flow cytometry. Absolute number of dividing T cells were calculated and shown in bar charts. B. Naïve T cells were stimulated with CD3/CD28 beads and responses measured as in A. C. Suppression assays were carried out as in (A) with the exception that the DC numbers remained fixed and the Treg numbers increased thereby maintaining equivalent stimulation of responder T cells. Number of dividing T cells were calculated and shown in bar charts along with expression levels of CD86 on CD11c+ DC are shown as MFI. Bar graph shows mean ± SEM. n =3-5. P values were determined by unpaired, 2-tailed, t-test. ns, not significant, P > 0.05, **P < 0.01, ***P < 0.001. Data are representative of 5 experiments performed.

Similar articles

Cited by

References

    1. Banchereau J, Steinman RM. Dendritic cells and the control of immunity. Nature. 1998;392:245–252. - PubMed
    1. Reis e S. Dendritic cells as sensors of infection. Immunity. 2001;14:495–498. - PubMed
    1. Akira S, Takeda K, Kaisho T. Toll-like receptors: critical proteins linking innate and acquired immunity. Nat.Immunol. 2001;2:675–680. - PubMed
    1. Linsley PS, Clark EA, Ledbetter JA. T-cell antigen CD28 mediates adhesion with B cells by interacting with activation antigen B7/BB-1. Proc.Natl.Acad.Sci.U.S.A. 1990;87:5031–5035. - PMC - PubMed
    1. Azuma M, Ito D, Yagita H, Okumura K, Phillips JH, Lanier LL, Somoza C. B70 antigen is a second ligand for CTLA-4 and CD28. Nature. 1993;366:76–79. - PubMed

Publication types

MeSH terms