

A comparison of physiological and transcriptome responses to water deprivation and salt loading in the rat supraoptic nucleus
- PMID: 25632023
- PMCID: PMC4386000
- DOI: 10.1152/ajpregu.00444.2014
A comparison of physiological and transcriptome responses to water deprivation and salt loading in the rat supraoptic nucleus
Abstract
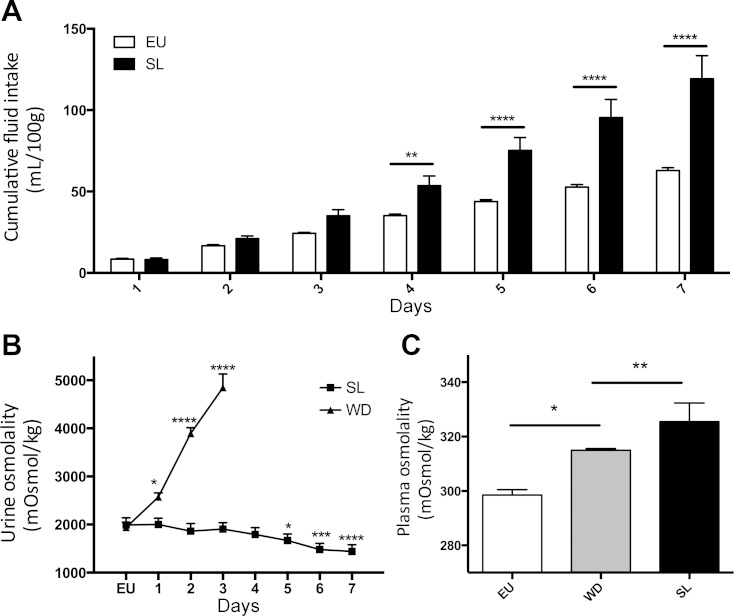
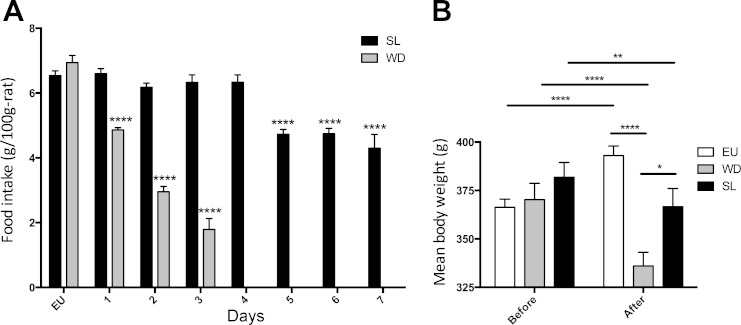
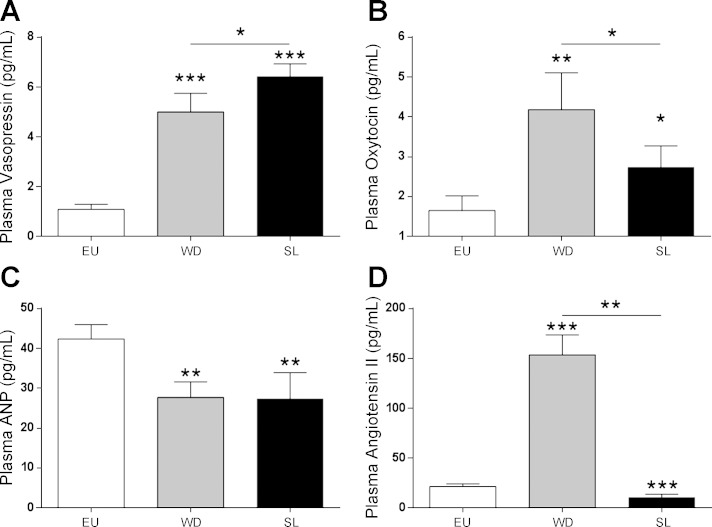
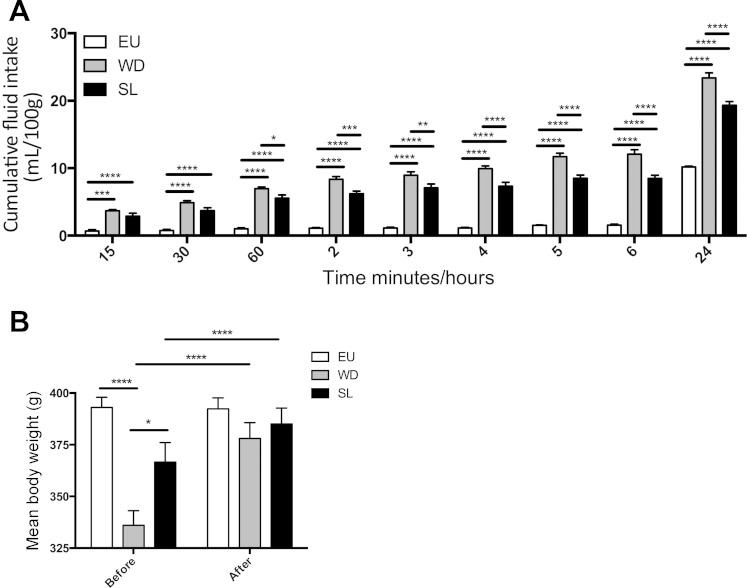
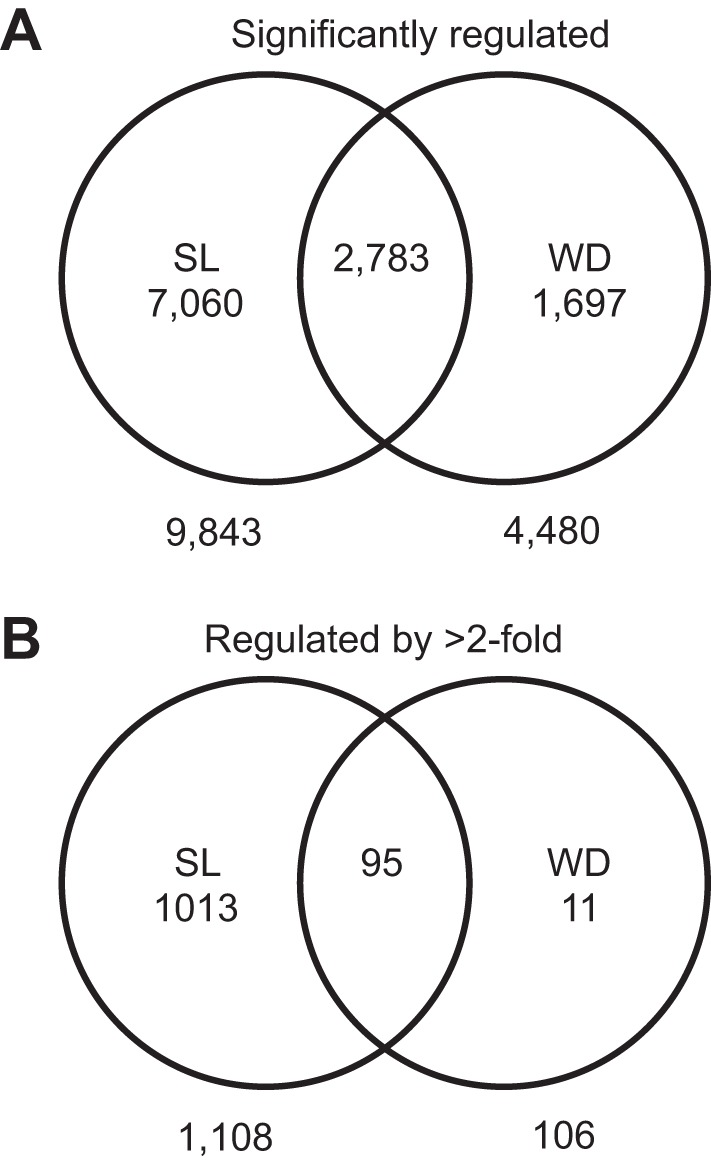
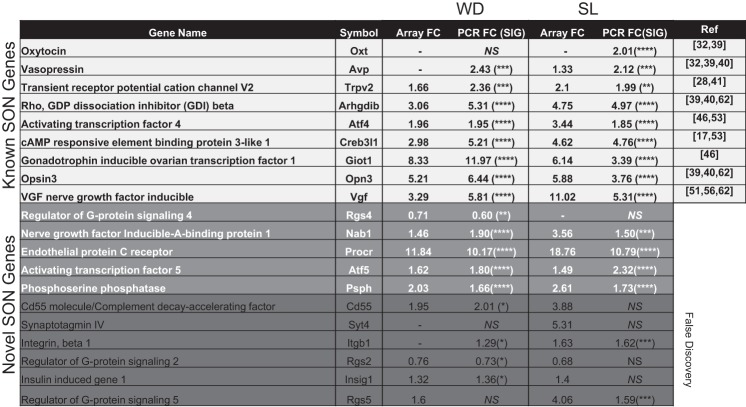
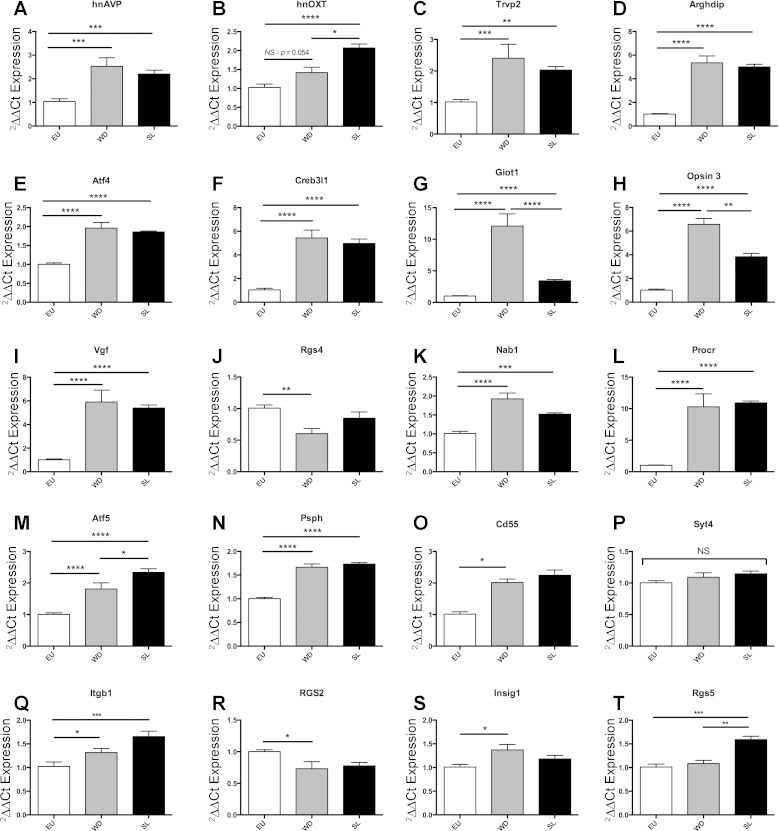
Salt loading (SL) and water deprivation (WD) are experimental challenges that are often used to study the osmotic circuitry of the brain. Central to this circuit is the supraoptic nucleus (SON) of the hypothalamus, which is responsible for the biosynthesis of the hormones, arginine vasopressin (AVP) and oxytocin (OXT), and their transport to terminals that reside in the posterior lobe of the pituitary. On osmotic challenge evoked by a change in blood volume or osmolality, the SON undergoes a function-related plasticity that creates an environment that allows for an appropriate hormone response. Here, we have described the impact of SL and WD compared with euhydrated (EU) controls in terms of drinking and eating behavior, body weight, and recorded physiological data including circulating hormone data and plasma and urine osmolality. We have also used microarrays to profile the transcriptome of the SON following SL and remined data from the SON that describes the transcriptome response to WD. From a list of 2,783 commonly regulated transcripts, we selected 20 genes for validation by qPCR. All of the 9 genes that have already been described as expressed or regulated in the SON by osmotic stimuli were confirmed in our models. Of the 11 novel genes, 5 were successfully validated while 6 were false discoveries.
Keywords: neuroendocrine; salt load; supraoptic nucleus; transcriptome; water restriction.
Figures
Similar articles
-
A RNA-Seq Analysis of the Rat Supraoptic Nucleus Transcriptome: Effects of Salt Loading on Gene Expression.PLoS One. 2015 Apr 21;10(4):e0124523. doi: 10.1371/journal.pone.0124523. eCollection 2015. PLoS One. 2015. PMID: 25897513 Free PMC article.
-
Highly visible expression of an oxytocin-monomeric red fluorescent protein 1 fusion gene in the hypothalamus and posterior pituitary of transgenic rats.Endocrinology. 2011 Jul;152(7):2768-74. doi: 10.1210/en.2011-0006. Epub 2011 May 3. Endocrinology. 2011. PMID: 21540286
-
Exaggerated response of arginine vasopressin-enhanced green fluorescent protein fusion gene to salt loading without disturbance of body fluid homeostasis in rats.J Neuroendocrinol. 2006 Oct;18(10):776-85. doi: 10.1111/j.1365-2826.2006.01476.x. J Neuroendocrinol. 2006. PMID: 16965296
-
Gene expression in the supraoptic nucleus.Microsc Res Tech. 2002 Jan 15;56(2):158-63. doi: 10.1002/jemt.10020. Microsc Res Tech. 2002. PMID: 11810718 Review.
-
Endogenous modulators of synaptic transmission: cannabinoid regulation in the supraoptic nucleus.Prog Brain Res. 2008;170:129-36. doi: 10.1016/S0079-6123(08)00412-3. Prog Brain Res. 2008. PMID: 18655878 Free PMC article. Review.
Cited by
-
A high salt diet inhibits obesity and delays puberty in the female rat.Int J Obes (Lond). 2017 Nov;41(11):1685-1692. doi: 10.1038/ijo.2017.154. Epub 2017 Jul 4. Int J Obes (Lond). 2017. PMID: 28674441 Free PMC article.
-
Unsupervised Network Analysis of the Plastic Supraoptic Nucleus Transcriptome Predicts Caprin2 Regulatory Interactions.eNeuro. 2017 Dec 21;4(6):ENEURO.0243-17.2017. doi: 10.1523/ENEURO.0243-17.2017. eCollection 2017 Nov-Dec. eNeuro. 2017. PMID: 29279858 Free PMC article.
-
Transcription Factor TonEBP Stimulates Hyperosmolality-Dependent Arginine Vasopressin Gene Expression in the Mouse Hypothalamus.Front Endocrinol (Lausanne). 2021 Mar 16;12:627343. doi: 10.3389/fendo.2021.627343. eCollection 2021. Front Endocrinol (Lausanne). 2021. PMID: 33796071 Free PMC article.
-
Water deprivation induces hypoactivity in rats independently of oxytocin receptor signaling at the central amygdala.Front Endocrinol (Lausanne). 2023 Jan 31;14:1062211. doi: 10.3389/fendo.2023.1062211. eCollection 2023. Front Endocrinol (Lausanne). 2023. PMID: 36817576 Free PMC article.
-
Male rat hypothalamic extraretinal photoreceptor Opsin3 is sensitive to osmotic stimuli and light.J Neuroendocrinol. 2024 Feb;36(2):e13363. doi: 10.1111/jne.13363. Epub 2024 Jan 9. J Neuroendocrinol. 2024. PMID: 38192267 Free PMC article.
References
-
- Abramow-Newerly M, Roy AA, Nunn C, Chidiac P. RGS proteins have a signalling complex: interactions between RGS proteins and GPCRs, effectors, and auxiliary proteins. Cell Signal 18: 579–591, 2006. - PubMed
-
- Amabebe E, Idu F, Obika LF. Relationship between thirst perception and plasma arginine vasopressin concentration in man. Niger J Physiol Sci 27: 3–10, 2012. - PubMed
-
- Antunes-Rodrigues J, de Castro M, Elias LL, Valenca MM, McCann SM. Neuroendocrine control of body fluid metabolism. Physiol Rev 84: 169–208, 2004. - PubMed
-
- Antunes-Rodrigues J, Ruginsk SG, Mecawi AS, Margatho LO, Reis WL, Ventura RR, da Silva AL, Vilhena-Franco T, Elias LLK. Frontiers in neuroscience neuroendocrinology of hydromineral homeostasis. In: Neurobiology of Body Fluid Homeostasis: Transduction and Integration, edited by De Luca LA, Menani JV, and Johnson AK. Boca Raton, FL: CRC, 2014. - PubMed
Publication types
MeSH terms
Substances
Grants and funding
- RG/11/6/28714/BHF_/British Heart Foundation/United Kingdom
- BB/J005452/1/BB_/Biotechnology and Biological Sciences Research Council/United Kingdom
- ImNIH/Intramural NIH HHS/United States
- RG/12/6/29670/BHF_/British Heart Foundation/United Kingdom
- RG/11/28714/BHF_/British Heart Foundation/United Kingdom
LinkOut - more resources
Full Text Sources
Other Literature Sources
Medical
Molecular Biology Databases
Miscellaneous