. 2015 Jan 28;7(272):272ra10.
doi: 10.1126/scitranslmed.3010760.

Tracking donor-reactive T cells: Evidence for clonal deletion in tolerant kidney transplant patients

Affiliations

Tracking donor-reactive T cells: Evidence for clonal deletion in tolerant kidney transplant patients

Heather Morris et al. Sci Transl Med. .

Abstract

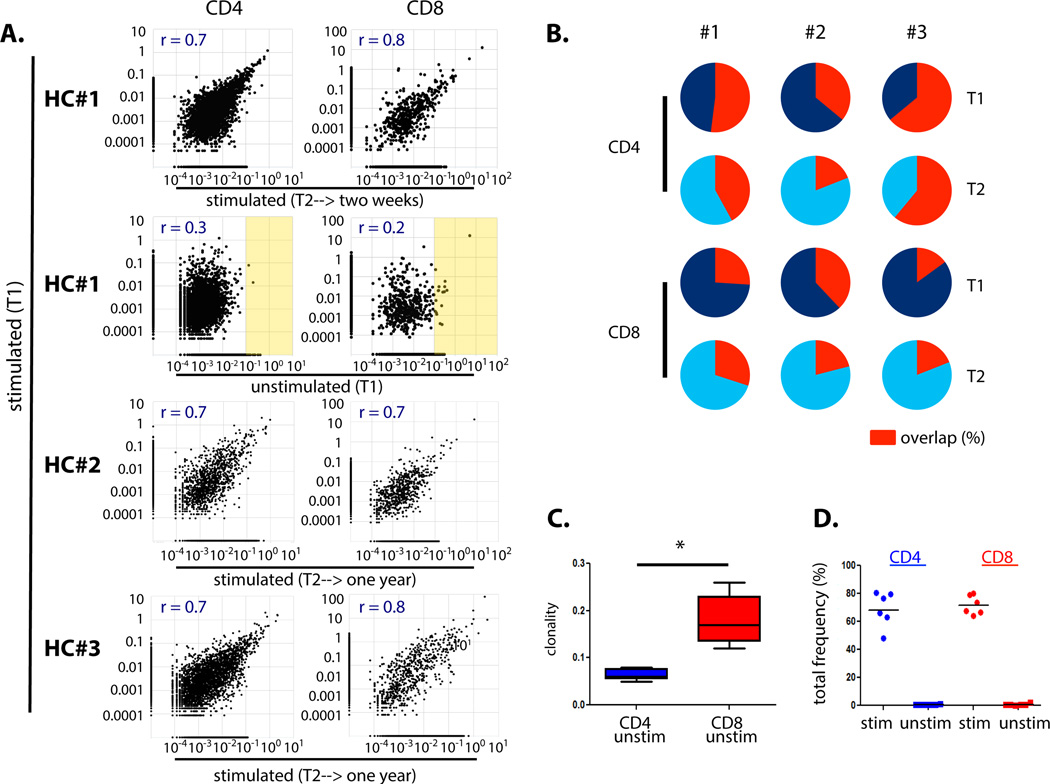
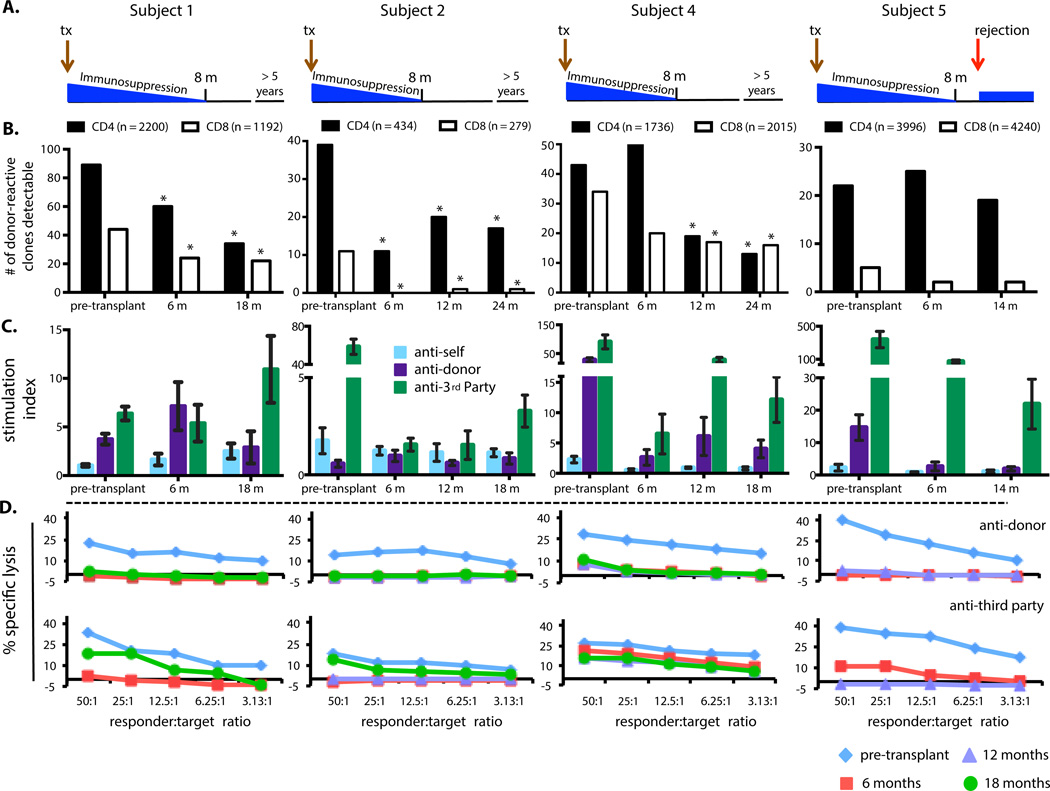
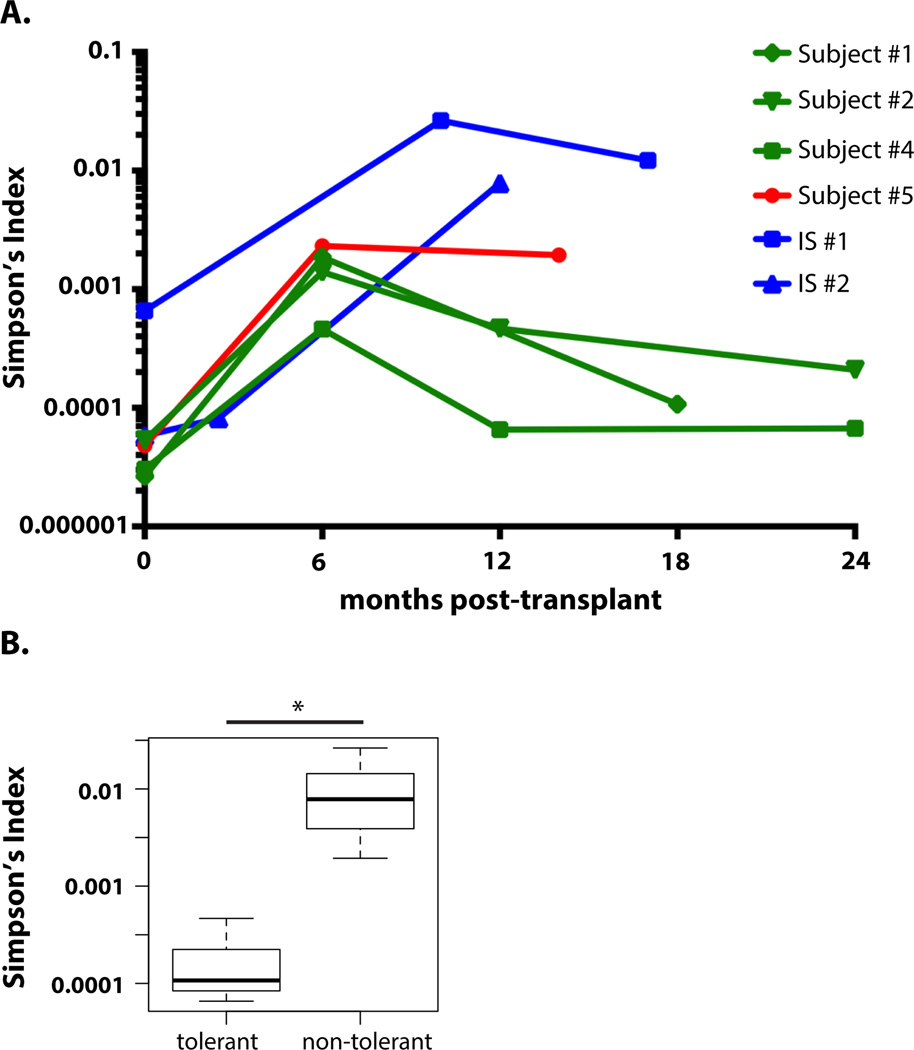
T cell responses to allogeneic major histocompatibility complex antigens present a formidable barrier to organ transplantation, necessitating long-term immunosuppression to minimize rejection. Chronic rejection and drug-induced morbidities are major limitations that could be overcome by allograft tolerance induction. Tolerance was first intentionally induced in humans via combined kidney and bone marrow transplantation (CKBMT), but the mechanisms of tolerance in these patients are incompletely understood. We now establish an assay to identify donor-reactive T cells and test the role of deletion in tolerance after CKBMT. Using high-throughput sequencing of the T cell receptor B chain CDR3 region, we define a fingerprint of the donor-reactive T cell repertoire before transplantation and track those clones after transplant. We observed posttransplant reductions in donor-reactive T cell clones in three tolerant CKBMT patients; such reductions were not observed in a fourth, nontolerant, CKBMT patient or in two conventional kidney transplant recipients on standard immunosuppressive regimens. T cell repertoire turnover due to lymphocyte-depleting conditioning only partially accounted for the observed reductions in tolerant patients; in fact, conventional transplant recipients showed expansion of circulating donor-reactive clones, despite extensive repertoire turnover. Moreover, loss of donor-reactive T cell clones more closely associated with tolerance induction than in vitro functional assays. Our analysis supports clonal deletion as a mechanism of allograft tolerance in CKBMT patients. The results validate the contribution of donor-reactive T cell clones identified before transplant by our method, supporting further exploration as a potential biomarker of transplant outcomes.


Figures

Fig. 1
Fig. 1. Mixed lymphocyte reaction experimental design and schematic of TCR sequencing analysis strategy to identify and track donor-reactive T cells
A. CD3+Violet- cells, representing the responder T cells, were selected and further separated into CD4+ and CD8+ subgroups. Within each subgroup, the CFSE-low cells were isolated for DNA extraction and TCRβ CDR3 deep sequencing. Sorting strategy is indicated with boxes on the dot plots and bars on the histograms; CFSE staining in unstimulated control sample shown in Fig. S1A. B. Pre-transplant “fingerprint” of anti-donor T cell repertoire defined as all clones detected at a frequency greater than 10^−4 in the stimulated condition (CFSE-low cells in MLR) that have expanded at least 5-fold relative to their frequency in the unstimulated T cell population (unstimulated repertoire defined via TCR sequencing of CD3+CD4+ or CD3+CD8+ T cells isolated via FACS sorting of PBMCs from the same sample used for the CFSE-MLR). Each donor-reactive clone identified by its unique CDR3 nucleotide sequence could then be tracked in post-transplant unstimulated peripheral blood samples.
Fig. 2
Fig. 2. Overlap of the alloreactive T cell repertoire via TCR sequencing in repeat MLR assays in healthy controls
A. Top panel: linear correlation of log frequencies of alloreactive clones detected in MLRs performed at time point 1 [stimulated (T1)] and time point 2 [stimulated (T2)] for Healthy Control (HC) #1 from blood draws separated by a two-week interval. Second panel from top: no such correlation is observed when clonal frequencies in the stimulated populations are plotted against frequencies in the unstimulated population [unstimulated (T1)]; high frequency clones in the unstimulated populations highlighted in yellow. These results are representative of similar analyses in HC#2 and HC#3 (Fig. S1D). Bottom two panels: linear correlation persists in MLRs performed from blood draws separated by a year interval (HC#2, HC#3). Same allogeneic stimulator for each HC at T1 and T2. Overlapping number of sequences detected: HC#1 T1 & T2 stim CD4 = 2944, CD8 = 465; HC#1 T1 stim & T1 unstim: CD4 = 3011, CD8 = 478; HC#2 T1 & T2 stim: CD4 =1162, CD8 = 642. HC#3 T1 & T2 stim: CD4 =2850, CD8 = 652. B. Pie charts showing relative overlap of the summed frequencies of alloreactive clones (“fingerprint” as defined in Figure 1) over time in three healthy controls. Each circle represents the cumulative frequency of all alloreactive clones identified in the sample; red segment shows the percentage of that total frequency arising from alloreactive clones identified at both T1 and T2 (tabulated values Table S2). C. Boxplot comparing the clonality of the unstimulated CD4 and CD8 T cell repertoires (* P = 0.0062, n = 5, two-tailed paired t test; tabulated values Table S1). D. Cumulative frequencies of all alloreactive clones for each pair of stimulated and unstimulated HC at all time points. Stim = stimulated; unstim = unstimulated; HC = healthy control.
Fig. 3
Fig. 3. Clinical course, tracking of donor-reactive T cell clones, MLR, and CML results in CKBMT subjects
A. Overview of clinical course. B. Number of donor-reactive TRB CDR3 clones (y-axis) detected in the unstimulated CD4 (black) and CD8 (white) repertoire at the indicated time points (x-axis). The “fingerprint” of the anti-donor T cell repertoire was defined for each subject as clones in the pre-transplant MLR with ≥10−4 frequency that were expanded at least 5-fold relative to their frequency in the pre-transplant unstimulated sample (total number indicated above the relevant panel). Sufficient power was obtained to consider a frequency of 10−5 as detectable in all unstimulated populations for Subjects 1, 2, 4, and 5×10⁻⁵ for Subject 5. * P < 0.05 compared to pre-transplant (P-values Table S4; two-sided Fisher’s exact test). C. MLR: proliferative responses to recipient (anti-self), donor (anti-donor) and third party (anti-3rd party) relative to proliferation of unstimulated PBMCs are shown at the indicated time points. Each bar represents the mean ±SD stimulation index of triplicate cultures. D. CML: responses at the indicated time points are shown. MLR and CML data have been previously summarized in Kawai et al. (8).
Fig. 4
Fig. 4. Tracking of donor-reactive T cell clones in “conventional” kidney transplant recipients and summary of clonal analysis results for all six subjects
A. Clinical course and number of donor-reactive TRB CDR3 clones (y-axis) detected in the unstimulated CD4 (black) and CD8 (white) repertoire at the indicated time points (x-axis). Sufficient power was obtained to consider a frequency of 10−5 as detectable in all unstimulated populations for IS#1 and 5×10⁻⁵ for IS#2. * P < 0.05 compared to pre-transplant (P-values Table S4; two-sided Fisher’s exact test). B. Change over time in detection of unstimulated T cell populations of donor-reactive CD4 and CD8 clones (defined in Fig. 3B legend). Fold change is the odds ratio of the number of donor-reactive clones detected in unstimulated post-transplant CD4 and CD8 populations relative to the number detected in unstimulated pre-transplant populations (pre-transplant = 1). Open symbol = statistically significant reduction or increase (P-value < 0.05). Tabulated results in Tables S4 and S5.
Fig. 5
Fig. 5. TCR repertoire turnover in kidney allograft recipients
A. Jensen-Shannon Divergence (JSD) comparing pre- and post-transplantation (last post-transplantation time point) TCR repertoires. JSD on top 1000 nucleotide clones ranked by frequency (0 denotes identical repertoires; 1 denotes complete repertoire divergence). Healthy controls: average JSD on top 1000 nucleotide clones of two healthy controls in whom TCR sequencing was performed at two time points 1 year apart. B. Anti-donor CD4 and CD8 clonal analysis relative to overall repertoire turnover. Relative numbers of donor-reactive (as defined in Fig. 3B legend) vs non-donor-reactive clones (all other clones detected in unstimulated pre-transplant sample) detected at any level (threshold detection of assay 10−6) in post-transplant samples. Relative change is the odds ratio of the relative (post/pre) number of donor-reactive clones divided by the relative (post/pre) number of non-donor-reactive clones in unstimulated samples at the same time. A value of “1” indicates that the proportion of donor-reactive clones (defined pre-transplant as above) detected at a given timepoint was equal to that of all clones (detected pre-transplant) detected at the same timepoint. A value <1 indicates lower rate of detection of donor-reactive vs all clones and a value >1 indicates greater rate of detection of donor-reactive vs all clones. Open symbols = statistically significant reduction or increase (P-value < 0.05; two-sided Fisher’s exact test); tabulated data and P-values in Table S7. C. Anti-donor CD4 and CD8 clonal analysis relative to overall repertoire turnover in Subject 1: effect of varying definition of donor reactivity by different fold-expansion criteria (frequency in pre-transplant anti-donor MLR/frequency in unstimulated pre-transplant sample >5, 7, or 10). Red points are statistically significant (p < 0.05); tabulated data and P-values in Table S9.
Fig. 6
Fig. 6. Recovery of CD4 repertoire diversity in tolerant recipients
(A) CD4 T cell repertoire diversity (measured by Simpson’s Index D) over time after transplantation (D of “1” indicates that all clones are identical; smaller D indicates clones are more unique and therefore the repertoire is more diverse). (B) Comparison of CD4 Simpson’s Index (D) in tolerant (Subjects 1, 2, and 4) and nontolerant (Subjects 5, IS#1, and IS2) subjects near 1 year after transplant (10 months: IS#2; 12 months: Subjects, 2, 4, and IS#1; 14 months: subject 5; 18 months: subject 1). * P = 0.017; two-sided Student’s t test on logarithm of D (n = 6).

Comment in

Similar articles

Cited by

References

    1. Fehr T, Sykes M. Tolerance induction in clinical transplantation. Transplant immunology. 2004;13:117–130. - PubMed
    1. Lamb KE, Lodhi S, Meier-Kriesche HU. Long-term renal allograft survival in the United States: a critical reappraisal. American journal of transplantation. 2011;11:450–462. - PubMed
    1. Brouard S, Le Bars A, Dufay A, Gosselin M, Foucher Y, Guillet M, Cesbron-Gautier A, Thervet E, Legendre C, Dugast E, Pallier A, Guillot-Gueguen C, Lagoutte L, Evanno G, Giral M, Soulillou JP. Identification of a gene expression profile associated with operational tolerance among a selected group of stable kidney transplant patients. Transpl Int. 2011;24:536–547. - PubMed
    1. Cippa PE, Fehr T. Spontaneous tolerance in kidney transplantation--an instructive, but very rare paradigm. Transpl Int. 2011;24:534–535. - PubMed
    1. Fudaba Y, Spitzer TR, Shaffer J, Kawai T, Fehr T, Delmonico F, Preffer F, Tolkoff-Rubin N, Dey BR, Saidman SL, Kraus A, Bonnefoix T, McAfee S, Power K, Kattleman K, Colvin RB, Sachs DH, Cosimi AB, Sykes M. Myeloma responses and tolerance following combined kidney and nonmyeloablative marrow transplantation: in vivo and in vitro analyses. American journal of transplantation. 2006;6:2121–2133. - PubMed

Publication types

MeSH terms

Substances