. 2015 Jan 28;35(4):1354-67.
doi: 10.1523/JNEUROSCI.1418-14.2015.

Visual landmark information gains control of the head direction signal at the lateral mammillary nuclei

Affiliations

Visual landmark information gains control of the head direction signal at the lateral mammillary nuclei

Ryan M Yoder et al. J Neurosci. .

Abstract

The neural representation of directional heading is conveyed by head direction (HD) cells located in an ascending circuit that includes projections from the lateral mammillary nuclei (LMN) to the anterodorsal thalamus (ADN) to the postsubiculum (PoS). The PoS provides return projections to LMN and ADN and is responsible for the landmark control of HD cells in ADN. However, the functional role of the PoS projection to LMN has not been tested. The present study recorded HD cells from LMN after bilateral PoS lesions to determine whether the PoS provides landmark control to LMN HD cells. After the lesion and implantation of electrodes, HD cell activity was recorded while rats navigated within a cylindrical arena containing a single visual landmark or while they navigated between familiar and novel arenas of a dual-chamber apparatus. PoS lesions disrupted the landmark control of HD cells and also disrupted the stability of the preferred firing direction of the cells in darkness. Furthermore, PoS lesions impaired the stable HD cell representation maintained by path integration mechanisms when the rat walked between familiar and novel arenas. These results suggest that visual information first gains control of the HD cell signal in the LMN, presumably via the direct PoS → LMN projection. This visual landmark information then controls HD cells throughout the HD cell circuit.

Keywords: landmark; mammillary; navigation; rat; spatial orientation; visual.


Figures

Figure 1.
Figure 1.
HD cell recording procedure. A, The rotation procedure was conducted in a cylindrical arena containing a white polarizing cue card. HD cells were recorded across five consecutive sessions: (1) standard; (2) rotation; (3) standard; (4) darkness; and (5) standard. B, The dual-chamber apparatus allowed assessment of HD cell activity as rats walked from a familiar arena (standard cylinder) to a novel rectangular arena, as well as during the rats' return to the familiar arena.
Figure 2.
Figure 2.
Histological verification of electrode position. Electrode tracks (arrows) were present in the LMN (dashed line). Scale bar, 1.0 mm.
Figure 3.
Figure 3.
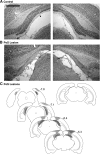
Histological reconstruction of PoS lesion. A, B, Coronal sections showing the PoS from a control rat (A) and a PoS-lesioned rat (B). NMDA injection into the PoS produced extensive damage to the PoS ipsilateral (left) and contralateral (right) to the recording site in the LMN. Arrowheads depict boundaries of the PoS. Scale bar, 1.0 mm. Approximate location of images is depicted in the inset diagram, 6.4 mm caudal to bregma. C, Diagram of the lesion area after NMDA injection into the PoS. Light gray represents the most extensive damage, and dark gray represents the least extensive damage. Diagram sections are labeled with approximate rostrocaudal distance from bregma (recreated from Kjonigsen et al., 2011).
Figure 4.
Figure 4.
HD cell stability during the first standard recording sessions. A, Left, HD cells in control rats remained relatively stable, although the preferred firing direction drifted slightly for most cells. Right, HD versus firing rate tuning curve for the depicted cell. B, Left, HD cells in PoS-lesioned rats showed greater drift in their preferred firing directions than those in control rats. Right, Tuning curve for the depicted cell. C, Preferred firing direction shift between the first 2 min and last 2 min of the recording session. D, Preferred firing direction drift values for all cells in control and PoS-lesioned animals. For C and D, there were no significant differences in the mean values between control and PoS-lesioned animals. Although the PoS-lesioned animals appeared to display more variability on both measures compared with controls, the differences were not significant. Note that absolute drift values were used for statistical analyses.
Figure 5.
Figure 5.
Stability and visual cue control of the preferred firing direction. A, Representative tuning curves from HD cells recorded from control and PoS-lesioned rats during sessions 1–3 and 5. The cue card was in the same position for sessions 1, 3, and 5; for session 2, the cue card was rotated 90° CW. The HD cell recorded from a control animal (left) shifted in the same direction as the cue card but showed a slight under-rotation. In contrast, the cell recorded from a PoS-lesioned animal (right) shifted 84° in the opposite direction of the rotated cue card. Numbers indicate the angular shift of the preferred firing direction relative to session 1. B–D, Angular preferred firing direction shifts, in polar coordinates, between standard recording sessions (sessions 1, 3, and 5) with the lights on and cue card in the 3:00 position. HD cells in control rats showed little preferred firing direction shift across standard recording sessions, whereas the shifts of HD cells in PoS-lesioned rats were uniformly distributed for session 1 versus session 3, session 1 versus session 5, and session 3 versus session 5. Gray data points represent cells recorded from animals with cortex lesions. E, HD cell responses to a 90° cue rotation, with values adjusted to depict preferred firing direction shifts on the same scale, whether the cue card was rotated CW or CCW. Most HD cells in control rats showed a slight under-rotation of preferred firing direction. In contrast, cells from PoS-lesioned rats showed a uniform distribution of preferred firing direction shifts.
Figure 6.
Figure 6.
HD cell stability during dark recording sessions. A, Left, HD cells in control rats remained relatively stable in darkness, although the preferred firing direction drifted slightly for most cells. Right, Tuning curve for the cell depicted. B, Left, Some HD cells in PoS-lesioned rats became unstable and showed considerable preferred firing direction drift during the dark recording session. Right, Tuning curve for the cell depicted, indicating drift of preferred firing direction. C, Preferred firing direction shift between the first 2 min and last 2 min of the recording session. D, Preferred firing direction drift values for all cells in control and PoS-lesion animals. Note that absolute drift values were used for statistical analyses. Gray data points represent cells recorded from animals with cortex lesions.
Figure 7.
Figure 7.
Preferred firing direction shift in the dual-chamber apparatus. A, HD cells in control rats showed a slight CW shift when the animal walked from the standard cylinder to the novel rectangle, in which the cue card was rotated 90° CCW relative to the cylinder. In contrast, HD cells in PoS-lesioned rats shifted slightly CCW. B, HD cells in both control and PoS-lesioned rats realigned when the animal returned to the cylinder, although the PoS-lesioned group showed slightly (nonsignificant) greater variability. Gray points represent ADN cells described previously (Taube and Burton, 1995).
Figure 8.
Figure 8.
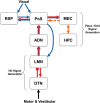
Working model of visual, motor, and vestibular information flow through the HD cell circuit. The HD signal (red arrows) is generated within the reciprocal connections between the dorsal tegmental nuclei (DTN) and the LMN based on self-movement information arriving from subcortical motor and vestibular systems (black arrow). In familiar visual environments, the PoS receives visual landmark information (blue arrows) from visual areas and retrosplenial cortex (RSP) and provides this information to HD cells in the LMN, in which it is integrated with self-movement information about angular head movements. From the LMN, the integrated HD signal ascends to the ADN and then to the PoS. The PoS projects the HD signal and possible additional visual landmark information to the RSP and MEC, in which it is integrated with information from the grid cell signal, as well as the place cell signal from the hippocampus (HPC; dashed orange arrow). Place and grid cell signals may influence the HD signal via projections from the MEC or hippocampus (solid orange arrow). Note that not all connections are shown.

References

    1. Aggleton JP, Keen S, Warburton EC, Bussey TJ. Extensive cytotoxic lesions involving both the rhinal cortices and area TE impair recognition but spare spatial alternation in the rat. Brain Res Bull. 1997;43:279–287. doi: 10.1016/S0361-9230(97)00007-5. - DOI - PubMed
    1. Batschelet E. Circular statistics in biology. New York: Academic; 1981.
    1. Biazoli CE, Jr, Goto M, Campos AM, Canteras NS. The supragenual nucleus: a putative relay station for ascending vestibular signs to head direction cells. Brain Res. 2006;1094:138–148. doi: 10.1016/j.brainres.2006.03.101. - DOI - PubMed
    1. Blair HT, Sharp PE. Anticipatory head direction signals in anterior thalamus: evidence for a thalamocortical circuit that integrates angular head motion to compute head direction. J Neurosci. 1995;15:6260–6270. - PMC - PubMed
    1. Blair HT, Lipscomb BW, Sharp PE. Anticipatory time intervals of head-direction cells in the anterior thalamus of the rat: implications for path integration in the head-direction circuit. J Neurophysiol. 1997;78:145–159. - PubMed

Publication types

MeSH terms

Substances