. 2015 Jan 28;35(4):1692-705.
doi: 10.1523/JNEUROSCI.3160-14.2015.

Neural correlates of object-associated choice behavior in the perirhinal cortex of rats

Affiliations

Neural correlates of object-associated choice behavior in the perirhinal cortex of rats

Jae-Rong Ahn et al. J Neurosci. .

Abstract

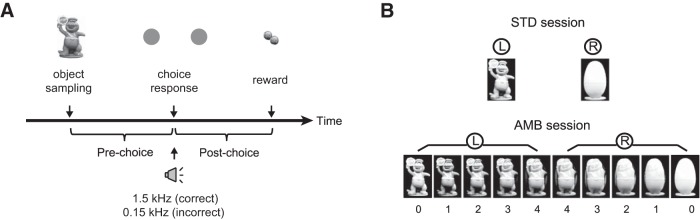
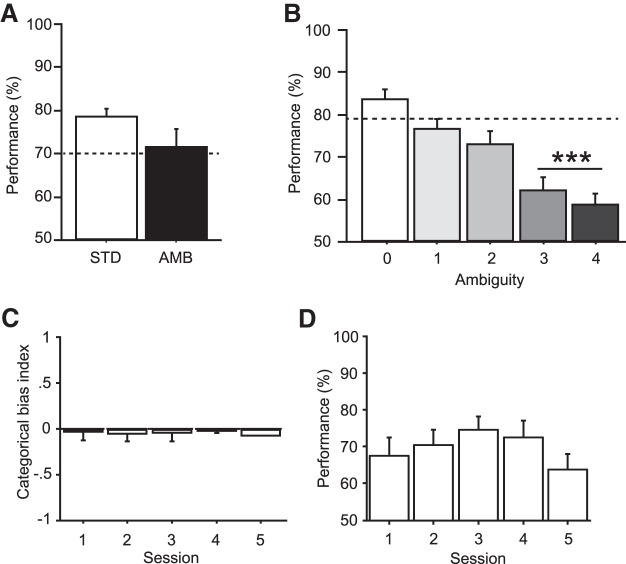
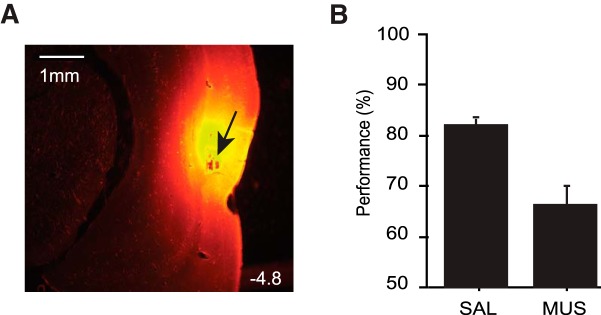
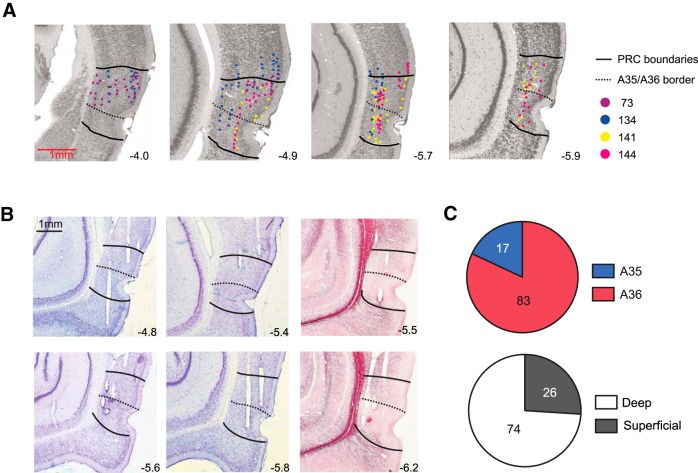
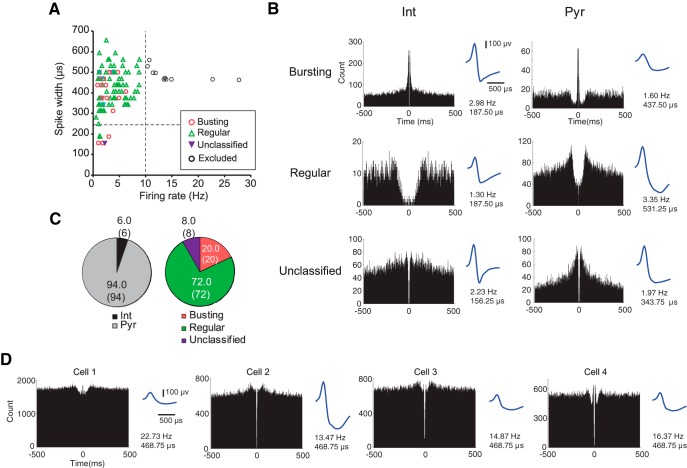
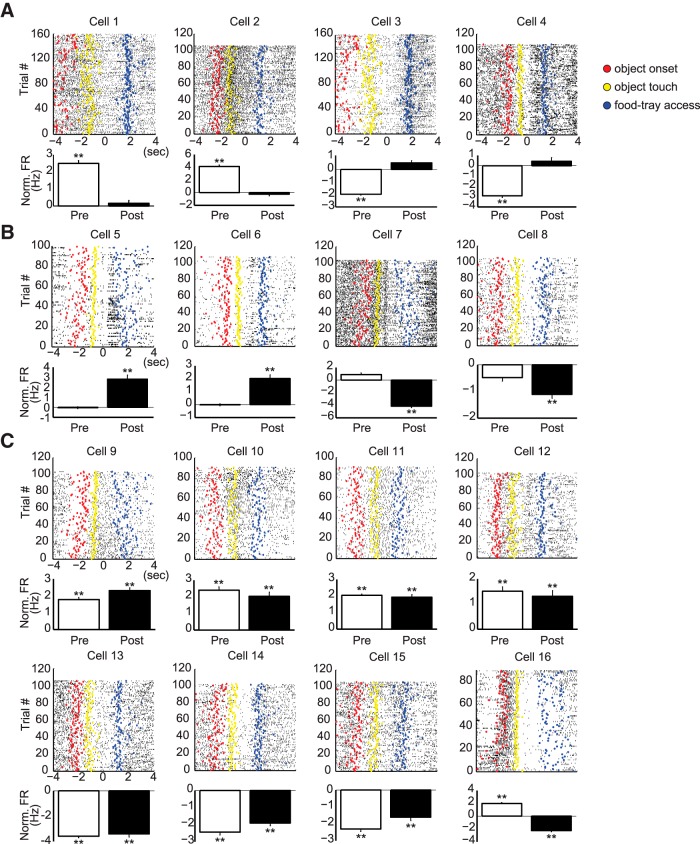
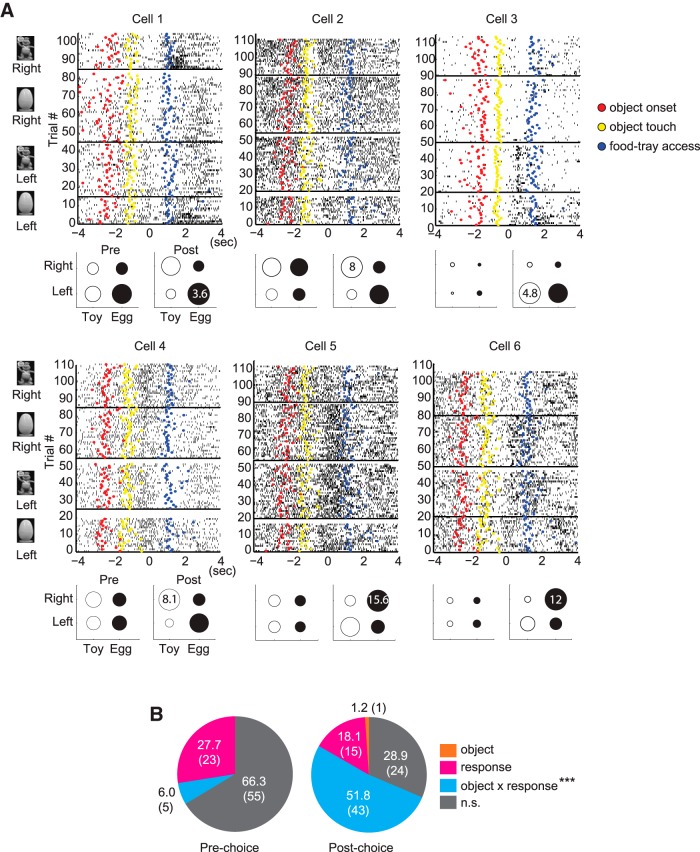
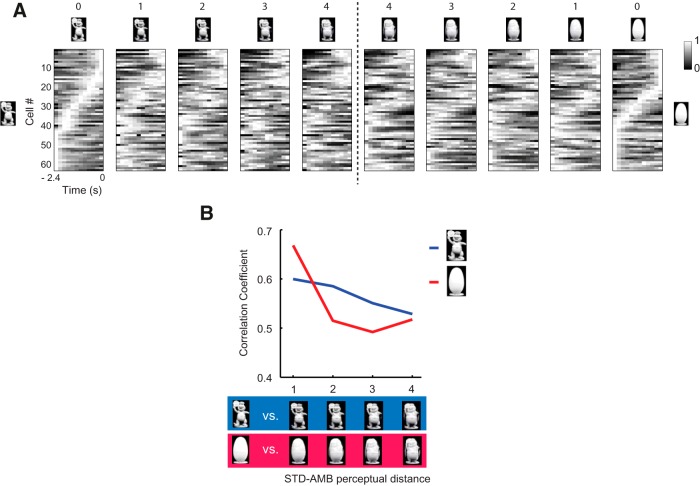
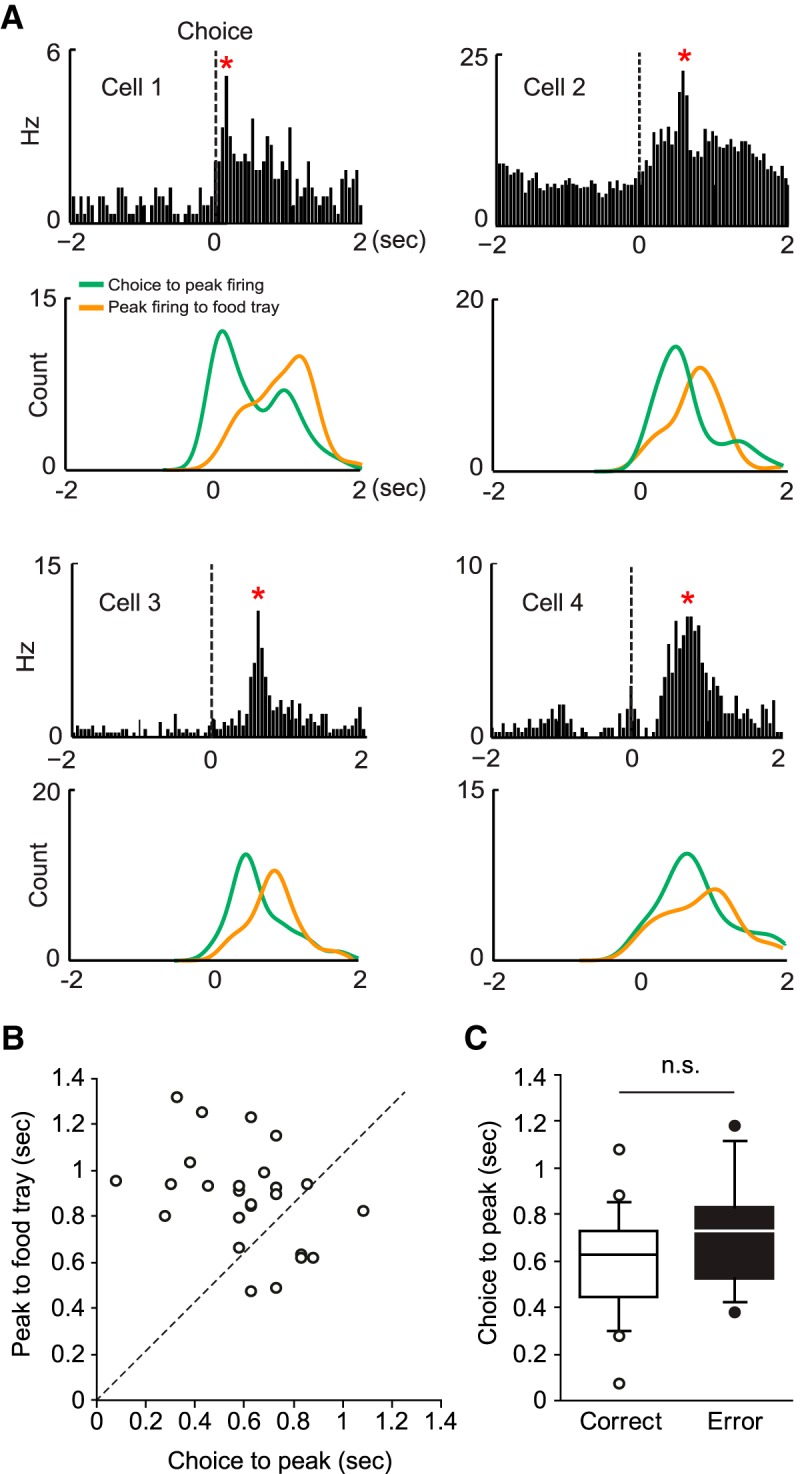
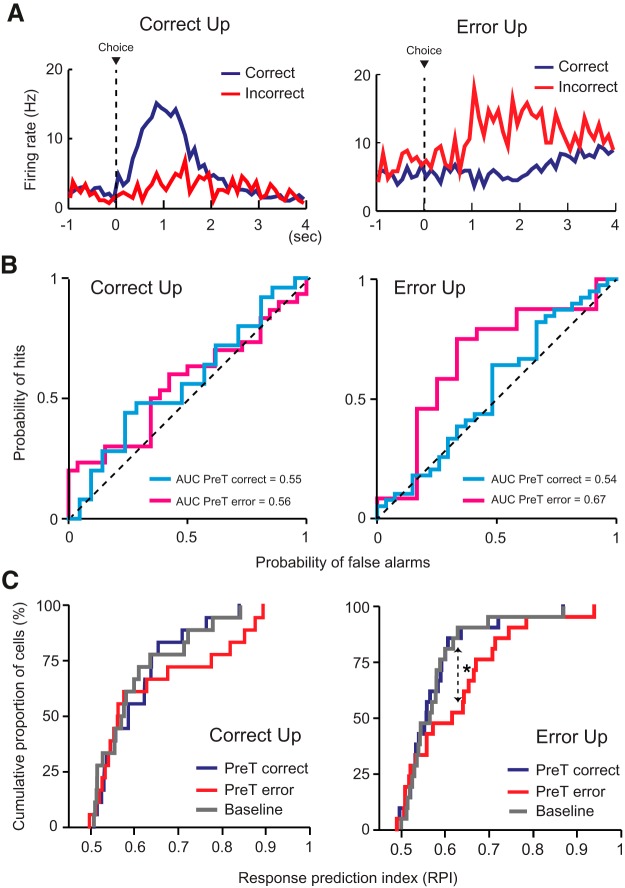
The perirhinal cortex (PRC) is reportedly important for object recognition memory, with supporting physiological evidence obtained largely from primate studies. Whether neurons in the rodent PRC also exhibit similar physiological correlates of object recognition, however, remains to be determined. We recorded single units from the PRC in a PRC-dependent, object-cued spatial choice task in which, when cued by an object image, the rat chose the associated spatial target from two identical discs appearing on a touchscreen monitor. The firing rates of PRC neurons were significantly modulated by critical events in the task, such as object sampling and choice response. Neuronal firing in the PRC was correlated primarily with the conjunctive relationships between an object and its associated choice response, although some neurons also responded to the choice response alone. However, we rarely observed a PRC neuron that represented a specific object exclusively regardless of spatial response in rats, although the neurons were influenced by the perceptual ambiguity of the object at the population level. Some PRC neurons fired maximally after a choice response, and this post-choice feedback signal significantly enhanced the neuronal specificity for the choice response in the subsequent trial. Our findings suggest that neurons in the rat PRC may not participate exclusively in object recognition memory but that their activity may be more dynamically modulated in conjunction with other variables, such as choice response and its outcomes.

Keywords: goal-directed task; object association; object recognition memory; perirhinal cortex; spatial memory.


Figures

Figure 1.
Figure 1.
OCSC task. A, Schematic illustration of sequential events in a trial (object sampling, choice response, and reward). Reward was provided only in correct trials. Using the choice moment as a reference, a trial was divided into a pre-choice and a post-choice period. Tones of different frequencies were delivered upon the choice response to offer feedback for the accuracy of the choice. B, Object stimuli used in the task. Two objects (toy and egg) were used for standard object (STD) sessions. L and R indicate the correct disc choices associated with the objects. For ambiguity (AMB) sessions, the two original objects were morphed into one another to yield 10 different objects. Numbers below the images indicate perceptual ambiguity levels (0 to 4 indicating no ambiguity to the highest ambiguity). The rat was required to make a categorical response to the morphed object to obtain a reward on the basis of the learned associations between the original objects and discs.
Figure 2.
Figure 2.
Behavioral performance. A, Performance during standard (STD) and ambiguity (AMB) sessions. The performance decreased by ∼10% in the AMB sessions compared with the STD sessions. Dotted line indicates presurgical performance criterion for surgery (70%). B, Performance as a function of ambiguity level (0 lowest, 4 highest). The behavioral performance decreased as the ambiguity level increased. The performance significantly decreased in the high ambiguity conditions (level 3–4) compared with the STD session (dotted line). ***p < 0.0001. C, The object-categorical bias indices were averaged across animals and plotted as a function of sessions. Overall, no significant bias was found toward a particular object category in any of the sessions. D, There was no significant effect of learning across sessions in the AMB sessions. Because only one rat performed on day 5, the analysis was conducted on data obtained from days 1–4 only. Data are mean ± SEM.
Figure 3.
Figure 3.
Impairment in performance upon the inactivation of the PRC. A, A representative photomicrograph of tissue injected with fluorescent MUS. Note the localized spread of MUS in the PRC. The number on the right bottom corner indicates the distance (mm) from bregma. B, PRC inactivation affects the performance in the OCSC task compared to the SAL injection condition. Data are mean ± SEM.
Figure 4.
Figure 4.
Histological verification of tetrode positions and the number of neurons recorded from the PRC. A, The histological sections containing the PRC were obtained from an online atlas (http://cmbn-approd01.uio.no/zoomgen/hippocampus/home.do). Using those online images as templates, the locations of individual tetrodes were marked with dots (color-coded for different animals). Regional boundaries of the PRC (solid lines) and its subfields A36 and A35 (dotted lines) were demarcated based on the online atlas and the standard atlas (Paxinos and Watson, 2007). Numbers indicate the relative positions (mm) of the sections from bregma. B, Representative histological sections with tetrode tracks. First and second columns show Nissl-stained tissues. Third column shows myelin-stained sections. C, Pie charts for showing the number of units in different subregions in the PRC. Only units that satisfied the unit-isolation criteria and were used in the final analyses are shown. Top, A35 and A36. Bottom, deep and superficial layers.
Figure 5.
Figure 5.
Classification of PRC neurons. A, A scattergram showing the relationships between the average firing rate and the average spike width (peak-to-trough) of PRC units recorded in the current study. Vertical dashed line indicates the criterion level of firing (10 Hz). Ten units were eliminated based on the criteria (black circles). Horizontal dashed line indicates the cutoff point of a spike width (250 μs) that separated putative interneurons and pyramidal neurons. B, Representative autocorrelograms (time window = ±500 ms, bin size = 1 ms) drawn for putative interneurons (Int, left) and pyramidal neurons (Pyr, right) in the PRC. Shown on the right of each autocorrelogram is the averaged waveform of a neuron. The mean firing rate and spike width of a neuron were indicated below the waveform. On the basis of the autocorrelogram characteristics, cells were classified into bursting (top), regular (middle), and unclassified (bottom) neurons. C, Pie charts showing the percentage of PRC units categorized into putative interneurons and pyramidal neurons based on the spike width criterion (left), and the percentage of neurons categorized based on autocorrelograms (right). The number in the parentheses indicates the number of units. D, Examples of the autocorrelograms and waveforms of the PRC units excluded from the main analysis due to high firing rates (>10 Hz).
Figure 6.
Figure 6.
Choice event-related neuronal modulations in the PRC. A–C, Raster plots (top) and normalized mean firing rates (bottom) of representative neurons in the PRC showing the firing patterns in the pre-choice and post-choice periods. For each cell, individual spikes were aligned with the occurrence of the choice event. Colored dots in the raster represent the major events of the object-cued spatial choice task: red represents object onset; yellow represents object touch; blue represents food-tray access. Neuronal activity in the PRC was significantly modulated relative to that of the baseline (1 s before the object onset) in the pre-choice period (A), post-choice period (B), or both (C). **p < 0.01. The firing rates associated with the event periods were normalized by subtracting the baseline firing rates.
Figure 7.
Figure 7.
PRC neurons represent choice response and the object-choice contingency. A, The raster plots were sorted according to four different object-choice contingencies (denoted by the object images and the responses on the left side of the raster plot). Bubble chart below the raster plot represents the relative response strengths of a neuron for different trial conditions. The number in a circle indicates the mean firing rate of the trial condition in which the maximal cell firing of the neuron was observed. The sizes of the other circles are scaled in proportion to the maximal discharge rate. B, Pie charts showing the percentage of neurons in the PRC that respond significantly to the major task-related factors, such as object and spatial response factors, in the pre-choice and post-choice event periods. Numbers in parentheses indicate the number of cells. The proportion of PRC neurons with a significant interaction effect between object and choice response factors significantly increased in the post-choice period compared with the pre-choice period. ***p < 0.0001. n.s., Not significant.
Figure 8.
Figure 8.
Effects of perceptual ambiguity on the response of the PRC neuronal population in the pre-choice period. A, The population rastergram was constructed from all active PRC neurons before the choice event for each object condition (time bin = 200 ms). The temporal bin associated with the highest firing rate was represented by using the lightest color. The cells were ordered according to the maximal firing location in the standard object condition for each object category. The number above each stimulus indicates the level of ambiguity. Vertical dotted line indicates the border between the two object categories. The temporal firing patterns in the neuronal population were disrupted as ambiguity increased in both object categories. B, Pearson's correlation coefficients were calculated between the population rastergram associated with the STD object and each of the four rastergrams associated with its morphed AMB objects (levels 1–4) in each category.
Figure 9.
Figure 9.
Activity of PRC neurons in the post-choice period conveys trial outcome-related signals. A, The firing-rate distribution of a neuron in the PRC is shown (top) 2 s before and after the choice responses (dashed line). *Time bin in which the maximal firing rate was observed. Shown below is the histogram of the latency from the choice response to the peak-firing rate (green) and of the latency from peak firing to the food-tray entry (orange). Four representative neurons were chosen to show that the post-choice firing peaks were more closely related to the choice responses than to the food-tray entries. B, The distribution of the medians of the temporal locations of the firing peaks with reference to the time points associated with the two events (choice response to peak firing and peak firing to food-tray access), illustrated in a scatter plot. The PRC units fired maximally closer to the choice event (x-axis) than to the food-tray entry event (y-axis). Dashed line indicates the points where the peak-firing location maintains equal distances from the two events. C, Similar choice-to-peak latencies were observed in cells showing a peak firing following a correct response and those following an error. n.s., Not significant.
Figure 10.
Figure 10.
Error choice-related feedback signal in the post-choice period significantly affects the upcoming choice-related signals in the PRC. A, Representative examples of the spike density plots of the correct-up cells (left) and error-up cells (right) in the PRC. The correct-up cells exhibited an elevated firing response when correct choices were made compared with when errors were made, whereas the opposite was true for the error-up cells. B, Representative ROC curves for the two types of outcome-selective neurons (correct-up and error-up cells). ROC curves were generated based on the firing-rate distributions associated with the choice responses (choices for the left and right discs). Each point of the ROC curve indicates the probability of neuronal spiking activity in a given trial being correctly assigned to one of the choice distributions (“hits”) versus incorrectly assigned (“false alarms”). For the correct-up cells, the AUCs of the ROC curves were similar regardless of the presence of the neuronal feedback received from the previous trial. By contrast, the AUC of the error-up cells was higher when feedback was received from the previous trial. C, The RPI was obtained for each outcome-selective neuron by averaging across the bootstrapped AUCs (1000 iterations). In the correct-up cells, the RPI was similar regardless of whether the choice in the previous trial was correct (PreT-correct) or incorrect (PreT-error). In the error-up neurons, the RPI was higher in trials for which the previous choices resulted in errors (PreT-error). *p < 0.05.

References

    1. Aggleton JP, Keen S, Warburton EC, Bussey TJ. Extensive cytotoxic lesions involving both the rhinal cortices and area TE impair recognition but spare spatial alternation in the rat. Brain Res Bull. 1997;43:279–287. doi: 10.1016/S0361-9230(97)00007-5. - DOI - PubMed
    1. Allen TA, Narayanan NS, Kholodar-Smith DB, Zhao Y, Laubach M, Brown TH. Imaging the spread of reversible brain inactivations using fluorescent muscimol. J Neurosci Methods. 2008;171:30–38. doi: 10.1016/j.jneumeth.2008.01.033. - DOI - PMC - PubMed
    1. Barthó P, Hirase H, Monconduit L, Zugaro M, Harris KD, Buzsáki G. Characterization of neocortical principal cells and interneurons by network interactions and extracellular features. J Neurophysiol. 2004;92:600–608. doi: 10.1152/jn.01170.2003. - DOI - PubMed
    1. Bartko SJ, Winters BD, Cowell RA, Saksida LM, Bussey TJ. Perceptual functions of perirhinal cortex in rats: zero-delay object recognition and simultaneous oddity discriminations. J Neurosci. 2007;27:2548–2559. doi: 10.1523/JNEUROSCI.5171-06.2007. - DOI - PMC - PubMed
    1. Baxter MG. Involvement of medial temporal lobe structures in memory and perception. Neuron. 2009;61:667–677. doi: 10.1016/j.neuron.2009.02.007. - DOI - PubMed

Publication types

MeSH terms

LinkOut - more resources