. 2015 Jan 28;35(4):1739-52.
doi: 10.1523/JNEUROSCI.1714-14.2015.

Neural cell adhesion molecule 2 promotes the formation of filopodia and neurite branching by inducing submembrane increases in Ca2+ levels

Affiliations

Neural cell adhesion molecule 2 promotes the formation of filopodia and neurite branching by inducing submembrane increases in Ca2+ levels

Lifu Sheng et al. J Neurosci. .

Abstract

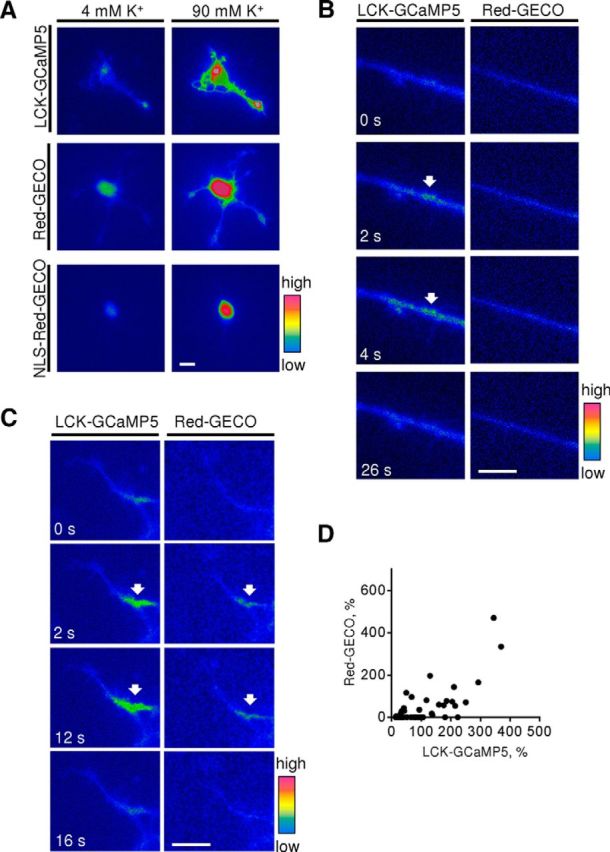
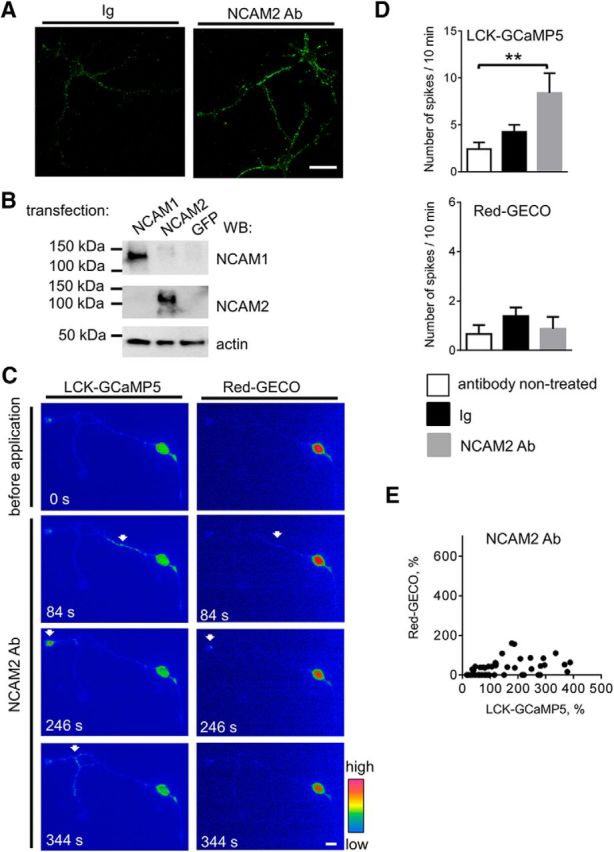
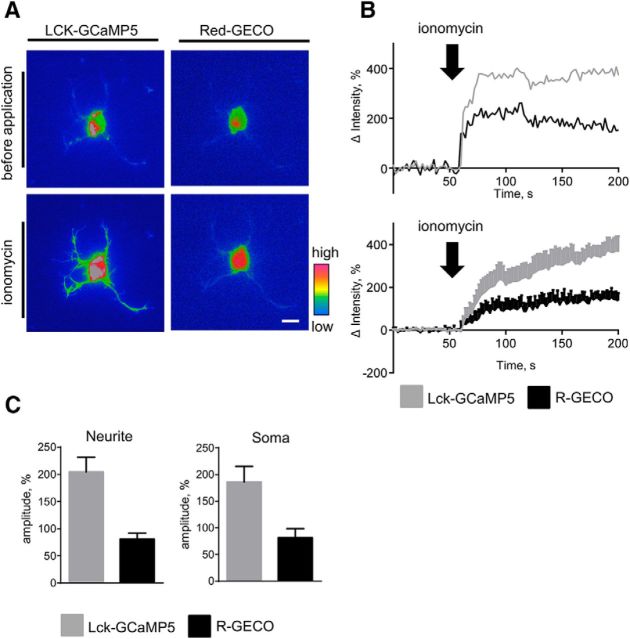
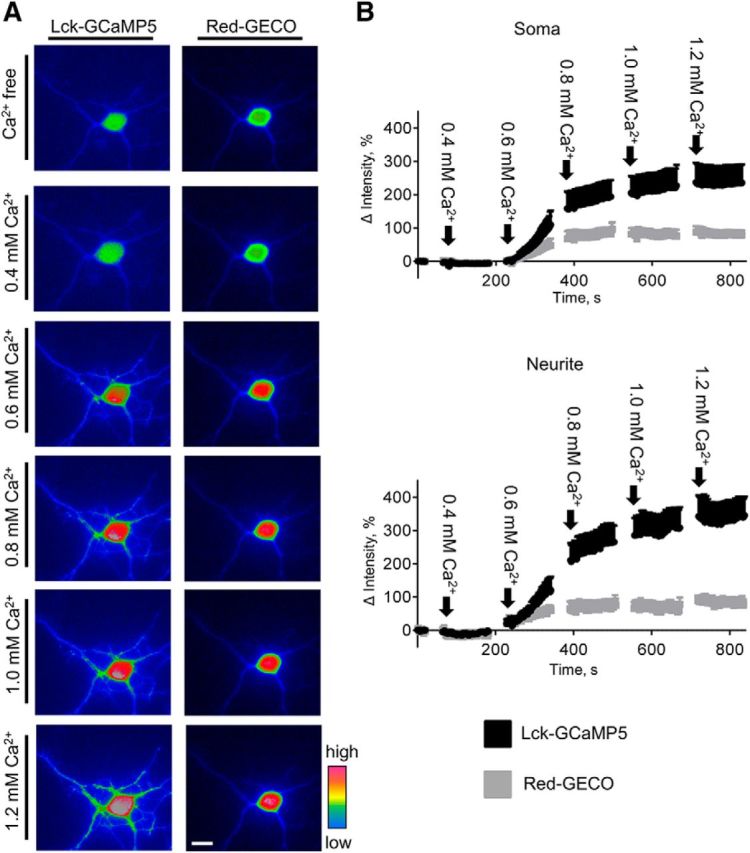
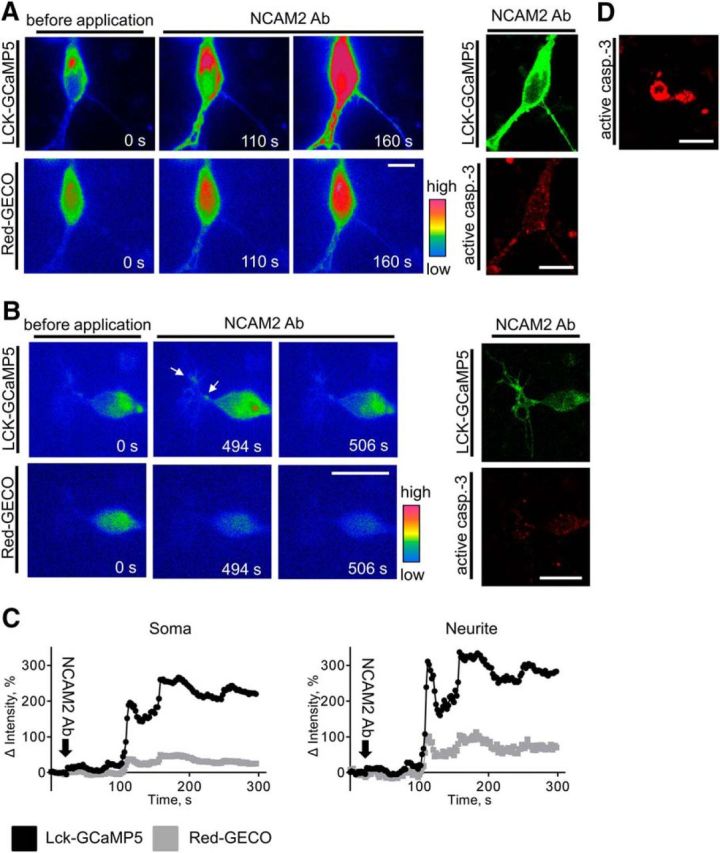
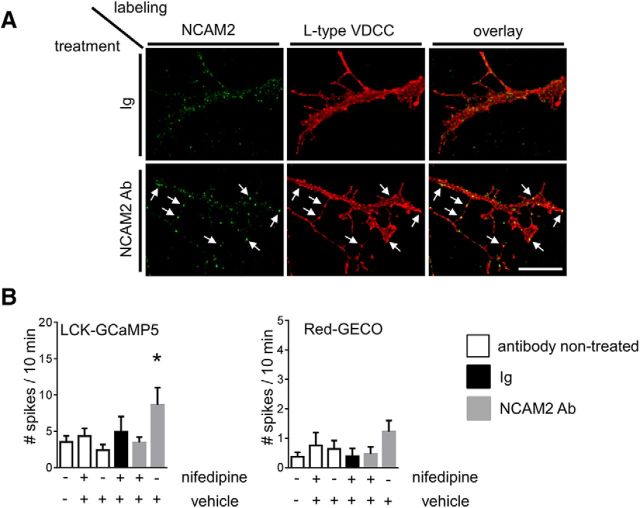
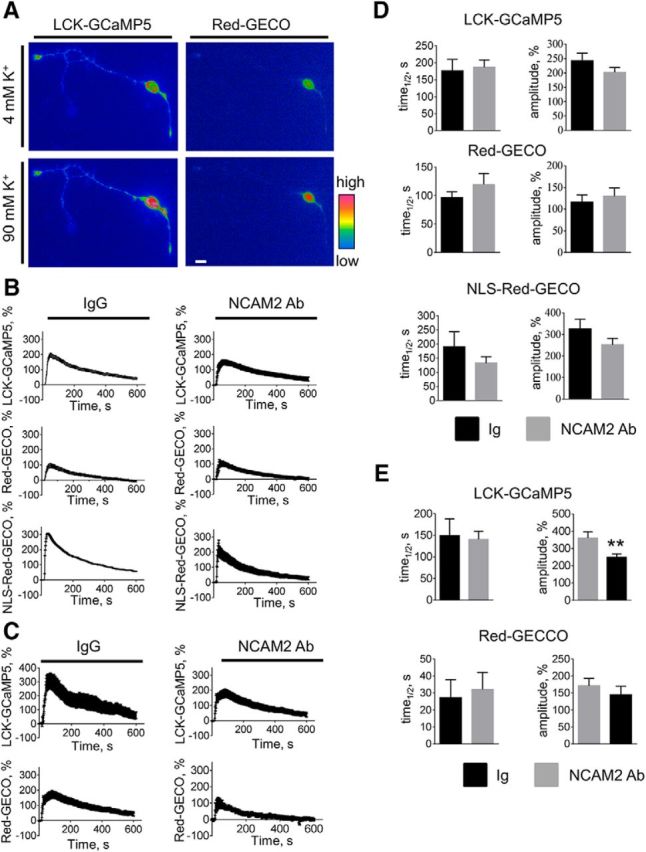
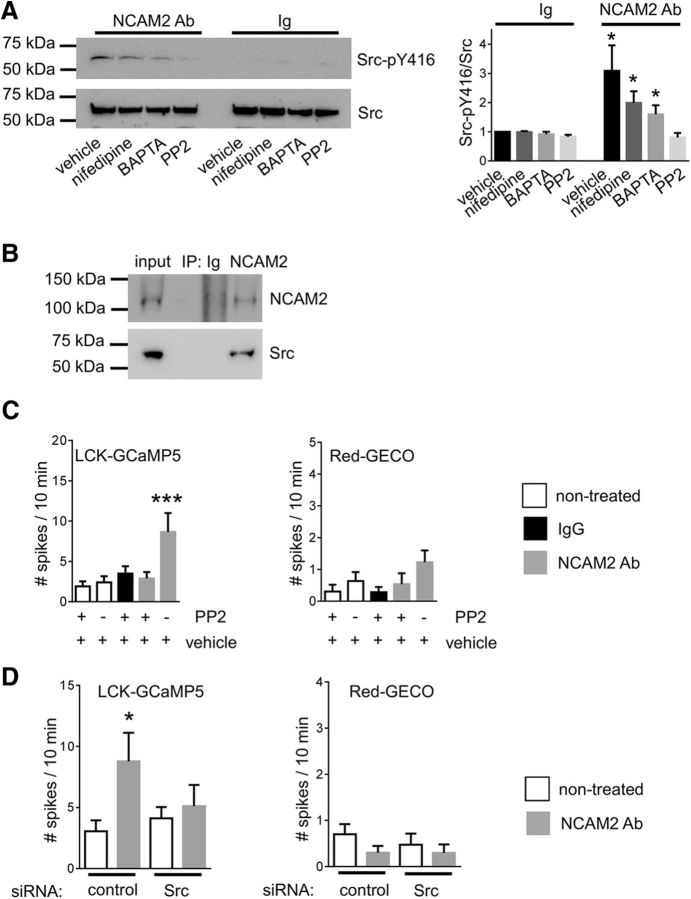
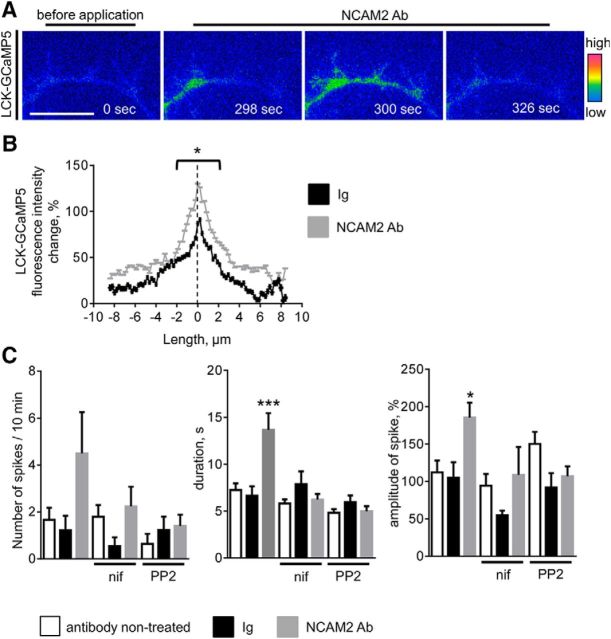
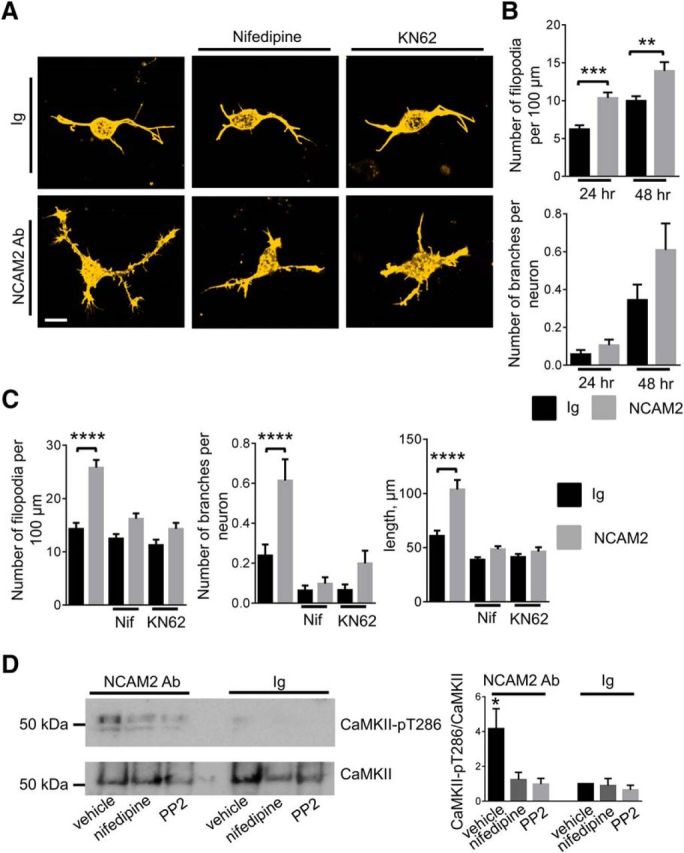
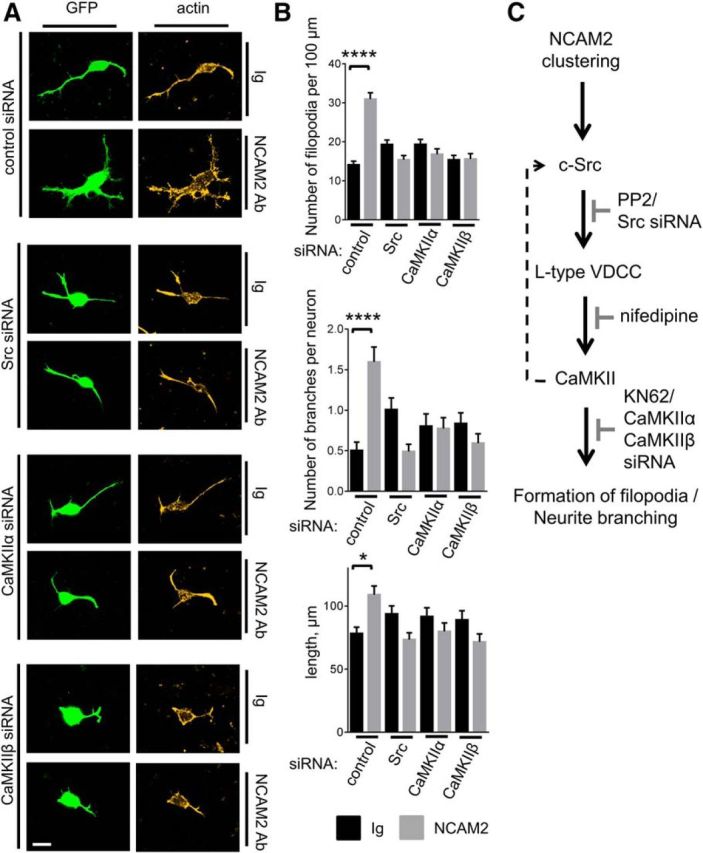
Changes in expression of the neural cell adhesion molecule 2 (NCAM2) have been proposed to contribute to neurodevelopmental disorders in humans. The role of NCAM2 in neuronal differentiation remains, however, poorly understood. Using genetically encoded Ca(2+) reporters, we show that clustering of NCAM2 at the cell surface of mouse cortical neurons induces submembrane [Ca(2+)] spikes, which depend on the L-type voltage-dependent Ca(2+) channels (VDCCs) and require activation of the protein tyrosine kinase c-Src. We also demonstrate that clustering of NCAM2 induces L-type VDCC- and c-Src-dependent activation of CaMKII. NCAM2-dependent submembrane [Ca(2+)] spikes colocalize with the bases of filopodia. NCAM2 activation increases the density of filopodia along neurites and neurite branching and outgrowth in an L-type VDCC-, c-Src-, and CaMKII-dependent manner. Our results therefore indicate that NCAM2 promotes the formation of filopodia and neurite branching by inducing Ca(2+) influx and CaMKII activation. Changes in NCAM2 expression in Down syndrome and autistic patients may therefore contribute to abnormal neurite branching observed in these disorders.

Keywords: calcium; cell adhesion molecule; neurite outgrowth; neurons; voltage-dependent Ca2+ channel.


Figures

Figure 1.
Figure 1.
Genetically encoded Ca2+ reporters detect depolarization-induced and spontaneous changes of intracellular [Ca2+] in cortical neurons. A, Cultured 1- to 3-d-old cortical neurons were transfected with membrane-localized LCK-GCaMP5, cytosolic Red-GECO, or nucleus-localized NLS-Red-GECO. Pseudocolored images of neurons at resting conditions (4 mm K+) and 8 s after application of 90 mm K+ are shown. Note that application of 90 mm K+ induced an increase in LCK-GCaMP5, Red-GECO, and NLS-Red-GECO fluorescence intensities reflecting Ca2+ influx to the respective subcellular compartments. Similar responses were observed in n > 20 neurons in each group. B, C, Time-lapse recordings of neurites of neurons cotransfected with LCK-GCaMP5 and Red-GECO are shown. Note submembrane [Ca2+] spikes reflected by transient increases in intensity of LCK-GCaMP5 fluorescence (arrows). These spikes are either not accompanied (B) or accompanied (C, arrows) by increases in Red-GECO fluorescence intensity. Scale bars, 10 μm. D, The graph shows the amplitude of Red-GECO fluorescence intensity increases at the sites of LCK-GCaMP5 spikes as a function of the amplitude of LCK-GCaMP5 fluorescence intensity increase. Note that the amplitude of the Red-GECO fluorescence intensity increase correlates with the amplitude of the LCK-GCaMP5 fluorescence intensity increase. n = 10 neurons analyzed.
Figure 2.
Figure 2.
NCAM2 activation increases the frequency of submembrane [Ca2+] spikes in young cortical neurons. A, Representative images of cultured 2-d-old cortical neurons incubated for 10 min with nonimmune Igs or antibodies against the extracellular domain of NCAM2 (NCAM2 Ab) and fixed and labeled for NCAM2 are shown. Note that NCAM2 antibodies enhance clustering of NCAM2 at the neuronal cell surface. Scale bar, 20 μm. B, CHO cells transfected with NCAM1 (NCAM140 isoform), NCAM2, or GFP were analyzed by Western blot with antibodies against the extracellular domain of NCAM2, NCAM1, or actin used as the loading control. Note that NCAM2 antibodies recognize overexpressed NCAM2, but not NCAM1. C, Pseudocolored images of a cultured 2-d-old cortical neuron cotransfected with LCK-GCaMP5 and Red-GECO are shown. Images were taken before and after application of NCAM2 antibodies. Arrows show examples of transient LCK-GCaMP5 and Red-GECO fluorescence intensity increases (spikes) along neurites and in the growth cone. Scale bar, 10 μm. D, Graphs show the number of LCK-GCaMP5 or Red-GECO fluorescence intensity spikes in nontreated neurons and in neurons treated with nonimmune Igs or NCAM2 antibodies (NCAM2 Ab) for 10 min (mean + SEM; n > 15 neurons in each group). **p < 0.01, one-way ANOVA with Tukey's multiple-comparison test. Note that application of NCAM2 antibodies induces an increase in the frequency of submembrane [Ca2+] spikes. E, The graph shows the amplitude of Red-GECO fluorescence intensity increases at the sites of LCK-GCaMP5 spikes as a function of the amplitude of LCK-GCaMP5 fluorescence intensity increase in neurons treated with NCAM2 antibodies. Note the LCK-GCaMP5 fluorescence spikes, which are not accompanied by cytosolic Red-GECO spikes. n = 12 neurons analyzed.
Figure 3.
Figure 3.
LCK-GCaMP5 and Red-GECO detect ionomycin-induced increases in submembrane and cytosolic [Ca2+] in somata and neurites of cortical neurons. A, Pseudocolored images of a 2-d-old cortical neuron cotransfected with LCK-GCaMP5 and Red-GECO are shown. Images were taken before and after application of ionomycin. Note an increase in submembrane and cytosolic [Ca2+] after application of ionomycin. Scale bar, 10 μm. B, Graphs show changes in fluorescence intensities of LCK-GCaMP5 and Red-GECO in neurites of cultured 1- to 3-d-old cortical neurons before and after application of ionomycin. An individual recording (top) and the average of n = 11 recordings (mean ± SEM) are shown. Fluorescence intensities were normalized to the mean fluorescence intensities before application of ionomycin, set to 0. C, Graphs show mean + SEM amplitudes of LCK-GCaMP5 and Red-GECO fluorescence intensity increases in response to ionomycin in somata and neurites of neurons (n = 11 neurons in each group were analyzed).
Figure 4.
Figure 4.
LCK-GCaMP5 and Red-GECO have similar activation thresholds. A, Pseudocolored images of a 3-d-old cortical neuron cotransfected with LCK-GCaMP5 and Red-GECO are shown. The neuron was preincubated in the Ca2+-free buffer containing 1 mm EGTA to deplete internal Ca2+ stores, placed in the Ca2+-free buffer, and imaged in the presence of 3 μm ionomycin and indicated Ca2+ concentrations. Note the increases in LCK-GCaMP5 and Red-GECO fluorescence intensity at Ca2+ concentrations above 0.6 mm. Scale bar, 10 μm. B, Graphs show fluorescence intensities of LCK-GCaMP5 and Red-GECO in somata and neurites of cultured 1- to 3-d-old cortical neurons at indicated concentrations of Ca2+. Mean ± SEM values from n = 11 recordings are shown. Fluorescence intensities were normalized to the fluorescence intensities in the Ca2+-free buffer, set to 0.
Figure 5.
Figure 5.
NCAM2 activation induces a steady increase in submembrane and cytosolic [Ca2+] in a subpopulation of highly active cortical neurons. A, B, Pseudocolored images of 2-d-old cortical neurons cotransfected with LCK-GCaMP5 and Red-GECO are shown. Images were taken before and after application of antibodies against NCAM2. Note a steady increase in submembrane and cytosolic [Ca2+] after application of NCAM2 antibodies in the neuron shown in A and submembrane [Ca2+] spikes in the neuron shown in B. At the end of recordings, neurons were fixed and colabeled with antibodies against active caspase-3 (right). Note the higher levels of the active caspase-3 in the neuron in A. C, Graphs show changes in fluorescence intensities of LCK-GCaMP5 and Red-GECO in the soma and neurites of the neuron shown in A. Fluorescence intensities were normalized to the mean fluorescence intensities before application of NCAM2 antibodies, set to 0. D, An example of an active caspase-3-positive apoptotic neuron is shown. Scale bars, 10 μm.
Figure 6.
Figure 6.
NCAM2-dependent submembrane [Ca2+] spikes are L-type VDCC dependent. A, Neurites of cultured cortical neurons treated with nonimmune Igs or NCAM2 antibodies, fixed, and colabeled with antibodies against NCAM2 and L-type VDCCs are shown. Note clusters of NCAM2 colocalized with accumulations of L-type VDCCs (arrows). Scale bar, 10 μm. B, The graph shows mean + SEM numbers of submembrane and cytosolic [Ca2+] spikes in neurons cotransfected with LCK-GCaMP5 and Red-GECO over the 10 min recording time (n > 13 neurons were analyzed in each group). Neurons were either not treated or treated with control nonimmune Igs or NCAM2 antibodies in the presence of nifedipine, an inhibitor of L-type VDCCs, or vehicle (DMSO), used to prepare the stock solution of nifedipine. Note that the NCAM2-dependent increase in the number of submembrane [Ca2+] spikes detectable with the LCK-GCaMP5 reporter is abolished by nifedipine. *p < 0.05, one-way ANOVA with Dunnett's multiple-comparison test.
Figure 7.
Figure 7.
NCAM2 activation does not potentiate the depolarization-induced Ca2+ influx in young cultured cortical neurons. A, Pseudocolored images of a 2-d-old cultured cortical neuron cotransfected with LCK-GCaMP5 and Red-GECO and treated with 90 mm K+ to analyze depolarization-induced Ca2+ influx are shown. The 90 mm K+–containing buffer was applied after recording the spontaneous activity shown in Figure 2C. Images shown were captured immediately before and at 10 s after application of 90 mm K+. Note an increase in the fluorescence intensity of the reporters observed after the application of 90 mm K+. Scale bar, 10 μm. B, C, The graphs show mean ± SEM fluorescence intensities of LCK-GCaMP5, Red-GECO, and NLS-Red-GECO in somata (B) and fluorescence intensities of LCK-GCaMP5 and Red-GECO in neurites (C) of cultured 1- to 3-d-old cortical neurons before (first 10 s) and after application of the 90 mm K+–containing buffer. Fluorescence intensities were normalized to the mean fluorescence intensities before application of 90 mm K+. Neurons were pretreated for 10 min with nonimmune Igs or NCAM2 antibodies. Note that 90 mm K+-induced changes in the fluorescence intensities of Ca2+ reporters are not increased in NCAM2 antibody-treated versus Ig-treated neurons. D, E, Graphs show mean + SEM amplitudes of LCK-GCaMP5, Red-GECO, and NLS-GECO fluorescence intensity increases in response to 90 mm K+ and the half-life (time1/2) of LCK-GCaMP5, Red-GECO, and NLS-GECO fluorescence intensity decay after reaching the peak in somata (D) and neurites (E) of neurons pretreated with Ig or NCAM2 antibodies (n = 10–15 neurons analyzed in each group). Note that the amplitude of the 90 mm K+-induced increase in LCK-GCaMP5 fluorescence is reduced in neurites of neurons treated with NCAM2 antibodies compared to neurons treated with Ig. **p < 0.01, t test.
Figure 8.
Figure 8.
NCAM2 activates c-Src and induces submembrane [Ca2+] spikes in a c-Src-dependent manner. A, Growth cones isolated from the brain tissue of 1- to 3-d-old mice and treated with nonimmune Igs or NCAM2 antibodies in the presence or absence of nifedipine, BAPTA-AM, or c-Src-kinase family inhibitor PP2 were analyzed by Western blot with antibodies against total and autophosphorylated activated c-Src. Note that NCAM2 antibodies induce an increase in the level of activated c-Src, and that this increase is reduced by BAPTA-AM and nifedipine and is blocked by PP2. The graph shows the quantification of the blots (mean + SEM; n = 6), with signals in growth cones treated with Ig in the absence of inhibitors set to 1. B, NCAM2 immunoprecipitates from the brain lysates of 1- to 3-d-old mice were probed by Western blot with antibodies against NCAM2 and c-Src. Mock immunoprecipitation with nonimmune Igs served as a control. Note that c-Src coimmunoprecipitated with NCAM2. C, The graph shows mean + SEM numbers of submembrane and cytosolic [Ca2+] spikes in neurons cotransfected with LCK-GCaMP5 and Red-GECO over a 10 min recording time (n > 13 neurons analyzed in each group). Neurons were either not treated or treated with control nonimmune Igs or NCAM2 antibodies in the presence of PP2 or vehicle (DMSO) used to prepare the stock solution of PP2. Note that the NCAM2-dependent increase in the number of submembrane [Ca2+] spikes detectable with the LCK-GCaMP5 reporter is abolished by PP2. D, The graph shows mean + SEM numbers of submembrane and cytosolic [Ca2+] spikes in neurons cotransfected with LCK-GCaMP5, Red-GECO, and control siRNA or Src siRNA over a 10 min recording time (n > 18 neurons analyzed in each group). Neurons were analyzed before and after application of NCAM2 antibodies. Note that the NCAM2-dependent increase in the number of submembrane [Ca2+] spikes detectable with the LCK-GCaMP5 reporter is abolished by Src siRNA. *p < 0.05, ***p < 0.001, one-way ANOVA with Dunnett's multiple-comparison test.
Figure 9.
Figure 9.
NCAM2 activation induces increased submembrane [Ca2+] spikes at the bases of filopodia. A, Examples of submembrane [Ca2+] spikes along a neurite of a 2-d-old cultured cortical neuron cotransfected with LCK-GCaMP5. Images were taken before and after application of NCAM2 antibodies and are shown in pseudocolor. Note the [Ca2+] increase at the bases of filopodia. Scale bar, 5 μm. B, The graph shows the changes of LCK-GCaMP5 fluorescence intensity during the spike (mean + SEM, n > 20 spikes analyzed) along neurites in the vicinity of the bases of filopodia. The dashed line denotes the center of the filopodial base. Spikes in neurons treated with control nonimmune Igs or NCAM2 antibodies were analyzed. Note that the highest increases in LCK-GCaMP5 fluorescence are observed at the bases of filopodia. The increase is higher in NCAM2 Ab-treated neurons. *p < 0.05, t test for measurements within 2 μm of the center of filopodial base. C, Graphs show the numbers, durations, and amplitudes (mean + SEM) of submembrane [Ca2+] spikes observed at the bases of filopodia in neurons before application of antibodies (nontreated) and after application of control nonimmune Igs or NCAM2 antibodies. When indicated, neurons were preincubated with nifedipine (nif) or PP2. *p < 0.05, ***p < 0.001, one-way ANOVA with Tukey's multiple-comparison test (n > 11 neurons analyzed in each group). Note the increased amplitudes and durations of the submembrane [Ca2+] spikes in neurons treated with NCAM2 antibodies.
Figure 10.
Figure 10.
NCAM2 activation promotes the formation of filopodia and neurite branching in an L-type VDCC-, c-Src-, and CaMKII-dependent manner. A, Images of cortical neurons incubated for 24 h with control nonimmune Igs or NCAM2 antibodies in the absence or presence of the L-type VDCC inhibitor (nifedipine) or CaMKII inhibitor (KN62). Neurons were labeled with fluorescent phalloidin to detect filamentous actin and visualize filopodia. Note the higher density of filopodia and branches along neurites of neurons treated with NCAM2 antibodies in the absence of inhibitors compared to neurons incubated with Ig. Note that this effect is blocked by the inhibitors. Scale bar, 10 μm. B, Graphs show the numbers of filopodia per 100 μm of neurite length and numbers of branching neurites per neuron (mean + SEM) in neurons treated with nonimmune Igs or NCAM2 antibodies for 24 h (n > 100 neurons analyzed) or 48 h (n > 60 neurons analyzed). **p < 0.01, ***p < 0.001, one-way ANOVA with Tukey's multiple-comparison test. C, Graphs show numbers of filopodia per 100 μm of neurite length, numbers of branching neurites per neuron, and total lengths of all neurites per neuron in neurons treated for 24 h with nonimmune Igs or NCAM2 antibodies in the absence or presence of nifedipine or KN-62. Mean + SEM values are shown. ****p < 0.0001, one-way ANOVA with Tukey's multiple-comparison test (n > 100 neurons analyzed in each group). D, Growth cones isolated from the brain tissue of 1- to 3-d-old mice and treated with nonimmune Igs or NCAM2 antibodies in the presence or absence of nifedipine or PP2 were analyzed by Western blot with antibodies against total and autophosphorylated activated CaMKII. Note that NCAM2 antibodies induce an increase in the level of activated CaMKII, and that this increase is reduced by PP2 and nifedipine. The graph shows quantification of the blots (mean + SEM, n = 3 experiments). *p < 0.05, one-way ANOVA with Dunnett's multiple-comparison test. Signals in growth cones treated with Ig in the absence of inhibitors were set to 1.
Figure 11.
Figure 11.
NCAM2-dependent formation of filopodia and neurite branching are inhibited in neurons transfected with c-Src, CaMKIIα, or CaMKIIβ siRNA. A, Images of cortical neurons cotransfected with GFP and control siRNA, Src siRNA, CaMKIIα siRNA, or CaMKIIβ siRNA and incubated for 24 h with control nonimmune Igs or NCAM2 antibodies. Neurons were labeled with fluorescent phalloidin to detect filamentous actin and visualize filopodia. Note the NCAM2-dependent increase in the density of filopodia and branches in neurons transfected with control siRNA, and that this effect is inhibited by c-Src, CaMKIIα, and CaMKIIβ siRNAs. Scale bar, 10 μm. B, Graphs show numbers of filopodia per 100 μm of neurite length, numbers of branching neurites per neuron, and total lengths of all neurites per neuron in neurons treated for 24 h with nonimmune Igs or NCAM2 antibodies. Neurons were transfected with control siRNA, Src siRNA, CaMKIIα siRNA, or CaMKIIβ siRNA. Mean + SEM values are shown. *p < 0.05, ****p < 0.0001, one-way ANOVA with Tukey's multiple-comparison test (n > 100 neurons analyzed in each group). C, Schematic representation of the proposed NCAM2-activated signaling pathway is shown. NCAM2 activation at the neuronal cell surface induces activation of c-Src, followed by activation of L-type VDCCs. Ca2+ influx via L-type VDCCs results in activation of CaMKII, which promotes formation of filopodia and neurite branching. A proposed CaMKII-mediated positive feedback loop that enhances c-Src activation after the initial Ca2+ influx is shown as a dashed line. Steps inhibited by the c-Src inhibitor PP2, Src siRNA, L-type VDCC blocker nifedipine, CaMKII inhibitor KN62, CaMKIIα siRNA, or CaMKIIβ siRNA are also indicated (gray).

References

    1. Akerboom J, Chen TW, Wardill TJ, Tian L, Marvin JS, Mutlu S, Calderón NC, Esposti F, Borghuis BG, Sun XR, Gordus A, Orger MB, Portugues R, Engert F, Macklin JJ, Filosa A, Aggarwal A, Kerr RA, Takagi R, Kracun S, et al. Optimization of a GCaMP calcium indicator for neural activity imaging. J Neurosci. 2012;32:13819–13840. doi: 10.1523/JNEUROSCI.2601-12.2012. - DOI - PMC - PubMed
    1. Akeson EC, Lambert JP, Narayanswami S, Gardiner K, Bechtel LJ, Davisson MT. Ts65Dn–localization of the translocation breakpoint and trisomic gene content in a mouse model for Down syndrome. Cytogenet Cell Genet. 2001;93:270–276. doi: 10.1159/000056997. - DOI - PubMed
    1. Alenius M, Bohm S. Identification of a novel neural cell adhesion molecule-related gene with a potential role in selective axonal projection. J Biol Chem. 1997;272:26083–26086. doi: 10.1074/jbc.272.42.26083. - DOI - PubMed
    1. Alenius M, Bohm S. Differential function of RNCAM isoforms in precise target selection of olfactory sensory neurons. Development. 2003;130:917–927. doi: 10.1242/dev.00317. - DOI - PubMed
    1. Aricescu AR, Jones EY. Immunoglobulin superfamily cell adhesion molecules: zippers and signals. Curr Opin Cell Biol. 2007;19:543–550. doi: 10.1016/j.ceb.2007.09.010. - DOI - PubMed

Publication types

MeSH terms